An Odd One: April 2023 Recap
New Jersey State Climatologist
Center for Environmental Prediction, School of Environmental and Biological Sciences/NJAES
Rutgers University
May 8, 2023
Overview
What can you say about a month that began with a swarm of tornadoes, finished with flooding rain, and in between, featured record heat, wildfires, and increasing drought concerns? Best to say that it was an odd one! Fitting this theme, the statewide average temperature of 55.4° was 3.9° above the 1991–2020 normal. This ranks as the third warmest April on record (since 1895) only behind 2017 and 2010 for top honors (Table 1). April was the fifth month of the past ten ranking in the top 10, joining July (#7), August (#1), January (#1), and February (#5; Figure 1). The first four months of 2023 come in as the warmest start of the year on record with an average of 44.4°. This exceeds the previous record of 44.2° in 2012, with seven of the 10 warmest January–April periods (1895–present) occurring since 2002. The average April maximum temperature across NJ was 67.4° (+4.7°, 3rd warmest) and the average minimum was 43.4° (+3.1°, 5th warmest). Northern counties averaged 53.5° in April (+3.6°, 5th warmest), southern counties 56.6° (+4.0, 2nd warmest), and the coastal zone 55.8° (+4.1°, 2nd warmest).
| Rank | Year | April Avg. Tmp. |
| 1 | 2017 | 55.9° |
| 2 | 2010 | 55.5° |
| 3 | 2023 | 55.4° |
| 4 | 1921 | 55.3° |
| 5 | 2019 | 54.8° |
| 6 | 1941 | 54.4° |
| 7 | 2011 | 53.9° |
| 7 | 2002 | 53.9° |
| 9 | 1994 | 53.7° |
| 10 | 1960 | 53.6° |
Table 1. The 10 mildest Aprils across NJ since 1895.
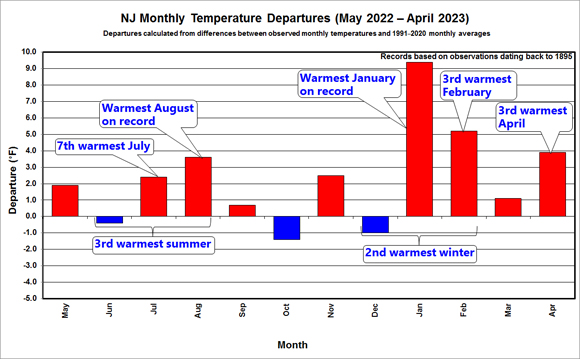
Figure 1. Monthly temperature departures from 1991–2020 normals from May 2022 to April 2023. Included are annotations for months and seasons ranking in the top 10 (1895–2023). Red bars depict months with above normal temperatures, and blue bars below normal.
April precipitation averaged 5.84” across New Jersey. This was 2.14” above normal, ranking as the 10th wettest on record. It was the wettest April since 2007 and second wettest since 1983 (Table 2). All but scattered areas in the northwest received above-normal precipitation, the greatest amounts falling near the Atlantic and Delaware Bay coasts (Figure 2). Northern counties averaged 5.55” (+1.65”, 26th wettest), southern counties 6.04” (+2.49”, 7th wettest), and the coastal zone 5.94” (+2.39”, 10th wettest). It is important to note that these totals and those for individual stations in the next section, do not include heavy rain that fell after standard early morning observation times at CoCoRaHS and National Weather Service Cooperative stations on April 30th. These rains were reported in morning observations on May 1st, thus will be included in May totals.
| Rank | Year | April Avg. Precip. |
| 1 | 1983 | 9.00" |
| 2 | 2007 | 8.45" |
| 3 | 1952 | 6.84" |
| 4 | 1973 | 6.49" |
| 5 | 1929 | 6.36" |
| 6 | 1980 | 6.27" |
| 7 | 1924 | 6.05" |
| 7 | 1901 | 6.05" |
| 9 | 1964 | 5.90" |
| 10 | 2023 | 5.84" |
| 10 | 1913 | 5.84" |
Table 1. The 11 wettest Aprils across NJ since 1895.
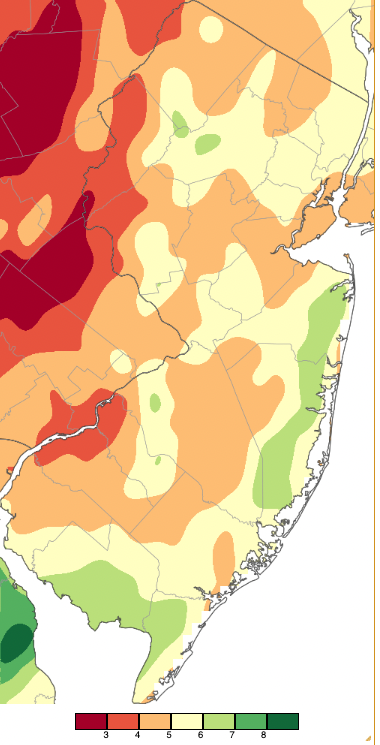
Figure 2. April 2023 precipitation across New Jersey based on a PRISM (Oregon State University) analysis generated using NWS Cooperative, CoCoRaHS, NJWxNet, and other professional weather station observations from approximately 8 AM on March 31st to 8 AM on April 30th. Note the scale in inches at the bottom of the map. Totals range from 2.00”–3.00” (dark red) to 8.00”–9.00” (dark green).
While some snowflakes flew in northern hills on the 18th, there was no accumulating snow in April. As mentioned in last month’s report, this means the state has experienced its 4th least snowy season on record at 4.8” (period of record 1895/96–present), which is 20.5” below normal. Only 1972/1973 with 4.0”, 1918/1919 with 4.3”, and 2019/2020 with 4.7” saw less. Northern counties averaged 13.8” for the season (-21.2”, 7th least snowy) and central ones 3.9” (-24.5”, 3rd least snowy). In the south, the 0.4” seasonal average was 18.1” below normal and was the least snowy on record, surpassing the previous minimum of 0.8” in 2019/2020. A final seasonal snowfall map will be included in the May report.
Precipitation and Storms
Following two consecutive months of below-normal precipitation, April “threatened” to continue this behavior until soaking rains at month’s end brought above-normal monthly amounts to all but the northwest. The wettest CoCoRaHS location was Maurice River (Cumberland County) with 7.71”, followed by Little Silver (Monmouth) with 7.44”, Eatontown (Monmouth) and Wall Township (Monmouth) each with 7.26”, Mount Laurel (Burlington) 7.21”, and North Arlington (Bergan) 7.08”. While these are official April totals, if you include rainfall from the morning of the 30th to the morning of May 1st (most of this rain fell before midnight on the 30th), the wettest stations for the 31 days from the morning of March 31st to early on May 1st include Eatontown 10.88”, Little Silver 10.64”, and North Arlington 10.06”.
On the dry side, Greenwich Township (Warren) with 3.16” saw the least April rain through the morning of the 30th. This was followed by Kingwood (Hunterdon) with 3.32”, Blairstown (Warren) 3.51”, Knowlton Township (Warren) 3.54”, and Hardyston (Sussex) 3.76”. With rain on the 30th into May 1st, the driest location for the 31 days became Kingwood with 4.86”, followed by Greenwich (Warren) at 5.13”, and Frelinghuysen Township (Warren) 5.20”.
The month began on a turbulent note. A squall line crossing the state during the late afternoon and evening of the 1st brought brief heavy rain to a number of locations, rice size to half inch diameter hail to locations in Monmouth County, and a daily record-tying seven tornadoes (Table 3). All but one of the twisters was spawned by a supercell that traveled from west to east along the Interstate 195 corridor from just south of Trenton (Mercer) to the coastal border of Monmouth and Ocean counties. The seventh tornado touched down in Atlantic County (Figure 3). There were also waterspouts spotted off the northern coast and close to Atlantic City (Atlantic). All of the twisters were rated EF1 or EF2 in strength. Considerable damage to buildings, trees, and powerlines occurred from these storms and associated strong straight-line winds accompanying the squall line. Fortunately, there were no deaths or serious injuries in NJ, though there was one death associated with a powerful EF3 tornado in southern Delaware. A 71-mph gust was reported at the Sea Girt (Monmouth) NJWxNet station that is located several hundred yards from the EF2 tornado that destroyed a building on the grounds of the National Guard and State Police training facility. Since records began in 1950, only November 16, 1989, has seen as many as seven tornados in a day, with two at F1 and five F0 (estimated strengths differ little between lower end Fujita [F] and Enhanced Fujita [EF] scale tornadoes). Only six April twisters had struck NJ before this April’s onslaught. Only one of them in 1974 was as strong as an F2.
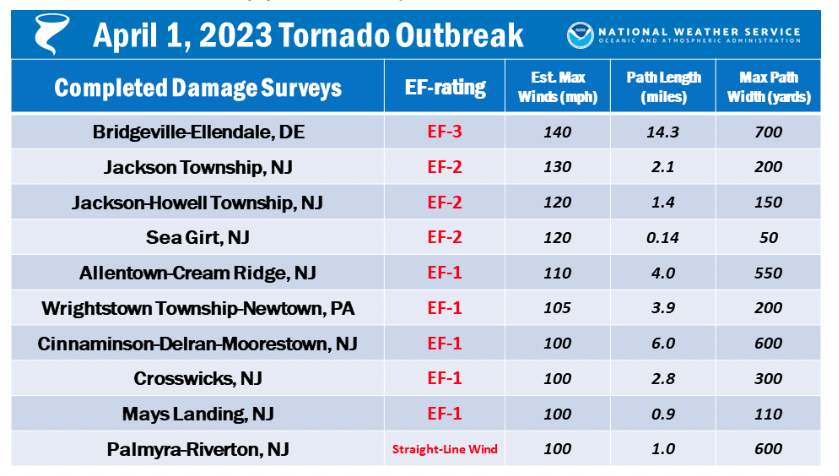
Table 3. National Weather Service summary of the seven tornadoes that touched down in New Jersey on April 1st. Also included are tornadoes in Delaware and Pennsylvania, and a report of strong straight-line winds at a NJ location.

Figure 3. National Weather Service survey reports of each of the seven NJ tornadoes on April 1 from first touchdown (top) to last (bottom two).
In addition to the Sea Girt gust, other notable gusts at NJWxNet stations on the 1st included Pennsauken (Camden) 63 mph, Lower Alloways Creek Township (Salem) 63 mph, Cream Ridge (Monmouth) 62 mph, Point Pleasant (Ocean) 61 mph, Moorestown (Burlington) 60 mph, six stations from 50–54 mph, and 12 from 40–49 mph. On the backside of the front, the 2nd found winds gusting to 49 mph at Vernon Township (Sussex), 48 mph at both Harvey Cedars (Ocean) and Little Egg Harbor Township (Ocean), and seven stations from 40–47 mph.
Rainfall from the powerful squall line was greatest within the supercell path. Millstone (Monmouth) saw 1.18”, Mansfield (Burlington) 1.04”, and Burlington (Burlington) 1.01”, while 103 of 243 CoCoRaHS reports came in from 0.50”–0.97”.
A long stretch of quite dry weather extended from the 2nd to the 14th. The only exception was heavy rain in Cape May County on the evening of the 6th. Sea Isle City led the way with 2.11”, three Middle Township stations with 1.96”, 1.71”, and 1.54”, and from 1.42”–1.81” at five Lower Township sites. Only 18 of the 242 CoCoRaHS reports received as much as 0.50”–1.38”. Otherwise, multiple days during this interval experienced low humidity, brisk winds, abundant sunshine, and above-normal temperature. This at the time of year when deciduous trees have yet to leaf out, grasses are only beginning to green up and moisten, and abundant debris from the fall and winter covers the dry ground. This was an ideal recipe for wildfires to burst out across the state, and they did. This outbreak peaked between the 11th and 14th, with some fires burning until the 18th. The largest was a Pinelands fire in Manchester Township (Ocean) that consumed 3,859 acres. Another southern fire burned 1,607 acres in Little Egg Harbor Township. One of the largest fires in north Jersey in recent years burned 972 acres in West Milford (Passaic; Figure 4). The largest brush fire occurred near Liberty State Park in Jersey City (Hudson) on the 11th. This included a recycling facility, which appears to be the only major structural damage among all of these fires.
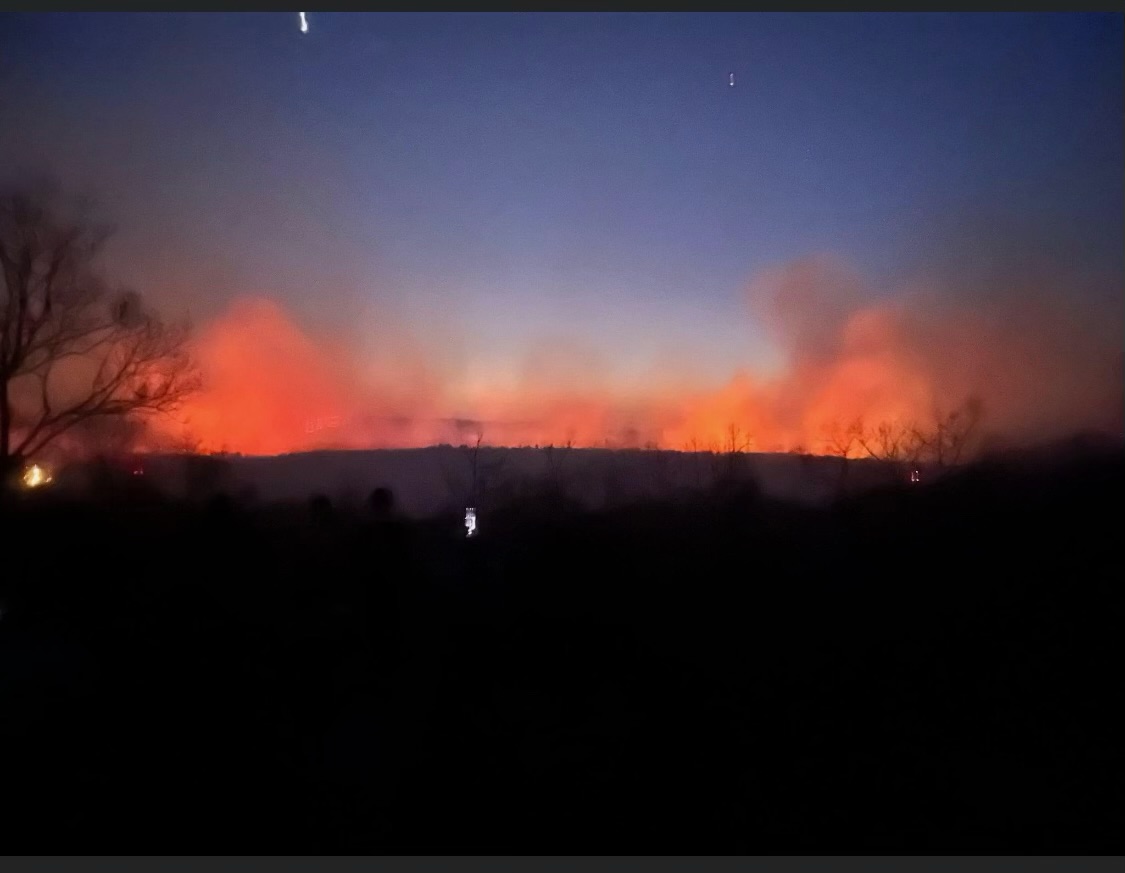
Figure 4. Evening photo of the West Milford wildfire on April 12th (source unknown).
Rounds of afternoon and evening thunderstorms on the 15th helped reduce the fire danger and extinguish some of the fires. Some storms followed one another in a training fashion, in the process dropping large amounts of rain while other locations came up with little rain (Figure 5). Fredon Township (Sussex) took top honors with 3.45”, followed by Hopewell Township (Mercer) 3.07”, Newton (Sussex) 2.79”, Andover (Sussex) 2.70”, Plainsboro (Middlesex) 2.60”, Hackettstown (Warren) 2.60”, and Mount Laurel 2.55”. There were numerous reports of hail in central and northern counties, with diameters of as much as an inch in Mount Laurel, Middlesex (Middlesex), and Stanhope (Sussex). Tree damage was noted in several Burlington County locations. All told, 18 CoCoRaHS stations (out of 263) received 2.00”–3.45” and 63 caught from 1.00”–1.99”.
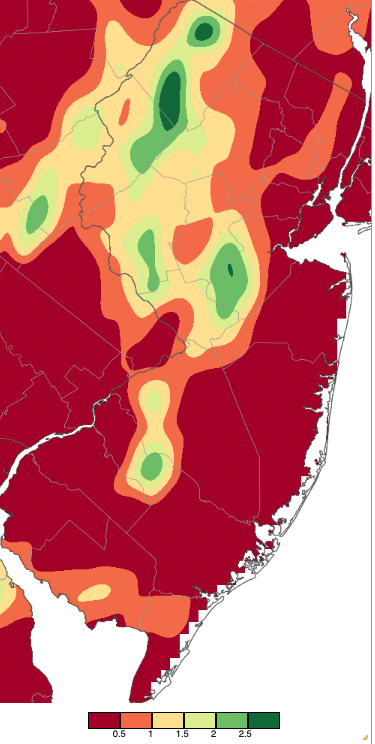
Figure 5. Precipitation across New Jersey from 8 AM on April 15th through 8 AM April 16th based on a PRISM (Oregon State University) analysis generated using NWS Cooperative, CoCoRaHS, NJWxNet, and other professional weather station observations. Note the scale in inches beneath the map.
The afternoon of the 22nd brought scattered thunderstorms in advance of an eastward-moving evening squall line that was followed by a period of steady rain persisting through daybreak on the 23rd. Of 258 CoCoRaHS reports, 23 were from 2.00”–2.70”, with 132 from 1.00”–1.98” (Figure 6). Tenafly (Bergen) led the way with 2.70”, followed by Harrison (Hudson) 2.40”, Glen Rock (Bergen) 2.34”, Hawthorne (Passaic) 2.26”, and Montvale (Bergen) 2.24”. This was welcome rain in the northeast corner of the state where, days earlier, drought conditions had first been noted on the US Drought Monitor map. The storms dropped pea- to dime-size hail in at least five north and central NJ counties. Wind gusts at NJWxNet stations topped out a 40 mph in Pittstown (Hunterdon), Moorestown, and Pennsauken.
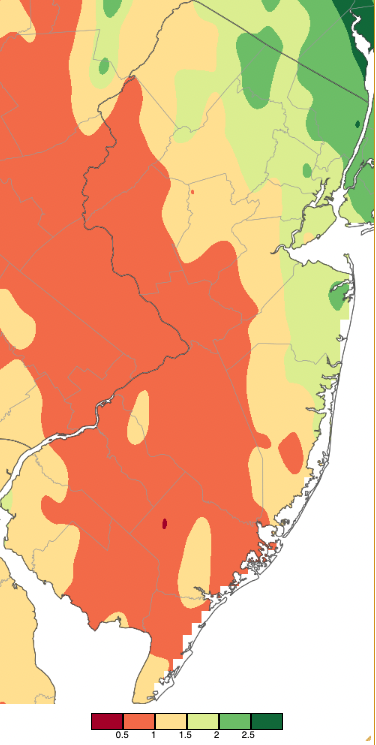
Figure 6. Precipitation across New Jersey from 8 AM on April 22nd through 8 AM April 24th based on a PRISM (Oregon State University) analysis generated using NWS Cooperative, CoCoRaHS, NJWxNet, and other professional weather station observations. Note the scale in inches beneath the map.
As mentioned previously, April ended on a very wet note across the entire state with two heavy rain events that were separated by a day of persistent drizzle on the 29th throughout all but the far south, where the sun emerged for a time. The first began on the 28th with rain spreading northward from midday into the afternoon. Totals for round one of the event running through morning observation time on the 30th (which included the drizzle of the 29th) were most impressive just inland of the coast in Ocean and Monmouth counties and in Cumberland County (Figure 7). Toms River (Ocean) reported 5.06”, Beachwood (Ocean) 4.51”, Pine Beach (Ocean) 4.46”, Eatontown 4.23”, Stafford Township (Ocean) 4.20” and 3.61”, Berkeley Township (Ocean) 4.09”, Wall Township (Monmouth) 4.02”, and Little Silver 4.00”. In Cumberland County, Fortescue received 4.26”, and in nearby Dennis (Cape May), 4.05” accumulated. Wantage (Sussex) received the least rain with 0.89” falling, with only five of the 270 CoCoRaHS stations catching under an inch. Winds along the coast were strong during the event, gusting to 41 mph at Atlantic City Marina (Atlantic) on the 28th. An early-morning thunderstorm on the 29th produced a 62-mph gust at Little Egg Harbor Township with gusts during the day up to 42 mph in Harvey Cedars, 41 mph at Atlantic City Marina, and 40 mph in Sea Girt.
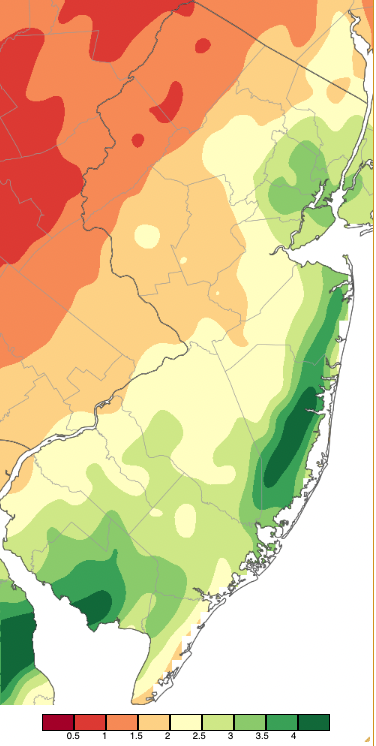
Figure 7. Precipitation across New Jersey from 8 AM on April 28th through 8 AM April 30th based on a PRISM (Oregon State University) analysis generated using NWS Cooperative, CoCoRaHS, NJWxNet, and other professional weather station observations. Note the scale in inches beneath the map.
Round 2 is discussed in this report rather than waiting for the May report, despite, as mentioned previously, the rain falling after observation time on the morning of the 30th. Again, most of the daytime and evening rain had ended by midnight on the 30th. Rain was again heaviest in Ocean and Monmouth counties, but the bulk of NJ received a good soaking (Figure 8). Eatontown added to their previous impressive total with 3.62”, followed by Manchester Township 3.38”, Lakewood (Ocean) 3.29”, Springfield (Union) 3.23”, Little Silver 3.20”, and Westfield (Union) 3.03”. 99 CoCoRaHS stations received 2.00”–2.99” and 157 from 1.00”–1.99”. Barnegat Light (Ocean) with 0.74” caught the least with just four of 263 CoCoRaHS stations coming in under an inch. During the course of the two-part event and for several days into early May, some streams and rivers spilled out of their banks, resulting in some road closures but no notable damage.
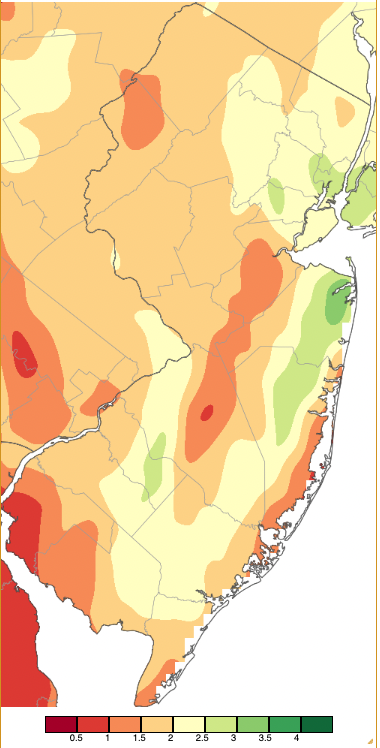
Figure 8. Precipitation across New Jersey from 8 AM on April 30th through 8 AM May 1st based on a PRISM (Oregon State University) analysis generated using NWS Cooperative, CoCoRaHS, NJWxNet, and other professional weather station observations. Note the scale in inches beneath the map.
The highest barometric pressures during April occurred on the 8th at 30.50”–30.60”. Statewide pressures on the 30th fell to impressive minimums of 29.00”–29.10”. There were no days with 40 mph or greater gusts other than the five mentioned previously. It should be noted that the often-windy High Point Monument (Sussex) station’s anemometer was out of commission from the 1st to the 20th.
The abundant late-month rains put a rapid dent into developing dry/drought conditions across the state. Enough so that the May 4th US Drought Monitor map eliminated any areas of moderate drought (D1) or abnormally dry (D0) conditions from New Jersey. This is the first time since the December 7, 2021, that the state has been completely devoid of any dry or drought designations.
Temperature
An impressive eight April days found multiple NJWxNet stations with high temperatures of 80° or greater. The first was the 5th with Mannington (Salem) topping out at 81° and three stations at 80°. Meanwhile, High Point Monument only made it up to 49°. The wide range in afternoon temperatures was a function of a nearly stationary warm front draped across the state and low clouds to its north. Figure 9 shows the mid-afternoon temperature range along with the distribution of incoming solar radiation, representing the distribution of cloud cover. Hammonton (Atlantic) and Oswego Lake (Burlington) hit 88° on the 6th, with the nearby cool ocean keeping Harvey Cedars no higher than 66°.
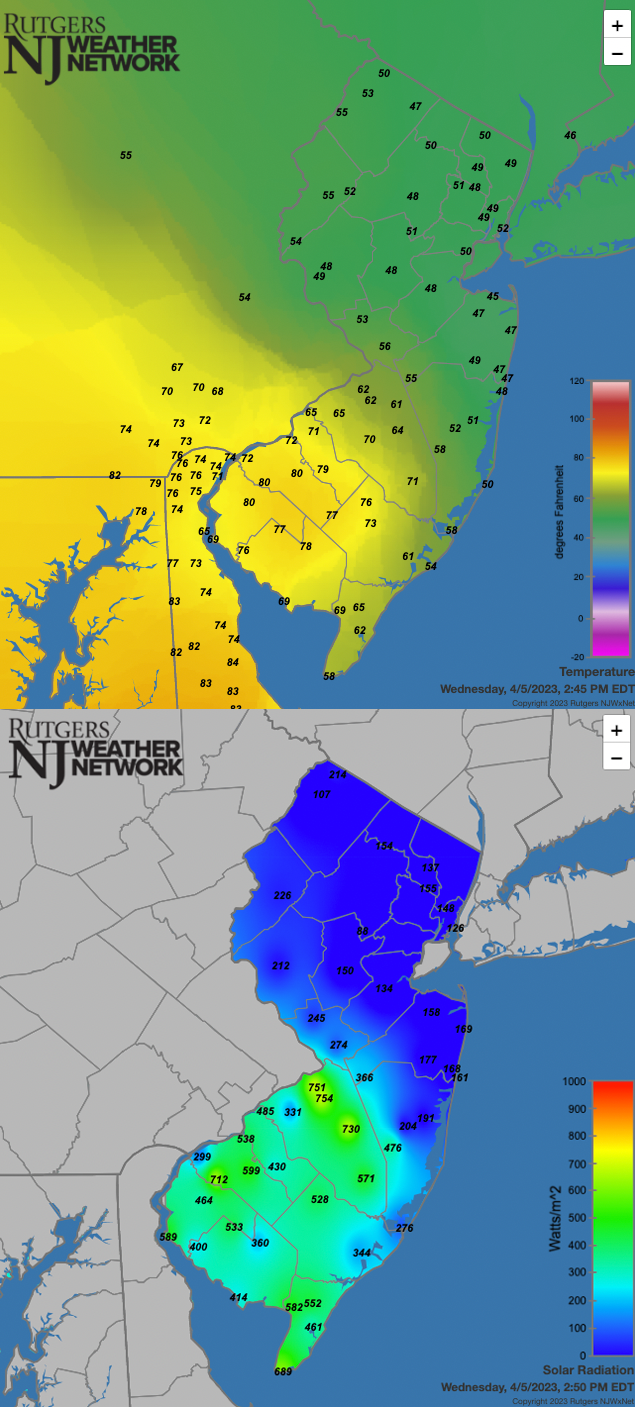
Figure 9. Temperatures at NJWxNet and some other stations on April 5th at 2:55 PM (top) and incoming solar radiation at NJWxNet stations at the same time (bottom).
A four-day warm spell began on the 12th with Jersey City and Sicklerville (Camden) at 86° and 53 of the 65 NJWxNet stations from 80°–85°. Southerly winds kept an Atlantic coast sea breeze at bay and chilled Fortescue on the Delaware Bay shore to a high of 69°. What proved to be the warmest day of the month and the first 90° temperatures of 2023 arrived on the 13th with the northwest taking top honors at 92° in Sandyston (Sussex) and 91° at Walpack (Sussex; Figure 10). Indicative of the dry air, the morning low at Walpack was a state low of 41°, 50° below its maximum. Sandyston’s low was 43°. Six other stations reached 90°, and 56 from 80°–89°, leaving Fortescue at 75° the only NJWxNet station below 80°. Little Falls (Passaic), North Haledon (Passaic), and Sandyston hit 92° on the 14th, followed by eight locations either 90° or 91°, and 48 stations from 80°–89°. An Atlantic sea breeze kept Atlantic City Marina at 70° and Fortescue also 70°. Sicklerville reached 82° on the 15th and six stations 80°.
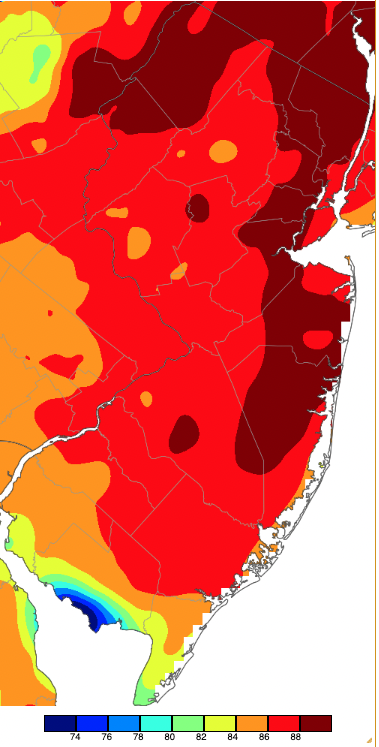
Figure 10. Maximum temperatures on April 13th based on a PRISM (Oregon State University) analysis generated using NWS, NJWxNet, and other professional weather stations. Note the 2-degree scale beneath the map.
Warmth returned on the 21st with Piney Hollow (Gloucester) at 89°, Sicklerville 88°, and 19 sites at 87°. Highs only reached 57° at five Atlantic coastal stations. The last 80° day was the 22nd, with six stations at that mark.
There were 11 April days where one or more NJWxNet station dropped to a low of 32° or lower. Walpack and Pequest each had freezes on nine days. Meanwhile, nine NJWxNet stations did not experience an April freeze (Atlantic City Marina, Fortescue, Harvey Cedars, Little Egg Harbor Township, Logan [Gloucester], Lower Alloways Creek Township, Pennsauken, Point Pleasant, and West Cape May [Cape May]). Six of these stations saw what will likely be their last freeze of the season on March 20th, two on March 21st, and one on March 30th.
Of the freezing days, five found stations at 25° or colder. Walpack was the first on the 2nd at 24°. The coldest April morning was the 3rd with Walpack at 19°, Pequest (Warren) and Sandyston 23°, and four sites 24°–25° (Figure 11). Atlantic City Marina only fell to 43° that morning. Walpack fell to 23° and three stations to 25° on the 8th. Walpack again led the way on the 9th at 20°, followed by Pequest and Sandyston each 23° and four stations 24° or 25°. The 10th found Berkeley Township in the Pinelands lowest at 21° and Walpack 23°. Other days with minimums from 26°–32° included April 7, 11, 20, 24, 25, and 26.
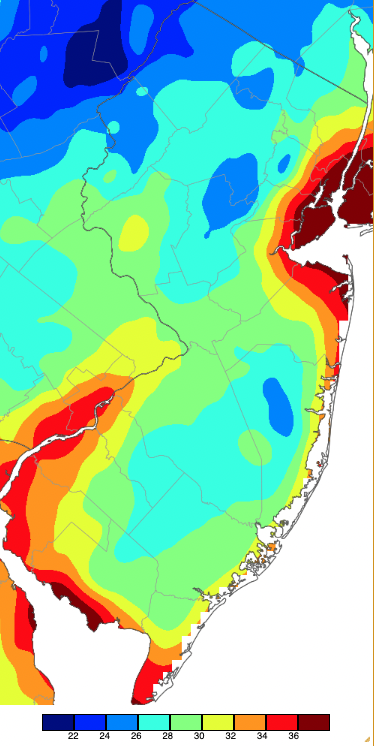
Figure 11. Minimum temperatures on April 3rd based on a PRISM (Oregon State University) analysis generated using NWS, NJWxNet, and other professional weather stations. Note the 2-degree scale beneath the map.
For those seeking more detailed information on 5-minute, hourly, daily, and monthly conditions, please visit the following Office of the NJ State Climatologist's websites:
Rutgers NJ Weather Network
NJ Community Collaborative Rain, Hail and Snow Network
NJ Snow Event Reports
Interested in receiving our monthly summaries at the end of each month? Send us your e-mail address here to join the mailing list.
Past News Stories

