In the End...Rather Normal: April 2024 Recap
New Jersey State Climatologist
Center for Environmental Prediction, School of Environmental and Biological Sciences/NJAES
Rutgers University
May 7, 2024
Overview
You would never have guessed it by looking at most days, with some wet, some dry, some warm, some cold, but put it all together and a rather normal April temperature- and precipitation-wise emerged from quite a variety of days and weeks. This is often the case during a transitional month (mid-fall or mid-spring), but this month took it to a bit of an extreme. Toss in a partial solar eclipse and an earthquake and it was quite the month for all who enjoy observing our fascinating world and solar system.
April precipitation averaged 4.14” across New Jersey. This is 0.44” above the 1991–2020 normal and ranks as the 42nd wettest of records dating back to 1895. Generally, the north received more rain than the south (Figure 1). The north climate division averaged 4.59” (+0.69”, 40th wettest), south division 3.89” (+0.31”, 48th wettest), and coastal division 3.65” (+0.10”, 61st wettest).
The year-to-date precipitation (rain and melted frozen precipitation) is 19.86”. This is 5.61” above normal and ranks as the 5th wettest January–April period on record. The top total is 22.98” in 1983 and the second through four wettest occurred in 1979, 1958, and 1953. The past 12 months have seen a state average 56.98” of precipitation, which is the 6th wettest of all such May–April periods dating back to 1895.
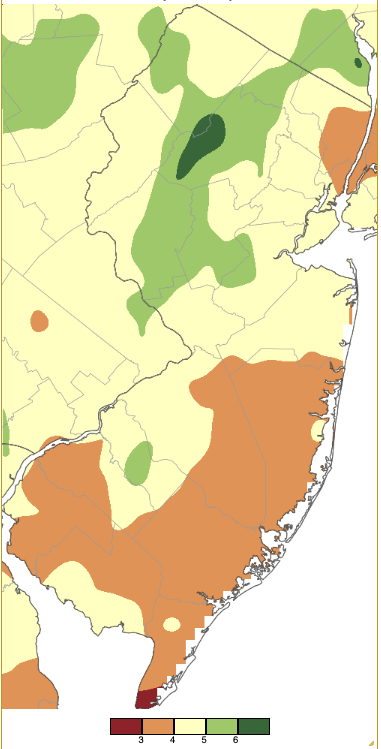
Figure 1. April 2024 precipitation across New Jersey based on a PRISM (Oregon State University) analysis generated using NWS Cooperative, CoCoRaHS, NJWxNet, and other professional weather station observations from 8 AM on March 31st to 8 AM on April 30th. Note the scale in inches at the bottom of the map. Totals range from 2.00”–3.00” (dark red) to 6.00”–7.00” (dark green).
Most locations did not receive snowfall during the month, though enough fell in northern locations to bring the state average to 0.1”, which is 0.4” below normal and tied with 9 other Aprils as the 49th snowiest. The northern snow division averaged 0.2” (-0.6”, 49th snowiest, tied with 5 other years), the central division 0.0” (-0.6”), and southern division 0.0” (-0.4”). A seasonal snow report will be issued later in May.
The statewide April average temperature of 52.8° is 1.3° above normal and ranks as the 17th warmest April of the past 130. However, it is only the 9th warmest of this century. The average high of 63.6° is 0.9° above normal and ranks 29th mildest. The average low of 41.9° is 1.6° above normal and ranks 9th mildest. The north averaged 50.9° (+1.0°, 23rd mildest), south 54.0° (+1.4°, 16th mildest), and coast 53.0° (+1.3°, 14th mildest).
The past 12 months have averaged 54.8°. This is 1.2° above the 1991–2020 mean and 2.9° above the 1895–present mean. This ranks as the 8th warmest of a May–April period (the warmest occurring in 2011/2012), with all of the top 15 warmest occurring from 2000 through present.
Precipitation and Storms
Wet March conditions continued into the first half of April. The second half saw only minor systems, none of which generated more than 0.66” at any location. The wettest Community Collaborative Rain, Hail, and Snow Network (CoCoRaHS) or Rutgers NJ Weather Network (NJWxNet) stations over the course of the month was Mt. Arlington (Morris County) with 6.95”. This was followed by Jefferson Township (Morris) at 6.94” and 6.00” (two stations), Readington Township (Hunterdon) 6.44”, Clinton (Hunterdon) 6.28”, Califon (Hunterdon) 6.23”, and Mine Hill (Morris) 6.06”. The far south saw West Cape May (Cape May) with just 2.18”. Oakland (Bergen) was next at 3.00”, Lower Township (Cape May) and Kearny (Hudson) each had 3.02”, Brick Township (Ocean) 3.04”, River Edge (Bergen) 3.05”, and Mullica (Atlantic) 3.11”. Top snowfall totals at CoCoRaHS stations included Vernon Township (Sussex) 2.3”, Sparta (Sussex) 1.8”, Hardyston (Sussex) 1.1”, and Jefferson Township 1.0”.
Rain did not wait long to invade NJ as April began. On the 1st, the south received the most (Figure 2). Two Middle Township (Cape May) stations received 1.80” and 1.76”. Fifteen other stations out of 250 reports caught 1.00”–1.57”, and 68 from 0.50”–0.68”.
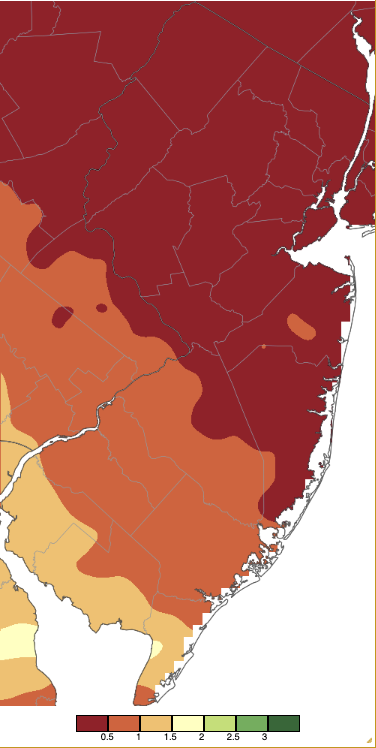
Figure 2. Precipitation across New Jersey from 8 AM on March 31st through 8 AM April 2nd based on a PRISM (Oregon State University) analysis generated using NWS Cooperative, CoCoRaHS, NJWxNet, and other professional weather station observations. Note the scale in inches beneath the map.
The major storm of the month arrived the morning of the 2nd and lasted into the pre-dawn hours of the 4th. A potpourri of conditions included heavy rain, minor stream and river flooding, snow, wind, thunderstorms, hail, and coastal flooding. Precipitation (rain and melted snow) was heaviest in the north, with all but southern Cape May County receiving more than an inch (Figure 3). Westfield (Union) topped the list with 3.58”, Harrison (Hudson) 3.57”, and North Arlington (Bergen) and Roxbury Township (Morris) each had 3.50”. Fifty-six of the 257 CoCoRaHS reports were from 3.00”–3.49”, 142 from 2.00”–2.99”, and 52 from 1.00”–1.99”. Middle Township received 0.80” for the least in NJ. Thunderstorms occurred during the afternoon of the 3rd, with rice-size hail reported in Gloucester and Monmouth counties. Snow fell in the northwest at the tail end of event, totaling as much as 2.3” in Highland Lakes (Sussex), High Point Ranger Station (Sussex) 2.0”, Sparta 1.8”, Hardyston Township 1.1”, and both Jefferson Township and Wantage (Sussex) 1.0”. Wind gusts at 13 NJWxNet stations topped 40 mph on the 3rd, the highest gust of 54 mph at High Point Monument (Sussex) and 12 sites from 40–49 mph. The 4th saw gusts of 42 mph at both Fortescue (Cumberland) and Sea Girt (Monmouth) and 41 mph in Little Egg Harbor Township (Ocean) and Lyndhurst (Bergen). Minor to borderline moderate coastal flooding occurred at the time of several high tides.
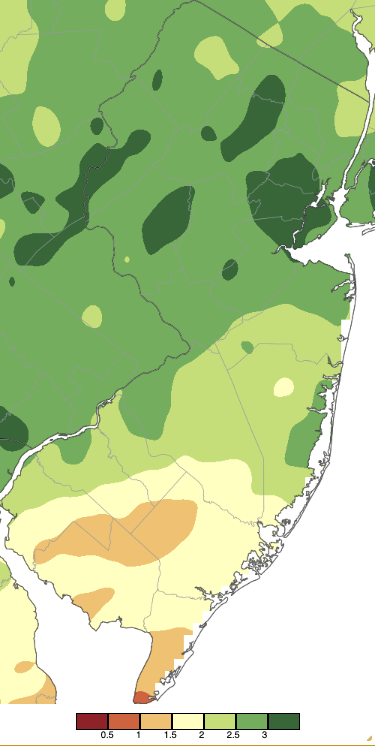
Figure 3. Precipitation across New Jersey from 8 AM on April 2nd through 8 AM April 4th based on a PRISM (Oregon State University) analysis generated using NWS Cooperative, CoCoRaHS, NJWxNet, and other professional weather station observations. Note the scale in inches beneath the map is the same as Figure 2.
Rain returned on the 11th in the form of scattered showers that became steadier into the morning of the 12th before tapering off in the afternoon. The Highlands received the most with Mt. Arlington on top at 2.91”, two Jefferson Township stations with 2.84” and 2.51”, ten locations at 2.00”–2.48”, and 91 from 1.00”–1.99” (Figure 4). Greenwich (Cumberland) at 0.19” received the least. Winds gusted to 47 mph at Berkeley Township (Ocean) and Lower Alloways Creek Township (Salem) on the 12th, with 11 other sites gusting from 40–44 mph. As the storm departed, the 13th saw gusts of 51 mph at Atlantic City Marina (Atlantic), 49 mph in Lower Alloways Creek Township, and 40–46 mph at 11 other sites. Leftover gusts on the 14th amounted to 48 mph in Lyndhurst and 41–45 mph at six sites.
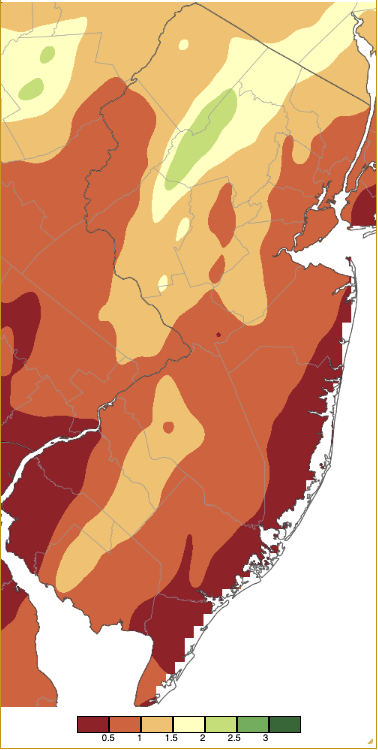
Figure 4. Precipitation across New Jersey from 8 AM on April 11th through 8 AM April 13th based on a PRISM (Oregon State University) analysis generated using NWS Cooperative, CoCoRaHS, NJWxNet, and other professional weather station observations.
Many a dry day followed in the second half of the month though the 15th saw thunderstorms in the south bring as much as 0.42” and 0.30” to Woodbine (Cape May) stations. The 17th again saw rain in the southeast, with Woodbine catching 0.64”, and 0.62”, Wildwood Crest (Cape May) 0.63”, and 0.62” at Ventnor (Atlantic) and Ocean City (Cape May). The afternoon of the 27th into early the 28th brought Ventnor 0.66”, and three Hamilton Township (Atlantic) stations 0.65”, 0.57”, and 0.43”.
Rain late on the 28th into the 29th delivered central and northern areas as much as 0.56” in Mine Hill, and 0.39” at Mt. Arlington, Andover Township (Sussex), and Stillwater Township (Sussex). Finally, the evening of the 30th saw showers and thundershowers mainly in the northwest, with Mine Hill seeing 0.64”, Hackettstown (Warren) 0.60”, Holland Township (Hunterdon) 0.56”, and Belvidere (Warren) 0.52”.
The early-month wetness and occasional showers later in the month kept the fire danger on the low to moderate side. Apparently, sparks from a passing train produced a trail of small fires in the Pinelands area on the 15th. A wildfire of approximately 510 acres scorched a portion of Wharton State Forest (Camden/Burlington) on the 24th–25th.
The lowest barometric pressures during April occurred on the 4th, at 29.20”–29.30”. The 27th had the highest pressures at 30.50”–30.55”. In addition to the five aforementioned days with wind gusts exceeding 40 mph, the 6th had a gust to 41 mph at Vernon Township and a 40-mph gust at the same location occurred on the 20th.
Temperature
Thirteen April days saw maximum temperatures at one or more NJWxNet of 70° or higher while 14 days had an NJWxNet station with a 32° or lower minimum. The first two of the nine days with sub-30° lows were the 4th and 5th with High Point Monument at 29° each day. The coldest morning of the month was the 8th with Walpack (Sussex) down to 24°, Berkeley Township at 25°, and 32 stations from 27°–32° (Figure 5). Coastal and urban areas were mildest with Atlantic City Marina at 43°. Down to 32° on the 9th, Walpack warmed to a high of 79° with a 47° diurnal range, leading an array of inland stations with large ranges on this day.
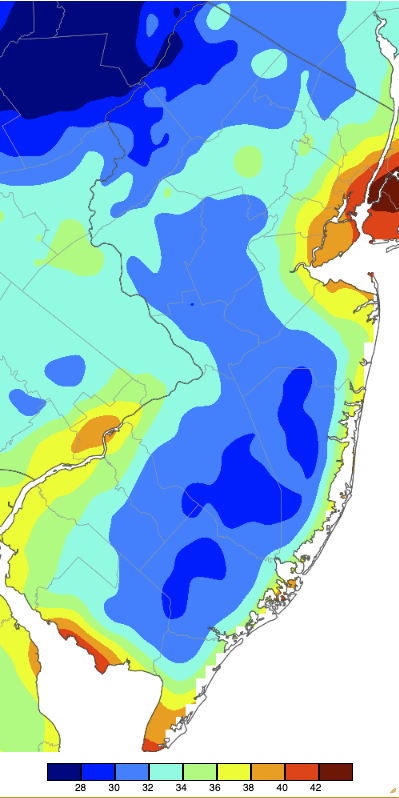
Figure 5. Minimum temperatures on April 8th based on a PRISM (Oregon State University) analysis generated using NWS, NJWxNet, and other professional weather stations. Note the 2-degree scale beneath the map.
An impressive period of late-season sub-30° lows began on the 21st, with Walpack at 26° and 12 sites from 28°–31°. While the 8th was overall a bit colder than the 22nd, the late-season nature of the lows on the 22nd warrant notice (Figure 6). Walpack again reached the monthly low of 24° and 27 stations ranged from 26°–32°. The 32° low at the long-term National Weather Service Cooperative station in New Brunswick (Middlesex) was the latest spring freeze since 2015 and the 4th latest this century. However, it was just three days later than the average last freeze based on records from 1896–present and the 43rd latest of the past 129 years, providing more evidence of the overall warming in recent decades.
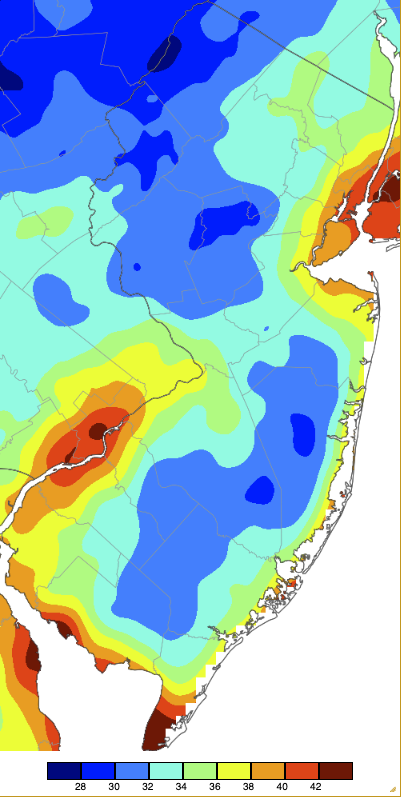
Figure 6. Minimum temperatures on April 22nd based on a PRISM (Oregon State University) analysis generated using NWS, NJWxNet, and other professional weather stations.
Before the end-of-month heat arrived, the 23rd saw a low of 25° at Walpack and 16 stations at 26°–32°, though Atlantic City Marina fell to just 51°. High Point Monument dropped to 29° on the 25th with five stations from 30°–32°. Berkeley Township fell to 26° on the 26th accompanied by 31 stations from 27°–32°. This Pinelands cold spot again reached 26° on the 27th, when 16 stations were 29°–32°, while Fortescue only dropped to 48°.
Of the warmer days, nine equaled or exceeded 75° beginning on the 9th with Piney Hollow (Gloucester) up to 82° and 48 of the 68 NJWxNet stations from 75°–81°. Piney Hollow, Hammonton (Atlantic), and Sicklerville (Camden) hit 78° on the 10th, with 15 stations from 75°–77°. At the coast, Sea Girt only got up to 55°. West Deptford (Gloucester) was 75° on the 14th, with the first widespread 80°s arriving on the 15th. This day saw Fort Dix (Burlington), Oswego Lake (Burlington) and Sicklerville rise to 86° and 40 stations from 80°–85°. Twenty-one reached 75°–79°, with High Point Monument and Vernon Township coolest at 72°. Lower Alloways Creek Township reached 76° on the 16th with four stations at 75°.
Returning to the 15th, a situation arose that is quite common throughout the warmer part of the year and can be particularly pronounced on spring days. This is a coastal sea breeze, where the daytime land heating results in rising air. This air is replaced by cooler more dense air chilled by the still quite cool offshore water. The establishment of this onshore flow can result in quite rapid declines in temperature at coastal locations. Along the Jersey coast, the cooling most often is confined to lands east of the Garden State Parkway unless assisted by a more general easterly flow. Such was the case on the 15th where in the top graph of Figure 7, a continual rise of temperature at Oswego Lake, 18 miles inland, continues until the temperature reaches the mid 80°s late in the afternoon. Meanwhile, at Harvey Cedars (Ocean) on Long Beach Island the morning temperature rise kept pace with that at Oswego Lake until 11:20 AM when the sea breeze commenced. With 35 minutes the temperature fell from 75° to 60° where it remained until late afternoon when it dropped several more degrees.
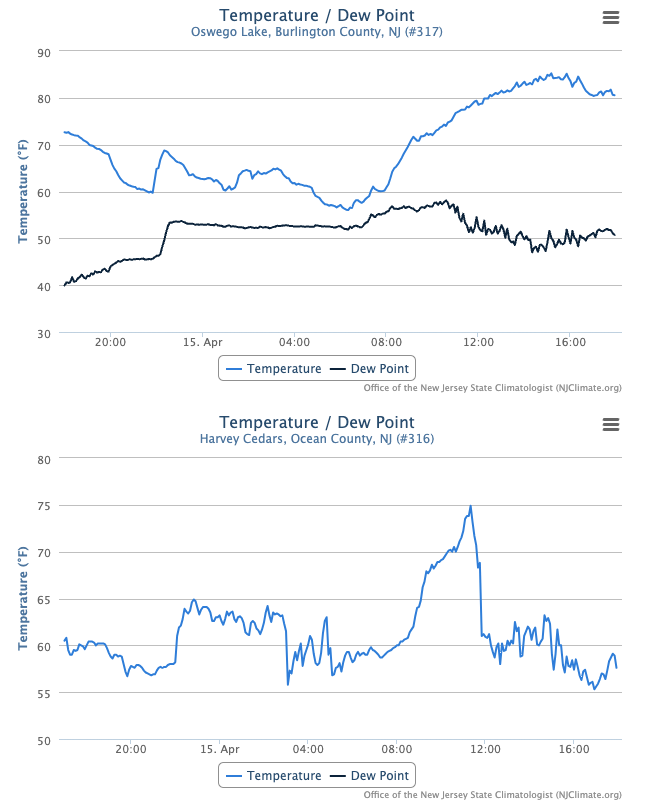
Figure 7. Top: time series of air temperature and dew point at the Oswego Lake NJWxNet station from approximately 6 PM April 14th to 6 PM April 15th. Bottom: air temperature at the Harvey Cedars NJWxNet station during the same time period.
April ended on a warm note, with highs of 83° at Hammonton and Piney Hollow on the 28th and 75°–82° maximums at 53 stations. The 29th was the first hot day of the year, with 91° highs at Hopewell Township (Mercer), Lower Alloways Creek Township, Red Lion (Burlington), and Vineland (Cumberland), 90° at eight stations, and 80°–89° at 47 others (Figure 8). A sea breeze kept the high temperature at both Sea Girt and Seaside Heights (Ocean) to 56°.
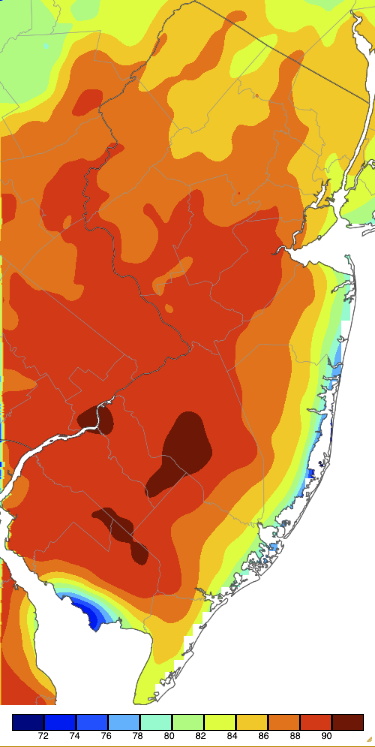
Figure 8. Maximum temperatures on April 29th based on a PRISM (Oregon State University) analysis generated using NWS, NJWxNet, and other professional weather stations.
Sicklerville made it to 88° on the 30th, with 22 sites from 80°–87°. Meanwhile, highs along the north and central coast only made it into the mid to up 50°s, and in the north, to the 60°s and lower 70°s. This was the result of a backdoor cold front that moved into the northern half of the state from New England during the morning. Like a sea breeze, this atmospheric situation tends to be most pronounced in the spring. The series of NJWxNet maps in Figure 9 show conditions at 10:52 EDT. The northern chill (top map) was accompanied by limited incoming solar radiation (second map) due to cloud cover (third map). Meanwhile, the southern half of NJ was clear and warm. Atmospheric moisture was quite similar statewide as noted by the dew point temperatures in the 50°s (fourth map). Given the large temperature differences between north and south this resulted in relative humidity values in the 80–100% range in the north and much lower 40–60% range in the south (fifth map).

Figure 9. NJWxNet maps showing conditions across NJ and surroundings at 1052AM on April 30th as a backdoor cold front is draped across central NJ. Top: Air temperature. Second: incoming solar radiation. Third: visible satellite image. Fourth: dew point temperature. Bottom: relative humidity.
Finally, it is worth a look back at atmospheric conditions during the afternoon of the 8th when a solar eclipse approached about 90% totality across the Garden State. Unfortunately, partly cloudy skies interfered with ideal eclipse watching but most people caught a careful glance at the diminished sun and there was a notable darkening of the sky. Just how much solar radiation was lost as totality occurred around 3:20 PM is seen in a graph of incoming radiation at the Hillsborough-Duke (Somerset) NJWxNet station (Figure 10, top). Mid-day values (solar noon is close to 1PM EDT) were close to 900 W/m2 except when clouds appeared to alter conditions. As the sunlight was blocked by the moon, values bottomed out at about 100 W/m2. Thereafter, they began to rise but more clouds rolled in to keep late-afternoon values rather low.
The impact of the reduced sunlight on temperatures measured about 6 feet off the ground is seen in Figure 10 (bottom). There was a several degrees decline in temperatures near the eclipse maximum. The temperature rebounded following the eclipse with the slightly increased solar radiation.
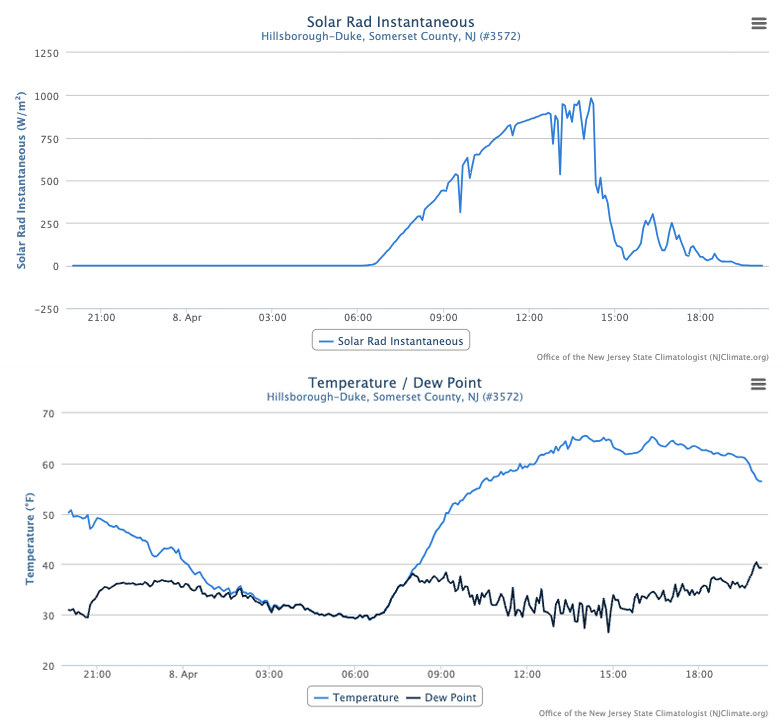
Figure 10. Top: time series of incoming solar radiation at the Hillsborough-Duke NJWxNet station from approximately 8 PM April 7th to 8 PM April 8th showing the decline in radiation resulting from the approximate 90% eclipse shortly after 3 PM (15:00) on the 8th. Clouds also contributed to some of the decline at eclipse maximum and afterward. Bottom: Air temperature at Hillsborough-Duke for the same time period, showing the several degree cooling accompanying the eclipse maximum.
For those seeking more detailed information on 5-minute, hourly, daily, and monthly conditions, please visit the following Office of the NJ State Climatologist's websites:
Rutgers NJ Weather Network
NJ Community Collaborative Rain, Hail and Snow Network
NJ Snow Event Reports
Interested in receiving our monthly summaries at the end of each month? Send us your e-mail address here to join the mailing list.
Past News Stories

