A Little Bit of This and a Little Bit of That: February and Winter 2019 Recaps
New Jersey State Climatologist
Center for Environmental Prediction, School of Environmental and Biological Sciences/NJAES, Rutgers University
March 5, 2019
Overview
The second month of 2019 across New Jersey was not one that will leave an indelible mark in the memory bank. Unlike some of the wild conditions that afflicted many other parts of the nation, NJ precipitation events were only minor to moderate, and there was nothing in the way of stream and river flooding. On several occasions, cold and warmth came and went rather quickly. There were no coastal storms, thus no significant tidal flooding or beach erosion. While there was one notable wind event, overall, rather calm conditions prevailed.
The statewide average precipitation (rain and melted snow) was 3.27”. This is 0.47” above the 1981–2010 average and ranks as the 47th wettest February since 1895. The statewide average temperature of 34.8° was 1.3° above average, and ranks as the 26th mildest February of the past 125 years.
Snowfall averaged 5.3” across NJ. This is 2.7” below the long-term average and ranks as the 60th least snowy February since 1895. The south region, with 6.6” (+0.1”) was snowiest, ranking 41st most snowy. The central zone caught 4.2” (-4.7”), ranking 42nd least snowy, while the north saw only 3.9” (-6.2”), ranking 32nd least snowy. The statewide seasonal total of 14.2” through February was 6.8” below average.
Precipitation and Storms
There were three events in February that deposited more than an inch of rain or rain and melted snow/sleet somewhere in the state. Two of these episodes, along with two other minor storms, brought 2.0” of snow to some locations. Coastal areas picked up the most precipitation, led by Red Bank (Monmouth County) with 4.55”, Linwood (Atlantic) 4.40”, Port Republic (Atlantic) 4.35”, Middle Township (Cape May) 4.34”, Lacey Township (Ocean) 4.24”, and Lower Township (Cape May) 4.20”. West central NJ was driest, with Burlington (Burlington) and Flemington (Hunterdon) both only accumulating 2.75”, Lebanon (Hunterdon) 2.77”, Hopewell Township (Mercer) 2.83”, and Greenwich Township (Warren) 2.85”. This is actually one of the smallest ranges between wettest and driest locations in most any month in recent years.
The top snowfall totals in February were found in the mid-south to southwest. Hammonton (Atlantic) caught 9.0”, Franklin Township (Gloucester) 8.5”, South Harrison (Gloucester) 8.4”, Egg Harbor City (Atlantic) 8.0”, and Pennsville (Salem) 7.4”.
February kicked off with light snow across the southern half of the state. In Cape May County, Middle Township, Wildwood Crest, Cape May, and two Lower Township observing stations all picked up 3.0”. An inch fell up to northern Burlington and Ocean counties, with a trace to no snow further north. Only about 0.10”–0.20” of liquid was contained in the cold, dry snowfall. Following a quick warm up, rain fell on the evening of the 6th until early on the 7th. Peapack-Gladstone (Somerset) saw 0.78”, Harrison (Hudson) 0.64”, and 0.63” fell in both Chatham (Morris) and Florham Park (Morris). This same zone in the lower portion of north Jersey saw the most rain in another event during the morning hours of the 8th. Kearny (Hudson) led the way with 0.66”, followed by Peapack-Gladstone 0.56”, and Harrison, Flemington, and Woodbridge (Middlesex) each with 0.52”.
The evening of the 10th into the morning of the 11th saw yet another in a rather common winter 2018/2019 pattern of south Jersey being clipped by snow events tracking south of the state, while areas to the north were shut out of the white stuff. As Figure 1 shows, as with the February 1 event, only the southern half caught more than an inch. Most of Cape May County remained below an inch too. Six counties had at least one station receiving at least 3.0”. Egg Harbor City, with 5.1”, was tops in Atlantic County, Evesham (Burlington) 3.1”, Winslow (Camden) 3.9”, Upper Deerfield (Cumberland) 4.0”, Franklin Township (Gloucester) 4.0”, and Little Egg Harbor and Waretown, each in Ocean County, had 3.0”. This was a wetter event than on the 1st, with Galloway Township (Atlantic) at 0.58”, Wildwood Crest seeing 0.55” and 0.51” (two locations), and 0.51” at two Lower Township stations.
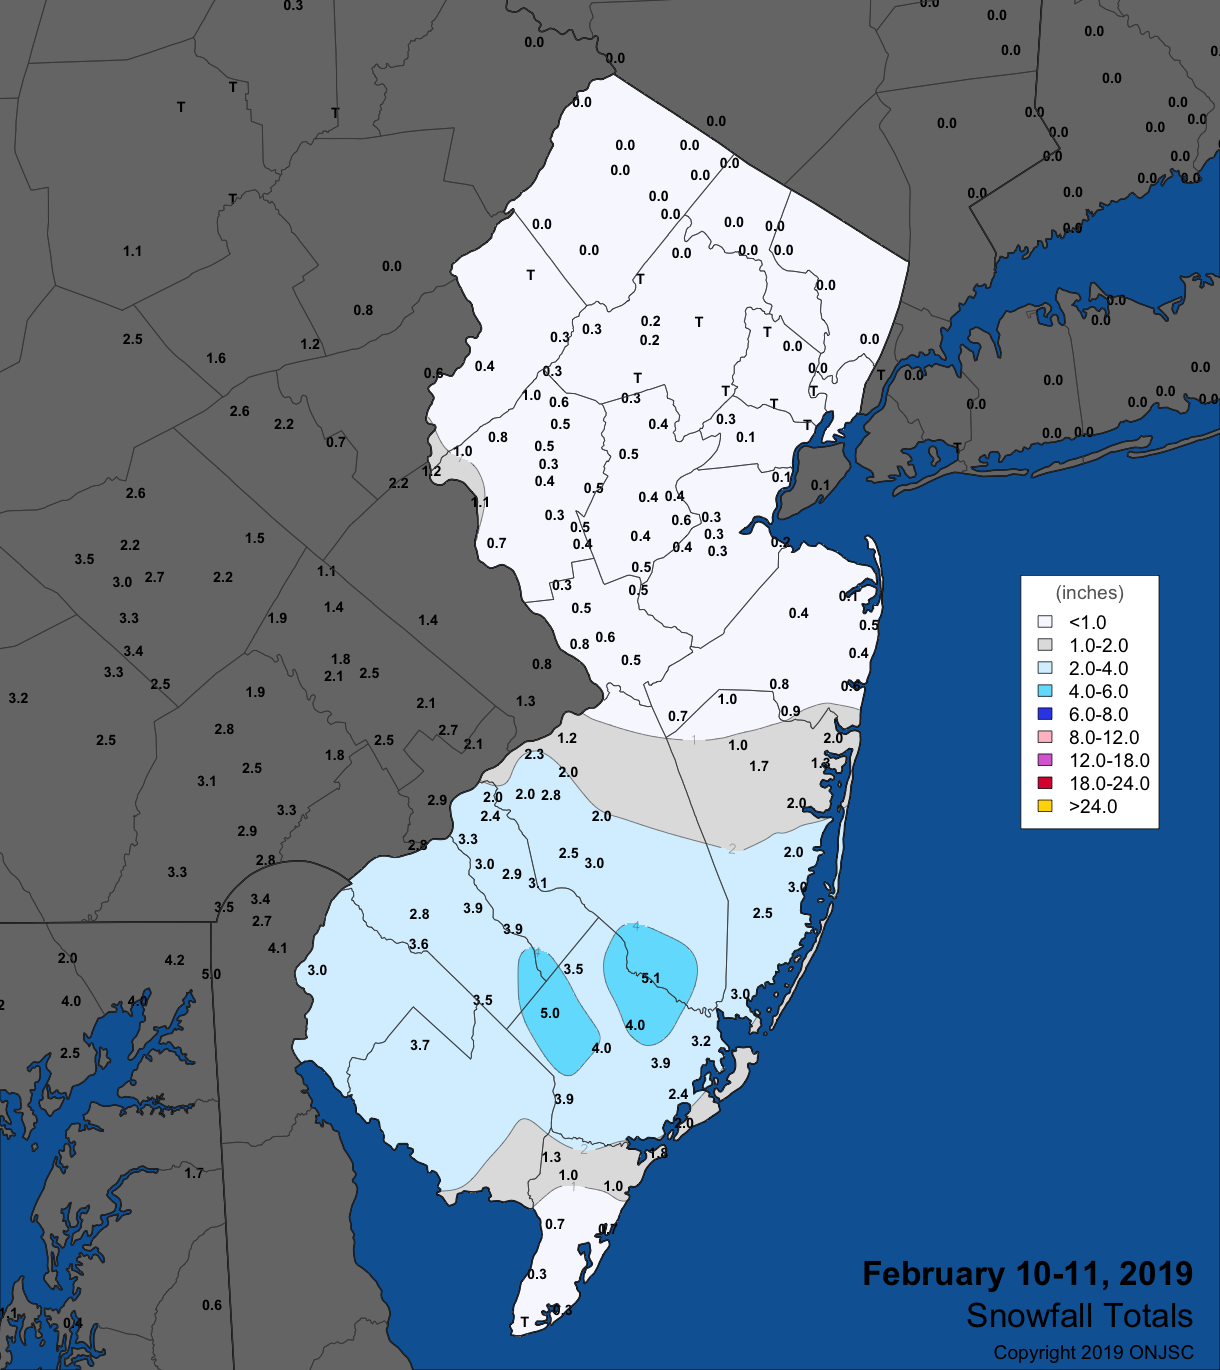
Figure 1. Snowfall from late on the February 10th to the morning of the 11th. Observations are from CoCoRaHS stations, NWS Coop, and NWS spotter reports.
The rainiest event of February, which included some snow in the north, entered the state close to sunrise on the 12th, departing in the pre-dawn hours of the 13th. Figure 2 shows a widespread distribution of inch-plus rain and melted snow (some rain in the southern quarter of NJ that fell before 7AM on the 12th is not included in the figure). Of 195 CoCoRaHS reports, 81 were from 1.00”–1.56”. Absecon (Atlantic) had the top amount, followed by Lacey Township and Toms River (Ocean), each with 1.54”, and Woodbine (Cape May) and Stafford Township (Ocean), each with 1.51”. The least amount observed was 0.62” in Flemington and Bernards Township (Somerset).
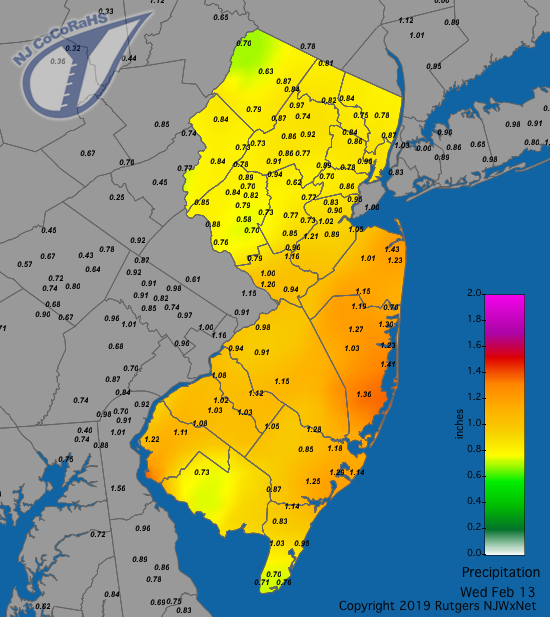
Figure 2. Rainfall from approximately 7 AM on the 12th to 7 AM on the 13th. Observations are from CoCoRaHS stations.
Snow-wise, the distribution from the 12th–13th event was the opposite of the February 10th (Figure 3). Next to no snow fell in the south, while the north saw 1.0”–2.0”, except over 2.0” in the northwest. In Sussex County, Andover caught 4.0” and 3.0” fell in Branchville, Hardyston, and Wantage.
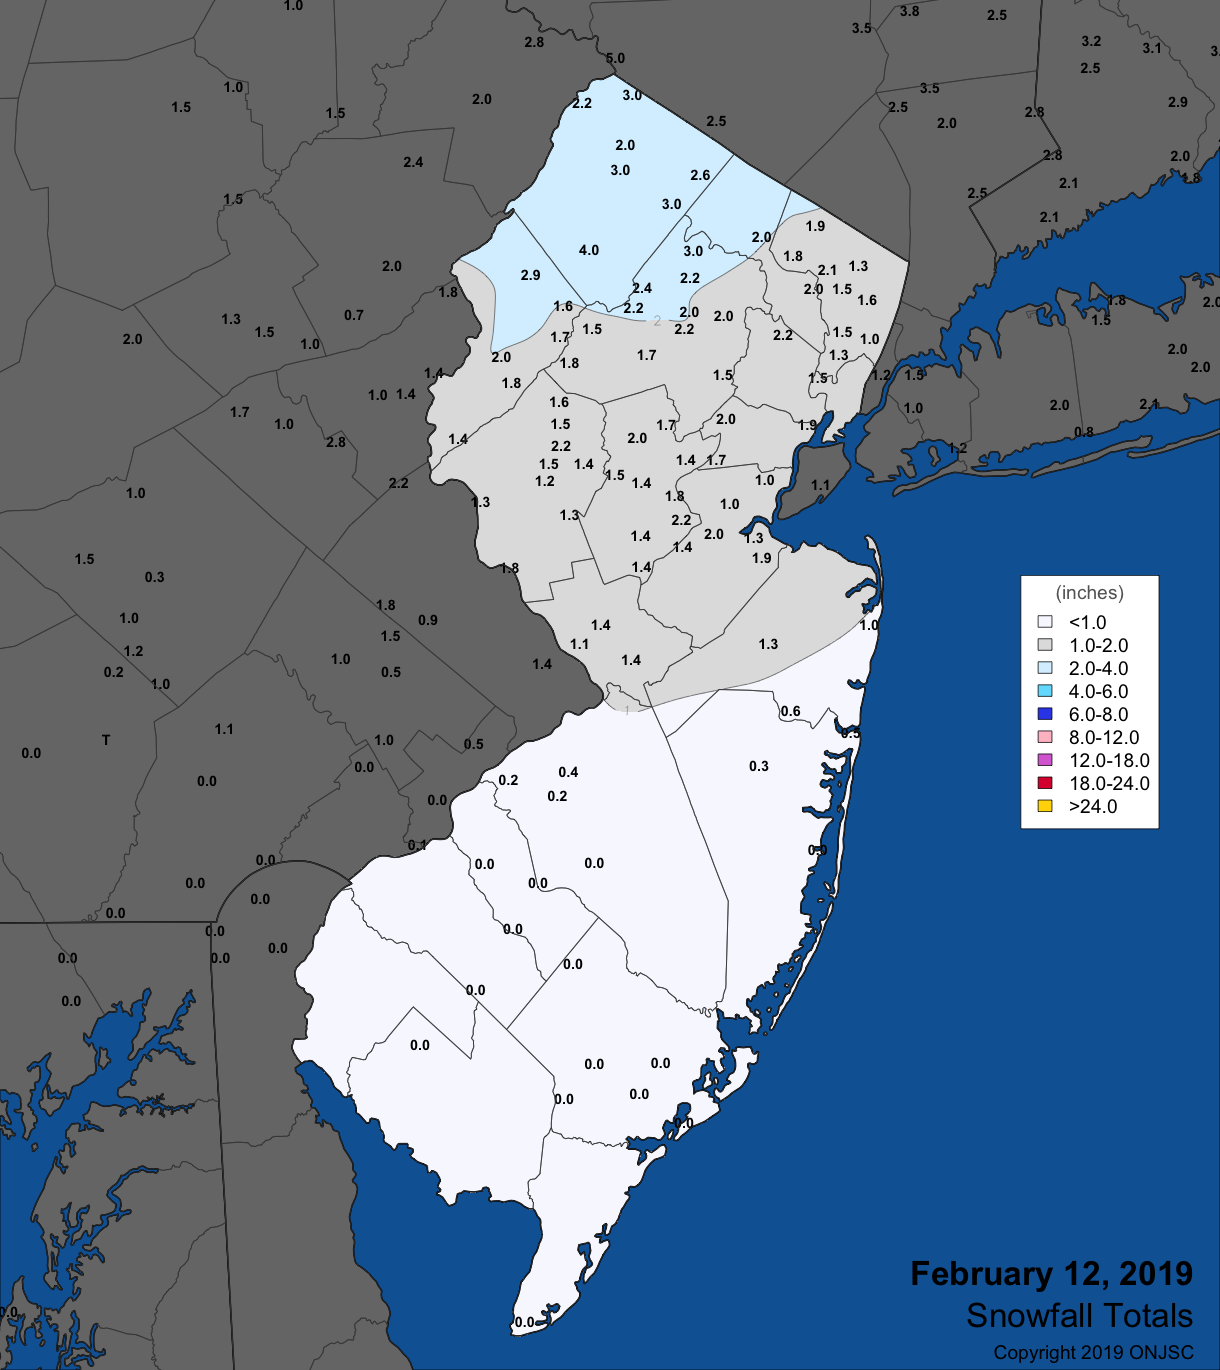
Figure 3. Snowfall mainly during the daylight hours of February 12th. Observations are from CoCoRaHS stations, NWS Coop, and NWS spotter reports.
Rain began in the south during the evening of the 17th, with light freezing rain and sleet to the north. The event ended by dawn on the 18th, with no more than 0.2” of sleet recorded at a few stations. Heaviest totals were confined to Cape May County, with four Middle Township stations picking up 0.81”, 0.75”, 0.74”, and 0.71”, Sea Isle City 0.75”, and Dennis Township 0.73”. Just to the north, Linwood reported 0.76”.
The epitome of a mixed precipitation event visited NJ on the 20th. Snow spread northward during the morning, peaked during the afternoon, and then transitioned to sleet, freezing rain, and plain rain, depending on location, before ending before dawn on the 21st. A rather remarkably uniform distribution of rain and melted frozen precipitation, as well as snowfall, was found across New Jersey. Of the 216 CoCoRaHS reports, 197 came in between 0.50” and 1.04”. Higher amounts included Madison (Morris) at 1.37”, Cranford (Union) 1.33”, Red Bank 1.11”, and Verona (Essex) 1.08”. Two Lower Township observations of 0.30” were the lowest in the state. Each of the 21 counties had some stations receive 1.5”–2.5” of snow (Figure 4). Only several Cape May locations caught less than 1.0”. Top county totals of at least 3.0” included South Harrison (Gloucester) 3.3” and 3.0” in Hammonton (Atlantic), Cherry Hill (Camden), Lawrence Township (Mercer), Brick Township (Ocean), Pittsgrove (Salem), and Andover (Sussex).
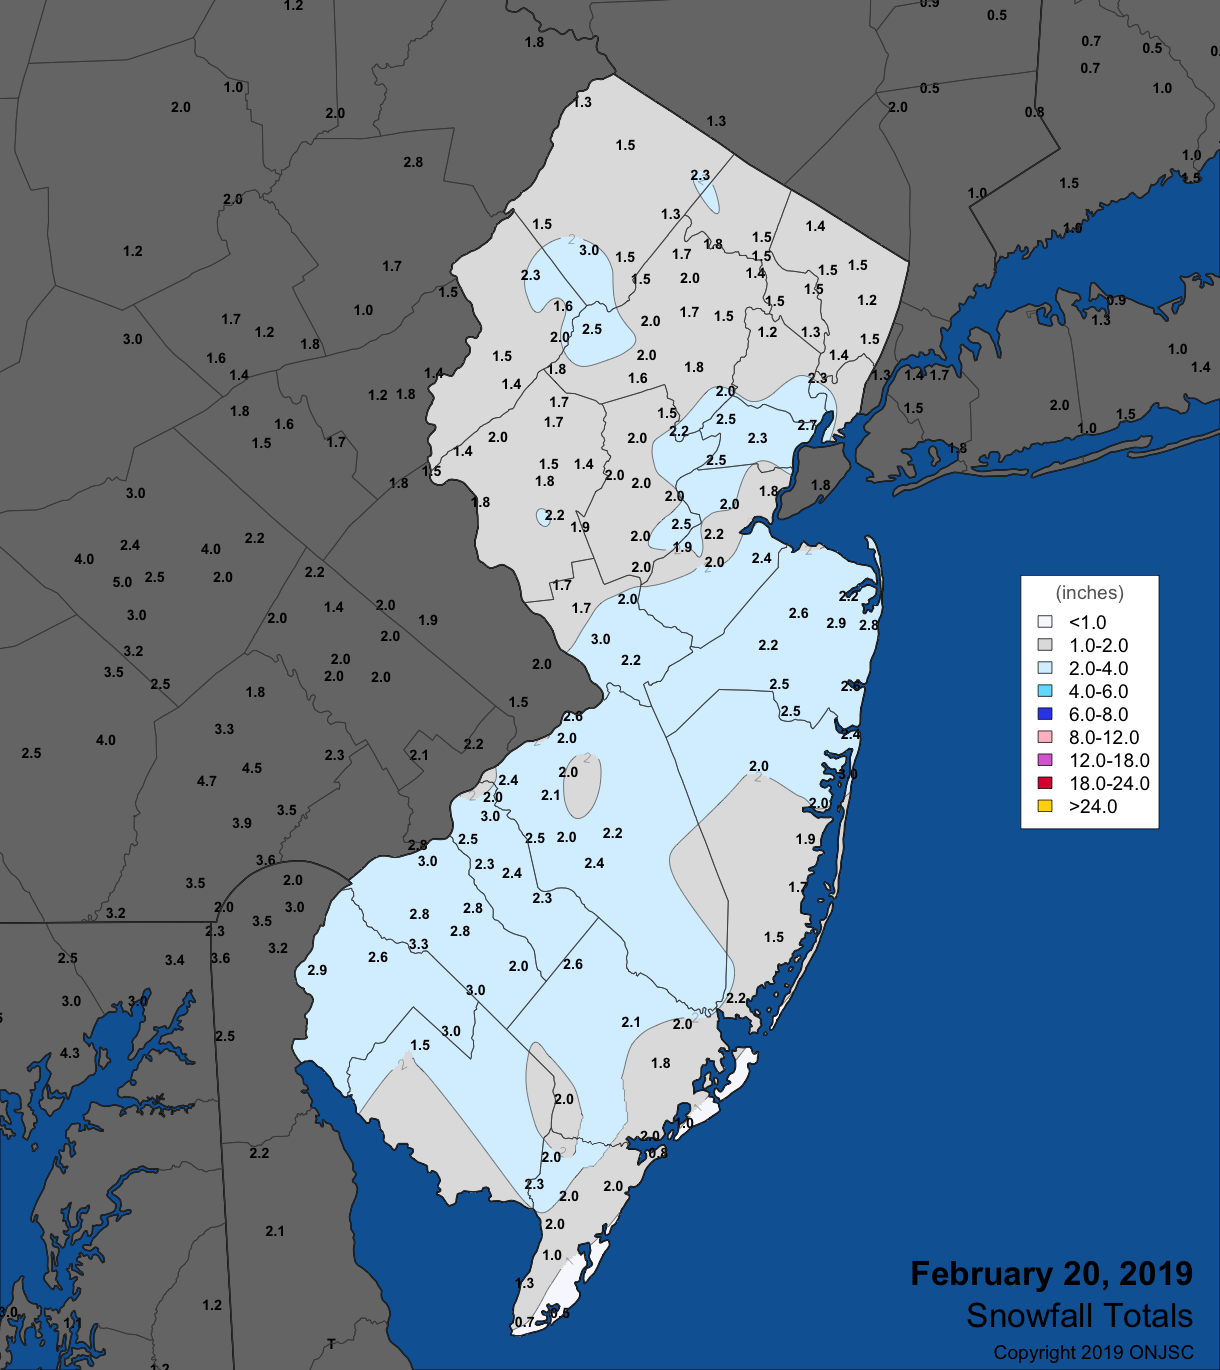
Figure 4. Snowfall from the morning into the evening of February 20th. Observations are from CoCoRaHS stations, NWS Coop, and NWS spotter reports.
The last precipitation event of the month was associated with a major storm that moved out of the southwestern US into the western Great Lakes and then further deepening as it tracked through eastern Canada. Only being on the periphery of the storm led to moderate rain invading NJ on the evening of the 23rd and lasting until mid morning of the 24th. Some of this was freezing rain in the northwestern hills. Otherwise, the coast saw the most rain, with Lower Township stations measuring 1.23”, 1.19”, and 1.09”, Middle Township 1.08”, two Wildwood Crest sites at 1.05” and 0.99”, and Red Bank 1.05”.
As the storm deepened, winds picked up throughout the eastern US and the barometer bottomed out at a monthly low of 29.30”–29.40” across NJ. The strongest gusts began late on the 24th and lasted until the evening of the 25th. The 24th saw gusts to 55 mph at Charlotteburg (Passaic) and Harvey Cedars (Ocean), 54 mph in Stewartsville (Warren), Lower Alloways Creek Township (Salem) 53 mph, and Fortescue (Cumberland) and Cream Ridge (Monmouth) each 51 mph. 23 other NJWxNet stations gusted from 40 mph–49 mph. The 25th saw the windiest conditions since March 2, 2018, and perhaps since Sandy in October 2012. Seaside Heights (Ocean) gusted to 61 mph, Pittstown (Hunterdon), Fortescue, and Lower Alloways Creek Township each to 57 mph, and Stewartsville and Moorestown (Burlington) each to 57 mph (Figure 5). Eight other NJWxNet stations reached 50 mph–54 mph, 14 from 45 mph–49 mph, and 14 from 40 mph–44 mph. Numerous trees fell, including some onto buildings, vehicles, and power lines. Outages were scattered, but fortunately not widespread, and there were no reports of serious injuries.
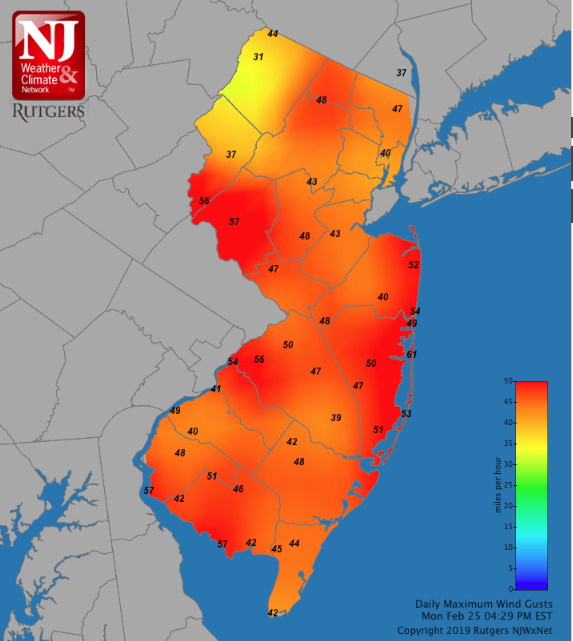
Figure 5. Maximum wind gusts on February 25th. Observations are from NJWxNet stations.
It should be noted that the anemometer at High Point Monument (Sussex) was damaged during the month, and was unable to be repaired prior to this event. Thus it will never be known how strong the winds were at this often windiest NJ location. However, the 45 mph peak gust at the quite sheltered High Point station, about 300 feet below the Monument station, suggests impressive gusts at New Jersey’s highest location.
Four other February days saw one or more NJWxNet station gust to 40 mph. On the 8th, Lower Alloways Creek Township reached 48 mph, Pennsauken (Camden) and Seaside Heights each 47 mph, and eight stations to 40 mph–44 mph. Pennsauken reached 40 mph on the 9th. Not surprisingly, this wind was associated with a strong pressure gradient between a departing storm on the 8th and the month’s highest pressure of 30.70”–30.75” on the 9th. The 13th saw Seaside Heights up to 49 mph, Pittstown 42 mph, and Upper Deerfield 41 mph. On the 18th, Pennsauken reached 46 mph, Lower Alloways Creek Township 44 mph, and five stations peaked from 40 mph–43 mph.
Temperature
The thermometer did not sit still as February progressed. Three days saw some locations exceed 60°, while subzero observations marked the first two mornings of the month. The first of seven days with maximum temperatures of 55° or higher occurred on the 4th, when seven NJWxNet stations reached 64°. Thirty-five other stations out of the 63 reporting temperature in February were from 60°–63°. Even High Point Monument (HPM) reached 58°. Meanwhile, southerly winds flowing over cool Delaware Bay waters stalled the high at Fortescue to 43°. The same pattern continued on the 5th, with Oswego Lake at 69°, six stations at 68°, and 49 reached from 60°–67°. Fortescue and Bivalve (Cumberland) only made it to 54°. The 6th brought 56° to Upper Deerfield and 55° to West Deptford (Gloucester). Egg Harbor Township (Atlantic) got to 58° on the 8th, with five stations at 57°.
Warmth returned on the 15th, when Sicklerville (Camden) reached 66°, seven spots hit 65°, and 29 others topped out from 60°–64°. Dennis and West Creek (Ocean) made it to 55° on the 16th. The only mild day later in the month was the 21st with 56° reached at West Creek, Egg Harbor Township, and Atlantic City Marina (Atlantic).
The frigid outbreak beginning in late January spilled over into the first two days of February. The 1st found Sandyston (Sussex) dipping to -16°, Pequest (Warren) -10°, Hackettstown (Warren) -5°, HPM, High Point, and Stewartsville all -2°, and Berkeley Township (Ocean) -1°. Forty-seven other NJWxNet stations were from 0°–10°, with Atlantic City Marina “mildest” at 15°. Sandyston fell to -8° on the 2nd, with Pequest -4°, and Berkeley Township and Oswego Lake -1°. Forty-eight stations were from 1°–10°, with Lyndhurst (Bergen) mildest at 14°. Cold conditions prevailed into the 3rd, with Pequest down to 12° and Sandyston and Oswego Lake at 13°.
Before continuing, it is worth noting that a problem with the stability of the Walpack temperature observations was noticed during this outbreak, thus until the situation can be properly diagnosed, we are omitting mention of observations from this station, and questioning those reported in January.
Ten more days from the 9th onward saw one or more station drop to 15° or lower. All included one or both of the High Point stations. On the 9th, HPM and High Point were 12° and 14°, respectively. Sandyston led the way with 9° on the 10th, with four stations at 10°. The 12th was an exact repeat of the 9th. A four-day run began on the 17th, with both HPM and Sandyston down to 14°. HPM was 15° on the 18th. This far northwest location only reached 30° for a high on the 18th, while in the far south at Woodbine, the low only fell to 31°, with a daytime high of 51°. HPM was 11° on the 19th, High Point 13°, and Sandyston 15°. HPM was 14° on the 20th. Again, HPM reached 14° on the 26th and 28th. Wedged between those lows was one of 12° on the 27th, with High Point at 14°.
Winter Recap
The three 2018/2019 winter months were each above average in terms of precipitation and temperature, but had below-average snowfall. Yet neither December, January, nor February saw a top-ten ranking for any of these variables. Together, these three months averaged 34.7°. This is 1.6° above average and ranks as the 21st mildest winter of the past 125. Precipitation totaled 13.60”, which is 3.55” above average and ranks as the 13th wettest (Table 1). There were no major snowstorms, with the storm track either slipping south of the state or from the central US northeastward into the Great Lakes and eastern Canada. Neither track was favorable for abundant NJ snow. The former was responsible for multiple minor to moderate snows in the south, leaving central and northern areas mainly unscathed. The latter brought rain or a mixed bag of precipitation types, which, on occasion, left northern counties with a light snow cover.
| Rank | Year | Winter Avg. Prcp. |
|---|---|---|
| 1 | 1979 | 19.17" |
| 2 | 1915 | 17.66" |
| 3 | 1902 | 16.97" |
| 4 | 1903 | 16.08" |
| 4 | 1958 | 16.08" |
| 6 | 1949 | 15.81" |
| 7 | 1937 | 15.27" |
| 8 | 2010 | 14.97" |
| 9 | 1978 | 14.85" |
| 10 | 1973 | 13.73" |
| 11 | 1994 | 13.63" |
| 12 | 1975 | 13.61" |
| 13 | 2019 | 13.60" |
| 14 | 1997 | 13.47" |
| 15 | 1984 | 13.43" |
Table 1. The fifteen wettest NJ winter seasons (Dec.–Feb.) since 1895. Includes rainfall and melted snowfall.
For those seeking more detailed information on 5-minute, hourly, daily and monthly conditions, please visit the following Office of the NJ State Climatologist's websites:
Rutgers NJ Weather Network
NJ Community Collaborative Rain, Hail and Snow Network
NJ Snow Event Reports
Interested in receiving our monthly summaries at the end of each month? Send us your e-mail address here to join the mailing list.
Past News Stories

