Summer Arrives: June Recap (with a brief look at the first half of 2020)
New Jersey State Climatologist
Center for Environmental Prediction, School of Environmental and Biological Sciences/NJAES, Rutgers University
July 7, 2020
June Overview
The statewide average precipitation this June was 3.10”. This is 0.91” below the 1981–2010 average and ranks as the 43rd driest of the past 126 Junes. As is typical during the warm season, where the bulk of the rainfall is provided by showers and thunderstorms, totals varied widely from location to location, even at times in close proximity to one another (Figure 1). Monmouth and northern Ocean counties saw the most, totaling over 5.00” in spots, with a secondary maximum in Gloucester County. The Highlands, portions of central NJ, and southern Ocean and Cape May counties saw as little as 1.00–2.00”.
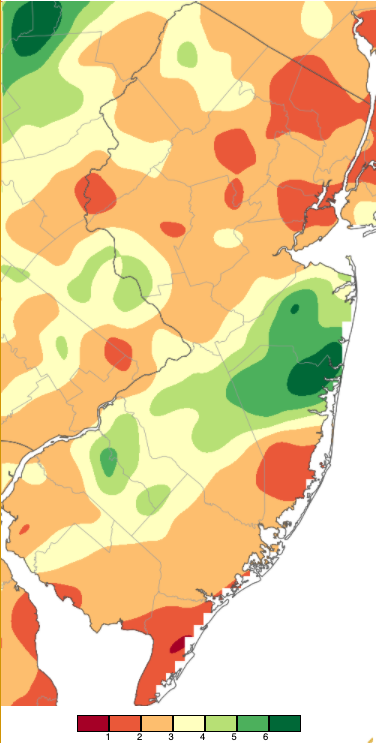
Figure 1. June 2020 precipitation across New Jersey based on a PRISM analysis generated using NWS Cooperative and CoCoRaHS observations (Oregon State University).
The statewide average temperature of 71.6° was 1.8° above the 1981–2010 normal. This ranks as the 10th warmest, joining four other years this century in the top 10, while being the warmest since 2011 (Table 1).
| Rank | Year | June Avg. Temp. |
|---|---|---|
| 1 | 2010 | 73.9° |
| 2 | 1943 | 73.6° |
| 3 | 2008 | 73.0° |
| 3 | 1925 | 73.0° |
| 5 | 1994 | 72.2° |
| 6 | 2005 | 72.1° |
| 7 | 1957 | 72.0° |
| 8 | 2011 | 71.9° |
| 9 | 1934 | 71.8° |
| 10 | 2020 | 71.6° |
| 11 | 1973 | 71.5° |
| 12 | 1976 | 71.4° |
| 13 | 1923 | 71.3° |
| 14 | 2013 | 71.2° |
| 14 | 1989 | 71.2° |
Table 1. The 15 warmest Junes across NJ since 1895.
Precipitation and Storms
There were 13 events during the month where one or more inches of rain fell at a CoCoRaHS or NJWxNet station, yet few had a broad coverage of heavy rain across NJ. Putting some specific numbers on the monthly precipitation distribution mentioned in the previous section, a Lakewood (Ocean County) CoCoRaHS station received 7.77”, the most in the state. Another Lakewood station caught 6.84”. Two stations in Wall Township (Monmouth) received 7.45” and 7.26”, and Sewell (Gloucester) saw 7.44”. Other high achievers were two sites in Manchester Township (Ocean) with 6.86” and 6.46”, two in Washington Township (Gloucester) at 6.68” and 6.56”, and three in Brick Township (Ocean) at 6.56”, 6.40”, and 6.17”.
On the dry side, Sea Isle City (Cape May) caught just 0.66”, Dennis (Cape May) 0.77”, Cape May Court House (Cape May) 0.79”, two sites in Middle Township (Cape May) 1.07” and 1.20”, four in Lower Township (Cape May) from 1.21” to 1.48”, two in Oakland (Bergen) 1.39” and 1.45”, and Linden (Union) 1.43”.
A weather triple-header occurred on the 3rd, no doubt destined to be one of New Jersey’s most tumultuous weather days of 2020. Before the sun rose, thunderstorms driving from northwest to southeast across northern and central regions deposited 1.81” and 1.34” at two Bridgewater (Somerset) stations, Wall Township 1.59”, Washington Township (Morris) 1.55”, five Franklin Township (Somerset) from 1.01”–1.42”, 22 stations from 1.00”–1.81”, and 61 from 0.50”–0.99” (out of 248 reports; Figure 2, left) .
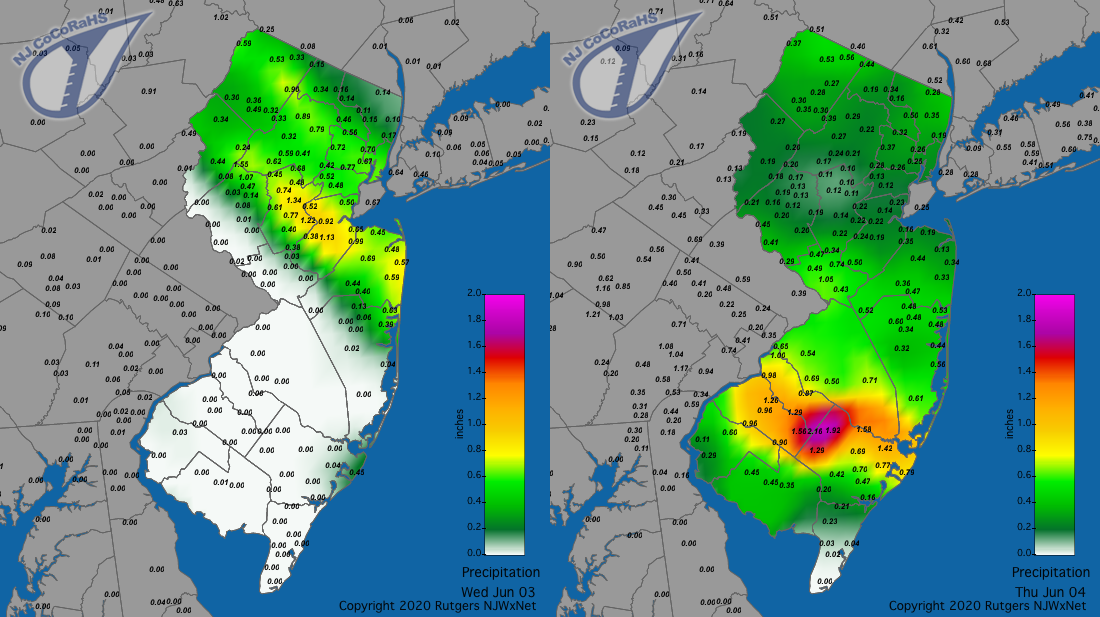
Figure 2. Rainfall from approximately 7AM on June 2nd to 7AM on the 3rd (left) and from 7AM on June 3rd to 7AM on June 4th (right). Reports are from CoCoRaHS observers.
The remainder of the morning was quiet across the Garden State. Meanwhile, a squall line in northwestern Pennsylvania began to race across the Keystone State with an impressive forward speed of close to 60 mph. By the time it crossed the Delaware River into NJ shortly after noon it was a bona fide derecho, defined by its over 250 mile path, at least 50 mile width, rapid forward speed, and wind gusts exceeding 58 mph over most of its length. Heavy rain fell briefly, but given its forward speed, totals were not heavy. Rather it was the wind that wreaked havoc, with countless trees and branches falling onto buildings and powerlines. Miraculously, no one was killed in New Jersey, though four perished in Pennsylvania. Power was out to hundreds of thousands, in some cases not to return for several days.
The derecho made it across NJ in under an hour, as seen in the two radar images in Figure 3. Peak gusts at NJWxNet stations included 70 mph at Harvey Cedars (Ocean), Columbus (Burlington) and Berkeley Township (Ocean) each 67 mph, Moorestown (Burlington) 65 mph, Pennsauken (Camden) 59 mph, Seaside Heights (Ocean) and Cedar Bridge (Burlington) each 54 mph, Silas Little (Burlington), Atlantic City Marina (Atlantic), Logan Township (Gloucester), and Lower Alloways Creek Township (Salem) each 52 mph, Sea Girt (Monmouth) 50 mph, and seven stations from 41–48 mph (Figure 4). Two WeatherFlow Inc. stations peaked at 87 mph in Brick Township and 72 mph at Waretown (Ocean). There were unofficial reports of gusts in the 80 to low 90 mph range near the coast.
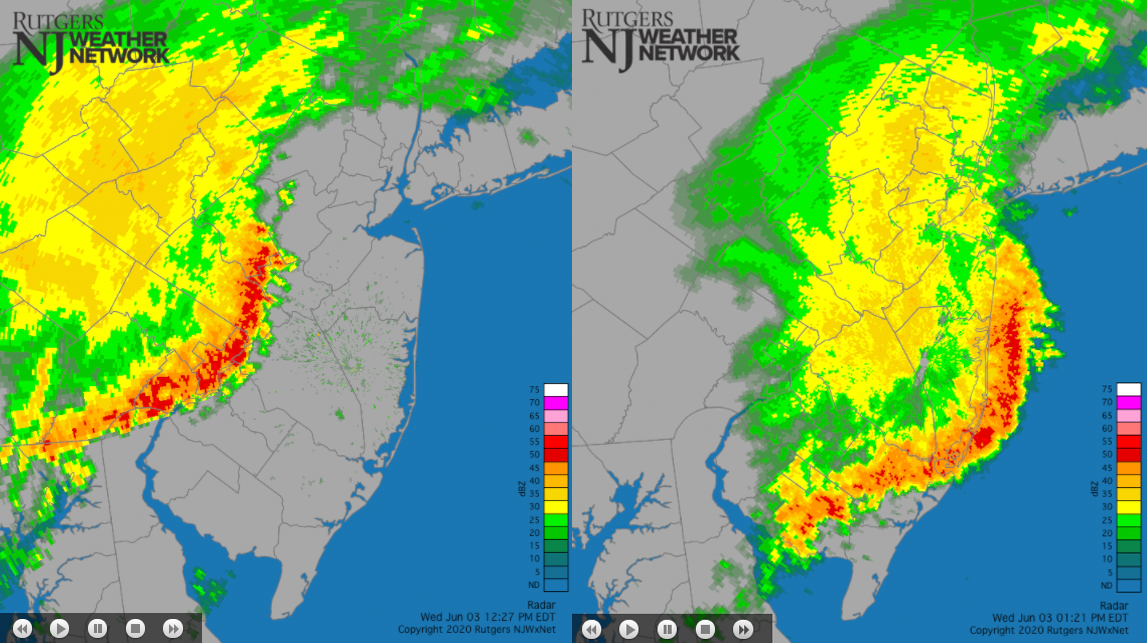
Figure 3. NJWxNet radar maps at 12:27PM (left) and 1:21PM (right) on June 3rd (radar courtesy of the National Weather Service).
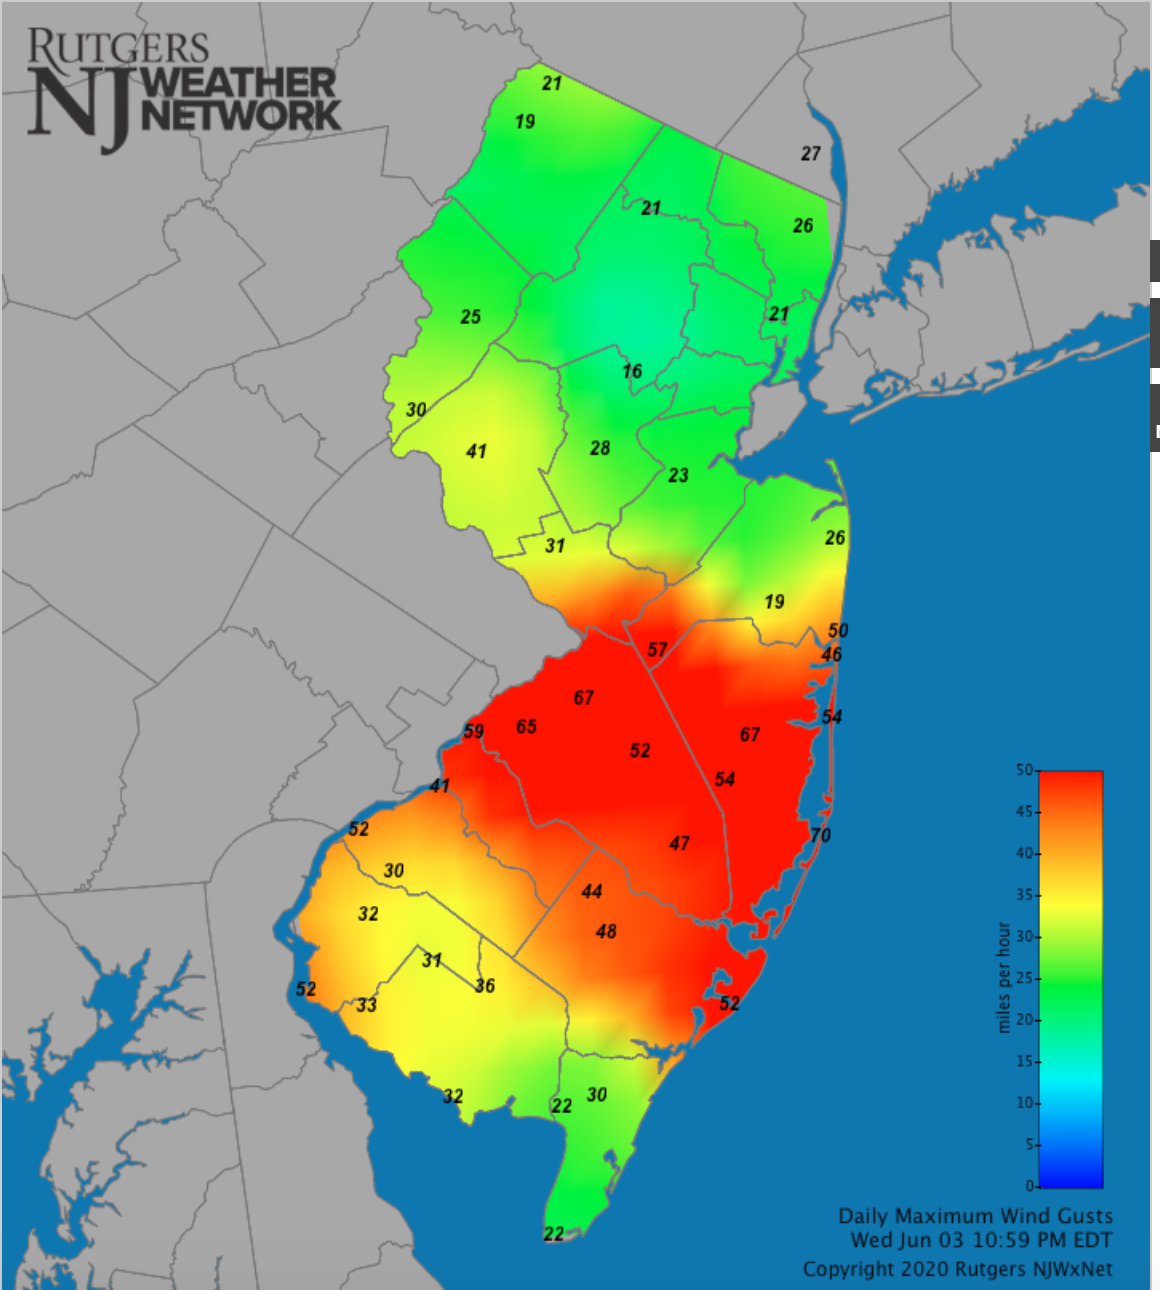
Figure 4. Maximum wind gusts at NJWxNet stations on June 3rd. Brightest red areas saw wind gusts from 50–70 mph. Higher gusts were observed at several other non-NJWxNet stations.
Next, the evening of the 3rd brought additional rain across the state, including severe thunderstorms along the general path of the Atlantic City Expressway. The bulk of the rainfall shown in Figure 2 (right) is from the evening storms, though some arrived during the derecho as presented in the radar images. All told, totals for the 24-hour period ending at 7AM on the 4th included 2.16” in Winslow Township (Camden), 2.05” and 1.92” in Hammonton (Atlantic), Washington Township (Burlington) 1.58”, Monroe Township (Gloucester) 1.56”, eight stations from 1.00”–1.55”, and 49 from 0.50”–0.99”. Rice-size hail was observed in Pitman (Gloucester).
Showers and thunderstorms returned to the state during the mid-evening of the 4th, ending by dawn on the 5th. Heaviest totals were observed in the south as Estell Manor (Atlantic) caught 1.46”, Pennsville (Salem) 1.33”, Salem (Salem) 1.10”, eight stations from 1.00”–1.09”, and 91 from 0.50”–0.99” (out of 256 reports).
Storms returned to central NJ during the afternoon of the 5th, ending in the early hours of the 6th. Hefty accumulations occurred in northern Ocean and much of Monmouth counties, with little in the southern third and northwest portions of the state (Figure 5). Two Lakewood stations caught 4.28” and 2.94”, three Wall Township sites saw 4.27” and 3.37”, Manchester Township came in with 2.94”, Brick Township 2.57”, ten stations from 2.00”–2.50”, 20 from 1.00”–1.99”, and 33 from 0.50”–0.99” (out of 247 reports).
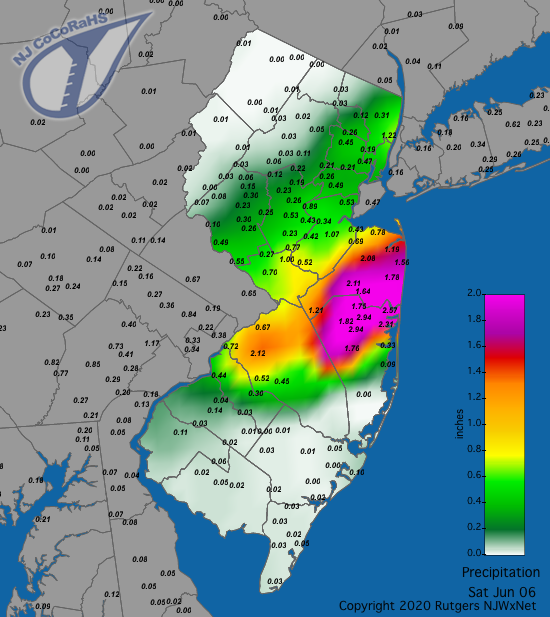
Figure 5. Rainfall from approximately 7AM on June 5th to 7AM on June 6th. Reports are from CoCoRaHS observers.
Afternoon showers and storms on the 11th brought 1.83” of rain to Colts Neck (Monmouth), Holmdel (Monmouth) 1.45”, Upper Deerfield (Cumberland) 1.41”, Manchester Township 1.38”, Galloway (Atlantic) 1.35”, 23 stations from 1.00”–1.32”, and 66 from 0.50”–0.99” (out of 254 reports; Figure 6).
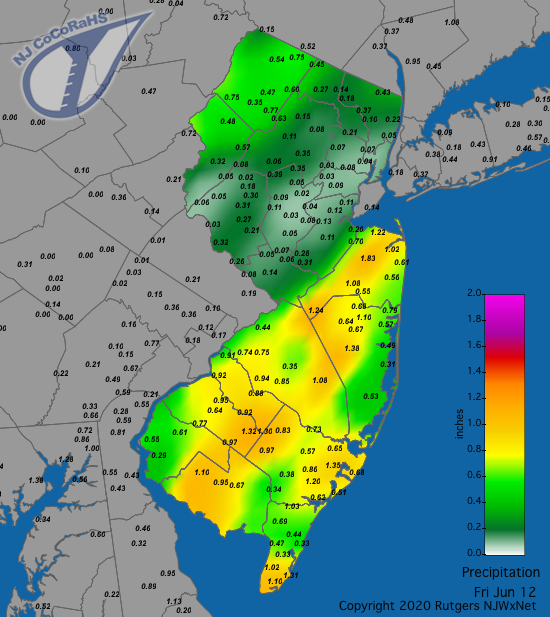
Figure 6. Rainfall from approximately 7AM on June 11th to 7AM on June 12th. Reports are from CoCoRaHS observers.
Following this rain came one of the nicer episodes of early-summer weather one could imagine, with mostly clear skies and comfortable temperatures and humidity from the 12th–17th. Come the 18th, the weather pattern began shifting to one of increasing warmth and almost daily occurrences of widely scattered storms. This regime lasted through the end of the month. Showers amounting to 0.58” at Pine Brook (Morris) and 0.52” and 0.44” at two Ewing (Mercer) locations fell on the morning of the 18th. Scattered central NJ storms on the 19th brought 1.28” and 1.27” to two Hillsborough (Somerset) locations, 1.08” to Manville (Somerset), and 1.04” and 0.81” at two western Franklin Township (Somerset) stations.
Scattered slow-moving storms in the southwest and northwest during the afternoon of the 20th brought 1.49” to Jefferson Township (Morris) and 1.30” to Silas Little. However, it was one storm in Gloucester County that was the big newsmaker. It brought a deluge of rain to a small area within which sat the Sewell NJWxNet station at James G. Atkinson Memorial Park, where in a 75 minute period 4.34” fell, with 3.61” of that accumulating in 50 minutes between 3:15–4:05 PM. Two nearby Washington Township stations caught 3.50” and 3.04”, and Wenonah 1.38”. However, just miles away, little to no rain fell. A radar image near the height of the storm is shown at various spatial scales in Figure 7, with 0.98” falling in the 10 minutes preceding the image. The 3.99” in one hour has a return period of 1000 years according to NOAA Atlas 14. Mantua Creek in Pitman rose over 5 feet in minutes with the amount of water flowing past a USGS gauge station in Pitman increasing over 80 fold, from just over 6 cubic feet/second to almost 500 cubic feet/second (Figure 8).
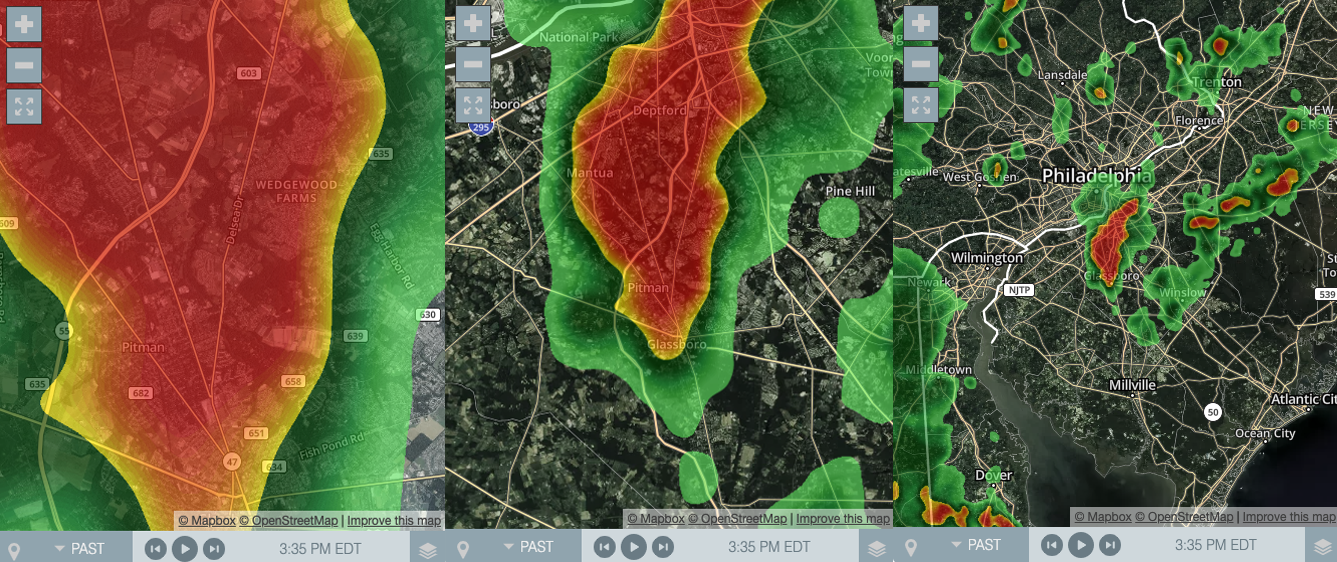
Figure 7. WNBC radar image of Sewell deluge taken at 3:35PM on June 20th. The NJWxNet station at James G. Atkinson Memorial Park is in the center of each frame. From left to right the frames encompass an increasing geographic area. The radar dish is located on Rutgers Cook Campus in New Brunswick (Middlesex).
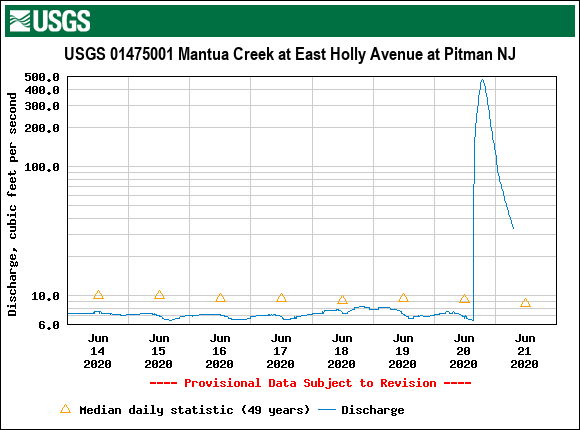
Figure 8. Stream discharge on Mantua Creek in Pitman from June 14th to early on June 21st. Courtesy of the US Geological Survey.
The 22nd saw stray storms deposit 1.92” in Lambertville (Hunterdon) and 0.58” in Millville (Cumberland). Similarly, scattered afternoon and evening storms on the 23rd brought 1.21” to Frenchtown (Hunterdon), 1.97” in Vernon Township (Sussex), and 0.97” in Franklin Township (Hunterdon). That story continued on the 25th in the southwest, with 1.50” in Greenwich (Salem), Upper Deerfield 1.05”, Tabernacle (Burlington) 0.94”, and Pittsgrove (Salem) 0.91”. On the 27th, a modest squall line traversed the state from central sections into northern portions of the south during the afternoon and evening. At its southern end it deposited 2.01” at Berkeley Township, Toms River (Ocean) 1.82” and 1.55”, Manchester Township 1.58” and 1.34”, Brick Township 1.35”, and Jackson Township (Ocean) 1.32” (Figure 9).
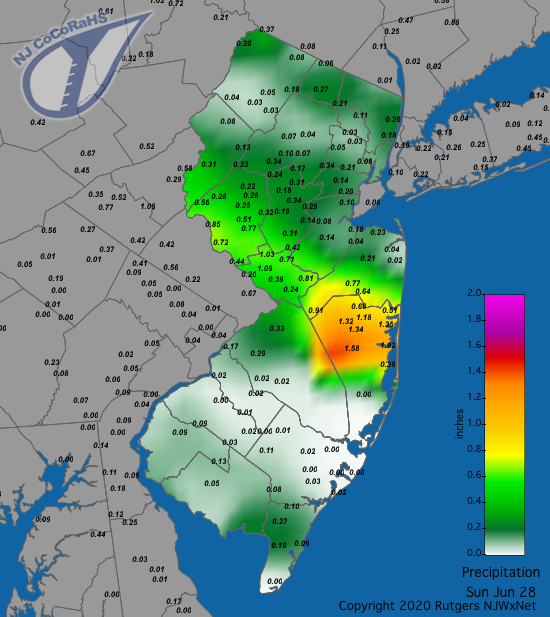
Figure 9. Rainfall from approximately 7AM on June 27th to 7AM on June 28th. Reports are from CoCoRaHS observers.
More scattered showers appeared on the 28th, with Toms River catching 1.16”, Sandyston (Sussex) 0.82”, Point Pleasant Beach (Ocean) 0.77”, and Vernon Township 0.70”. A strong thunderstorm struck a glancing blow in the northeast on the 29th depositing 0.80” of rain in Haworth (Bergen) and 0.47” in Tenafly (Bergen), with 1” diameter hail reported in portions of Bergen County and nickel-size hail in Denville (Morris). The Bergen County storm can be seen in Figure 10 as it is about to drop south from Rockland County, NY into Bergen.
While rainfall totals from afternoon showers on the 30th will be included in the July tally, it is worth noting some of the heavier totals from the storms that were focused from Essex County south to Middlesex County. East Brunswick (Middlesex) and Newark Airport (Essex) each received 1.44”, three New Brunswick (Middlesex) locations caught between 0.82”–1.42”, two Highland Park (Middlesex) sites 1.17” and 1.04”, and South River (Middlesex) 0.81”.
The stormy 3rd saw the lowest barometric pressure of the month at 29.55”–29.65”, with the highest readings of 30.40”–30.45” on the 15th. In addition to the derecho gusts on the 3rd, five other June days found one or more NJWxNet station gusting to 40 mph or higher. This includes a 64 mph gust at Lower Alloways Creek Township on the 4th, with Berkeley Township reaching 43 mph and Mannington (Salem) 42 mph. The High Point Monument (Sussex) anemometer gusted to 45 mph on the 6th and 40 mph on the 7th. Silas Little reached 40 mph on the 20th, with Fortescue (Cumberland) reaching 59 mph and Sea Girt 53 mph in storms on the 27th.
Temperature
Twelve June afternoons found the maximum temperature at one or more NJWxNet or NWS stations topping out at 90° or higher. On the other side of the coin, ten mornings saw minimum temperatures in the 30°s or 40°s at Walpack (Sussex), Sandyston, and occasionally other locations. The warmth was concentrated in the first and last ten-day periods of the month, with the cold all within the first three weeks.
Of the 90° days, the first was on the wild day of the 3rd, with Pomona (Atlantic City Airport; Atlantic) and Margate (Atlantic) up to 92°, Estell Manor and Egg Harbor Township (Atlantic) at 91°, and three stations at 90°. Hillsborough-Duke (Somerset), Hightstown (Mercer), and Vineland (Cumberland) reached 91° on the 4th, followed by 11 stations at 90°. Every NJWxNet station reached 80° on the 4th, with Harvey Cedars at that lower value. Woodbine (Cape May) was alone at 90° on the 5th. Up north, Sandyston, Newark Airport, and Caldwell (Essex) reached 91° on the 9th, with Jersey City (Hudson) at 90°. Hightstown topped out at 95° on the 10th, followed by Hamilton (Mercer) and West Deptford (Gloucester) at 93°, 12 stations at 92°, and 19 from 90°–91°. Meanwhile, West Cape May (Cape May) and Harvey Cedars only made it to 74°.
The 90° mark was again reached at Basking Ridge (Somerset) on the 20th. The NWS Cooperative station at Harrison (Hudson) recorded the highest NJ temperature of June reaching 96° on the 22nd. Other hot spots that day were 93° in Caldwell, Hightstown, and Basking Ridge, and 90°–92° at 25 NJWxNet locations. Basking Ridge and Moorestown hit 93° on the 23rd, Hamilton (Mercer), Hillsborough, and New Brunswick 92°, and 22 stations at 90°–91°. The 26th saw Hamilton (Mercer), Moorestown, and Pomona reach 90°. Cape May Court House and Moorestown got to 92° and eight sites from 90°–91° on the 27th. The most widespread 90° coverage of the month was on the 28th, with Moorestown up to 95°, Estell Manor and Harrison 94°, Cape May (Cape May), Pennsauken, and Newark 93°, and 32 stations from 90°–92°. High Point Monument was coolest at 80°. Cape May Court House, Woodbine, and Estell Manor reached 92° on the 29th, with 14 stations from 90°–91°. The 29th provided an excellent example of sea breeze conditions that are found on many a summer day along all or a portion of the Jersey coastline, including Delaware Bay, Raritan Bay, and NY Harbor. Late-afternoon temperatures are in the upper 70°s along most of the Atlantic Coast, while inland locations are in the upper 80°s and low 90°s (Figure 10, left). The boundary of the ocean-cooled air can be seen in the radar image (Figure 10, right) as a thin green line that heads inland in northern Cape May County and peters out in southern Monmouth County. The radar picks up insects and perhaps fine dust particles (aerosols) that tend to converge at the sea breeze boundary. Note the warmer temperatures in southern Cape May County and along the Delaware Bay coast where the prevailing wind direction was not conducive to a sea breeze on this day.
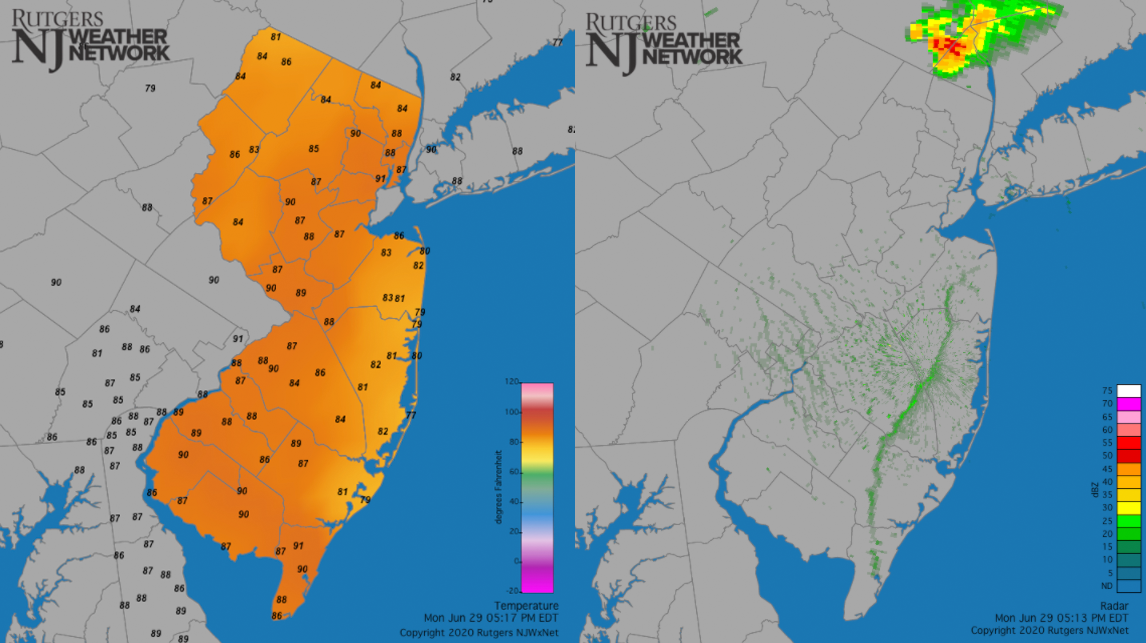
Figure 10. NJWxNet temperatures at 5:17PM (left) and the NWS radar image at 5:13PM (right) on June 29th.
The 32° minimum at Walpack on the 1st was discussed in the May report in association with the wide disparity of dates denoting the start of the growing season across the state (March 2nd near the coast to June 2nd at Walpack). Sandyston fell to 33° on the 1st, with 11 NJWxNet stations from 35°–39°. Harvey Cedars and Lower Alloways Creek Township had the warmest lows of 54°. Walpack fell to 38° and Sandyston 40° on the 2nd. Walpack was 46° and Sandyston 49° on the 7th, Walpack 39° and Sandyston and Pequest (Warren) 42° on the 8th, and Walpack 44° and Sandyston 47° on the 9th.
Five consecutive days beginning on the 13th completed the 40°s or lower minimums of June. Walpack fell to 42° and Sandyston, High Point (Sussex), and High Point Monument 45° to kick things off. Walpack was 37° and Sandyston 40° on the 14th, with 15 stations from 44°–49°. Walpack dropped to 39° and Sandyston 41° on the 15th, Walpack 41° and Sandyston 44° on the 16th, and Walpack 43° on the 17th.
Mid-year 2020 Overview
The first six months of 2020 were on the dry side across New Jersey, which was quite a change from the persistent wet conditions of recent years. The statewide average of 18.31” was 3.99” below the 1981–2010 normal and ranked as the 22nd driest start of the year. The last year that with a drier start was 2012 with 17.20”. Compare this with the wettest start of 32.23” in 1983. The northern half of the state had the drier conditions, particularly in the northwest where totals were below 17” in places. Cape May County was also dry (Figure 11). Portions of the south saw as much as 24”. Wall Township took top honors with 24.78”, followed by 23.55” and 22.77” at two Brick Township stations, Lakewood 23.23”, Mt. Laurel (Burlington) 22.87”, and Point Pleasant Beach 22.86”. On the dry side Andover (Sussex) only saw 16.59”, Montague (Sussex) 16.63”, Lower Township 16.71”, Phillipsburg (Warren) 16.89”, Middle Township 17.08”, and Blairstown (Warren) 17.25”.
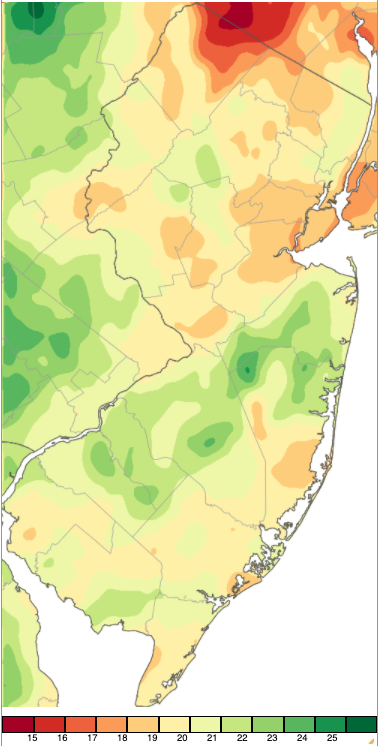
Figure 11. January 1–June 30, 2020 precipitation across New Jersey based on a PRISM analysis generated using NWS Cooperative and CoCoRaHS observations (Oregon State University).
The average temperature for the first six months of 2020 was 50.3°. This is 2.6° above average and ties with 2010 and 2017 as the 3rd warmest on record (Table 2). Four of the six months ranked among the ten warmest since 1895 (January 10th, February 4th, March 6th, and June 10th), while April and May were the first consecutive months with below-normal temperatures since December 2017–January 2018.
| Rank | Year | January–June Avg. Temp. |
|---|---|---|
| 1 | 2012 | 52.0° |
| 2 | 1998 | 50.9° |
| 3 | 2020 | 50.3° |
| 3 | 2017 | 50.3° |
| 3 | 2010 | 50.3° |
| 6 | 2002 | 50.2° |
| 6 | 1991 | 50.2° |
| 8 | 2006 | 49.9° |
| 9 | 1990 | 49.6° |
| 10 | 1921 | 49.4° |
Table 2. The 10 warmest January-June intervals across NJ since 1895.
For those seeking more detailed information on 5-minute, hourly, daily, and monthly conditions, please visit the following Office of the NJ State Climatologist's websites:
Rutgers NJ Weather Network
NJ Community Collaborative Rain, Hail and Snow Network
NJ Snow Event Reports
Interested in receiving our monthly summaries at the end of each month? Send us your e-mail address here to join the mailing list.
Past News Stories

