The Lion Roars: March 2024 Recap
New Jersey State Climatologist
Center for Environmental Prediction, School of Environmental and Biological Sciences/NJAES
Rutgers University
April 5, 2024
Overview
So much for March flipping from lion to lamb or vice versa. March 2024 was often a lion throughout, with frequent roaring winds and multiple rain events producing a near-record monthly precipitation total and occasional flooding. The first half of the month ran at a record-warm pace, the monthly average later to be tempered by a second half that was cooler than the first. Still, the month emerged as the 9th mildest on record. Befitting the overall mild conditions, snowfall was scarce to non-existent.
Winds gusted to 35 mph or higher at one or more Rutgers NJ Weather Network (NJWxNet) station on 16 days, exceeding 40 mph on 11 of those days. Precipitation (rain and the water equivalent of the very little snow that fell) averaged 7.76” across the state. This is 3.56” above the 1991–2020 normal and ranks as the third wettest March since records commenced in 1895 (Table 1). The northwest was least wet with 6.00”–7.00” falling (Figure 1). Totals increased to the southeast where near coastal areas received 9.00”–10.00”. The northern climate division averaged 7.01” (+3.00, 6th wettest), the southern division 8.15” (+3.83”, 3rd wettest), and the coastal division 8.98” (+4.56, 2nd wettest).
| Rank | Year | March Avg. Precip. |
| 1 | 2010 | 8.66” |
| 2 | 1912 | 8.03” |
| 3 | 2024 | 7.76” |
| 4 | 1983 | 7.72” |
| 5 | 1994 | 7.12” |
| 6 | 1980 | 6.98” |
| 7 | 1993 | 6.90” |
| 8 | 1953 | 6.84” |
| 9 | 1984 | 6.34” |
| 10 | 1899 | 6.32” |
Table 1. The 10 wettest Marches across NJ since 1895.
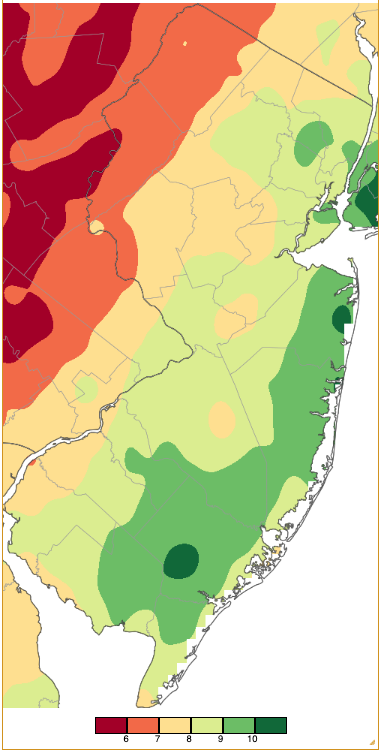
Figure 1. March 2024 precipitation across New Jersey based on a PRISM (Oregon State University) analysis generated using NWS Cooperative, CoCoRaHS, NJWxNet, and other professional weather station observations from 7 AM on February 28th to 8 AM on March 31st. Note the scale in inches at the bottom of the map. Totals range from 5.00”–5.99” (dark red) to 10.00”–10.99” (dark green).
March statewide average snowfall was 0.0”. This was 4.6” below normal and ranks with eleven other Marches as the lowest on record. Two of these include 2020 and 2021. The northern snow division averaged 0.1” (-7.2”) and the central and southern divisions 0.0” (-5.4” and -2.7”, respectively).
The statewide average March temperature was 46.0°. This is 5.0° above normal and ranks as the 9th mildest of the past 130 years (Table 2). The average high temperature of 55.6° was 4.7° above normal and ranks 10th mildest. The average low of 36.3° was 5.1° above normal and ranks 4th mildest. The northern division averaged 43.9° (+5.1°, 9th mildest), southern division 47.2° (+4.8°, 8th mildest), and coastal division 47.0° (+4.8°, 7th mildest).
| Rank | Year | March Avg. Temp. |
| 1 | 2012 | 49.8° |
| 2 | 1945 | 48.8° |
| 3 | 1921 | 48.4° |
| 4 | 2016 | 47.0° |
| 5 | 1946 | 46.8° |
| 6 | 2020 | 46.3° |
| 7 | 2010 | 46.2° |
| 7 | 1903 | 46.2° |
| 9 | 2024 | 46.0° |
| 10 | 2000 | 45.6° |
Table 1. The ten mildest Marches across NJ since 1895.
The 26th saw the commissioning of the 68th NJWxNet station in Chester Borough (Morris County). The Office of the NJ State Climatologist thanks the NJ Highlands Council for sponsoring the station and Chester Borough for providing the site for the station.
Precipitation and Storms
Seven NJWxNet and Community Collaborative Rain, Hail, and Snow Network (CoCoRaHS) stations topped the 10.00” mark for March precipitation totals. They included Eatontown (Monmouth) with 10.57”, Oceanport (Monmouth) 10.27”, Ocean Township (Monmouth) 10.41”, Berkeley Township (Ocean) 10.22”, Estell Manor (Atlantic) 10.19”, Jackson Township (Ocean) 10.17”, and Neptune Township (Monmouth) 10.04”. Though still close to 150% of normal, the following communities received the least amount of March precipitation: Liberty Township (Warren) 6.04”, Knowlton Township (Warren) 6.23”, Newton (Sussex) 6.35”, Hackettstown (Warren) 6.41”, Stillwater Township (Sussex) 6.46”, and Montague (Sussex) 6.56”.
Monthly snow totals at most CoCoRaHS stations were a trace or nothing. Nine stations measured from 0.1”–0.3”, including Jefferson Township (Morris) 0.3”, and Rockaway Township (Morris), Greenwich Township (Warren), and Montague Township each with 0.2”. Snowfall reached 1.4” at High Point Monument (Sussex) on the 19th but this may not be the monthly total at this unofficial location as it is uncertain if measurable snow occurred there on other occasions.
The first March storm occurred during the morning and afternoon hours of the 2nd. The near-coastal south was wettest and northwest driest, establishing a pattern that would repeat itself throughout the month (Figure 2). Middle Township (Cape May) led the way with 2.17”, followed by Estell Manor 2.07” and Eatontown 2.01”. Some 186 of the 238 reporting CoCoRaHS stations caught from 1.00”–1.99”. Sparta Township (Sussex) at 0.60” received the least.
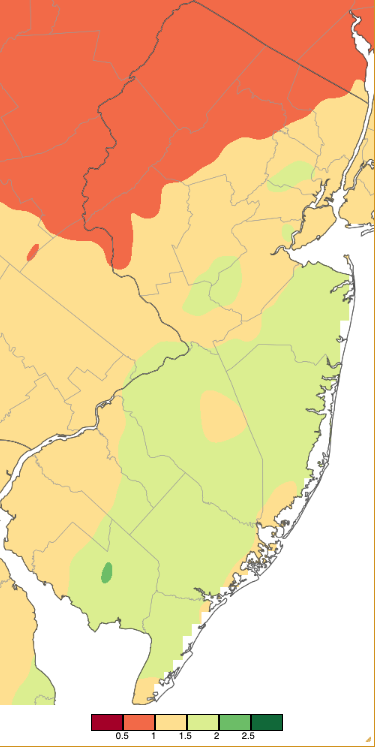
Figure 2. Precipitation across New Jersey from 7 AM on March 1st through 7 AM March 3rd based on a PRISM (Oregon State University) analysis generated using NWS Cooperative, CoCoRaHS, NJWxNet, and other professional weather station observations. Note the scale in inches beneath the map.
Rain soon returned, with totals from late on the 4th into the afternoon of the 5th totaling as much as 2.15” in Maurice River Township (Cumberland), Hamilton Township (Atlantic) 1.45”, Maywood (Bergen) 1.34”, and 129 stations from 0.50”–1.05”. Washington Township (Warren) only registered 0.19”.
Another soaker arrived from south to north during the daylight hours of the 6th, ending during the pre-dawn of the 7th. Of the 256 CoCoRaHS reports, Wildwood Crest (Cape May) topped all at 2.61”, followed by Bradley Beach (Monmouth) 2.34”, Surf City (Ocean) 2.24”, and two Lower Township (Cape May) stations with 2.20” and 2.17” (Figure 3). Eighteen stations reported 2.00”–2.61” and 194 from 1.00”–1.94”. Phillipsburg (Warren) with 0.38” received the least. A wind gust of 40 mph was registered at Vernon Township (Sussex) on the 7th.
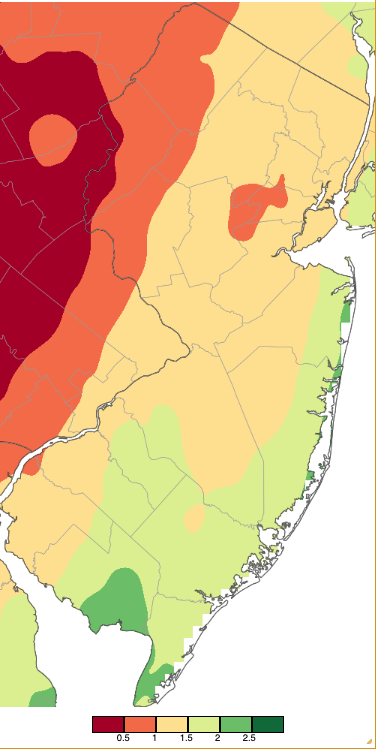
Figure 3. Precipitation across New Jersey from 7 AM on March 6th through 7 AM March 7th based on a PRISM (Oregon State University) analysis generated using NWS Cooperative, CoCoRaHS, NJWxNet, and other professional weather station observations. Note the scale in inches beneath the map.
The fourth and last in the series of early-March storms moved into the Garden State from the west midday on the 9th, ending in the pre-dawn hours of the 10th. This was the one event of the month where the north received considerably more precipitation than the south. Little Falls (Passaic) topped the list with 2.78”, followed by Montclair (Essex) 2.72”, Verona Township (Essex) 2.70”, and Wayne Township (Passaic) and Hawthorne (Passaic) each with 2.69”. Thirty-eight of the 257 CoCoRaHS reports were from 2.00”–2.78” and 170 from 1.00”–1.99”. Maurice River Township caught the least at 0.36”. Winds on the 9th gusted to 48 mph at Fortescue (Cumberland) and 40–44 mph at seven other NJWxNet stations.
Squally rain and snow showers followed during the afternoon of the 10th as winds howled. Gusts reached a monthly maximum of 66 mph at Little Egg Harbor Township (Ocean), with Lower Alloways Creek Township (Salem) 59 mph, Fortescue 54 mph, Atlantic City Marina (Atlantic) 50 mph, and 18 other NJWxNet stations 40–49 mph.
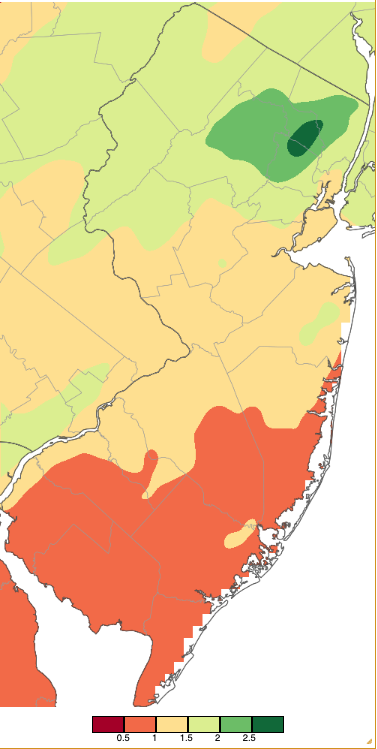
Figure 4. Precipitation across New Jersey from 7 AM on March 9th through 8 AM March 10th based on a PRISM (Oregon State University) analysis generated using NWS Cooperative, CoCoRaHS, NJWxNet, and other professional weather station observations. Note the scale in inches beneath the map.
As skies cleared, strong winds continued through the daytime hours of the 11th. High Point Monument saw a peak gust of 58 mph, Vernon Township 57 mph, both Little Egg Harbor Township and Sea Girt (Monmouth) 54 mph, both Fortescue and Seaside Heights (Ocean) 50 mph, and 23 other stations from 40–49 mph (Figure 5).
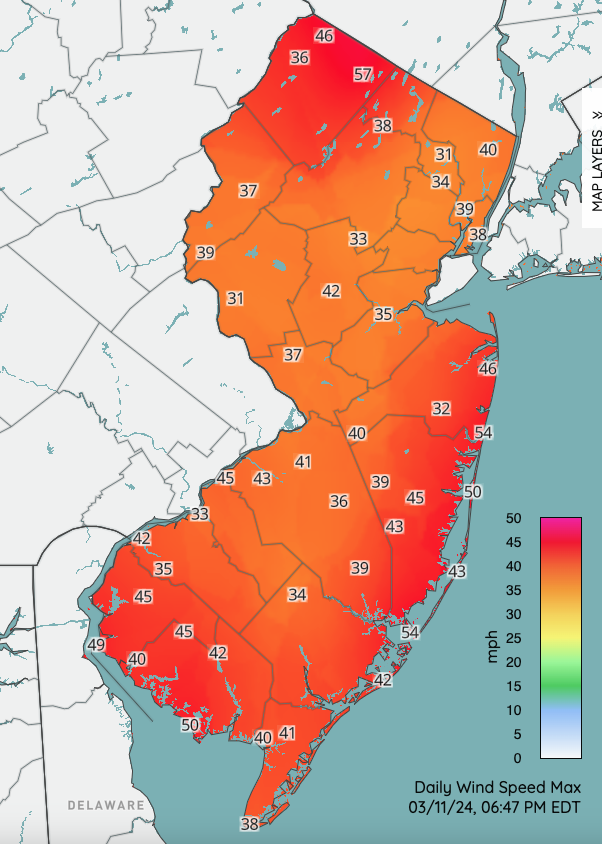
Figure 5. Peak wind gusts at selected NJWxNet stations on March 11th. All peak gusts had been reached by the map generation time of 6:47 PM.
Very little precipitation fell between the 11th and 22nd except for some rain and snow showers on 19th that dusted the ground in some northern locations and brought minor accumulations to others, including the aforementioned 1.4” at High Point Monument. The wind still blew strongly on several occasions, with Vernon Township gusting to 40 mph on the 15th, Lower Alloways Creek Township 49 mph on the 20th when ten other stations reached 40–45 mph, and 41 mph at Vernon Township and Lower Alloways Creek Township and 40 mph at High Point Monument on the 21st.
The biggest rain-producing storm of the month arrived during the pre-dawn hours of the 23rd, tapering off during the late afternoon/early evening. The NJ Turnpike corridor saw the most rain with the immediate southern coast and northwest the least (Figure 6). South Harrison Township (Gloucester) was deluged with 4.20”, Salem (Salem) 4.01”, Palisades Park (Bergen) 3.98”, Mantua Township (Gloucester) 3.93”, Glassboro (Gloucester) 3.80”, Harrison (Hudson) 3.78”, Barrington (Camden) 3.73”, and Vineland (Cumberland) 3.68”. Of the 241 CoCoRaHS reports, 81 caught from 3.00”–3.99”, 142 from 2.00”–2.99”, and 13 from 1.00”–1.99”. The lowest totals for the day were 1.00” and 1.12” in Brigantine (Atlantic). Freezing rain occurred at higher elevations in the northwest, as witnessed by the photo below from High Point State Park (Figure 7). Strong winds associated with the storm blew on the 23rd with High Point Monument gusting to 52 mph and nine stations from 40–49 mph. The 24th had gusts to 44 mph at the Monument, 42 mph at Lower Alloways Creek Township, and 40 mph in Seaside Heights.
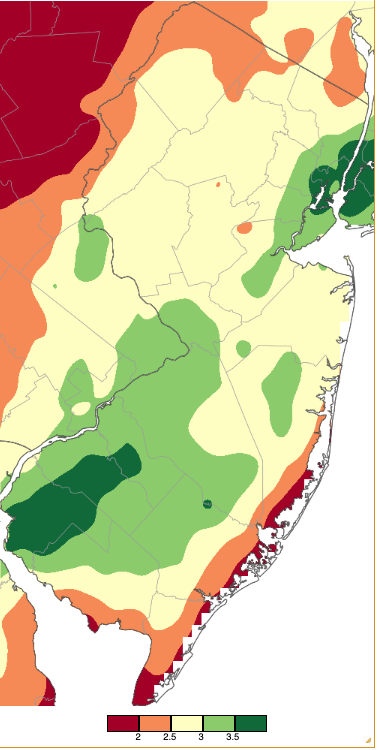
Figure 6. Precipitation across New Jersey from 8 AM on March 22nd through 8 AM March 24th based on a PRISM (Oregon State University) analysis generated using NWS Cooperative, CoCoRaHS, NJWxNet, and other professional weather station observations. Note the scale in inches beneath the map differs from the other event maps in this section of the report.

Figure 7. Ice-encased branch with High Point Monument in the background resulting from freezing rain on the morning of March 23rd (courtesy of Shawn Viggiano).
March would not depart until one last rainstorm visited. Beginning with afternoon rain in the northwest on the 27th, widespread rain fell early on the 28th, concentrated most heavily at the coast into the daylight hours before tapering off with evening showers. While having the lowest totals in the previous storm, this time the two Brigantine stations topped the list with 2.03” and 2.00” (Figure 8). Wildwood Crest also saw 2.03” and Berkeley Township 1.97”. Sixty-two CoCoRaHS stations received 1.00”–1.99” and 144 from 0.50”–0.99”.
On the backside of this storm, winds gusted on the 29th to 47 mph at High Point Monument, Vernon Township 46 mph, Seaside Heights 41 mph, and Lower Alloways Creek Township 40 mph. High Point Monument reached 46 mph and Vernon Township 45 mph on the 30th.
The highest barometric pressures during March occurred on the 1st, ranging from 30.60”–30.70”. The lowest pressures were between 29.35”–29.45” on the 10th.
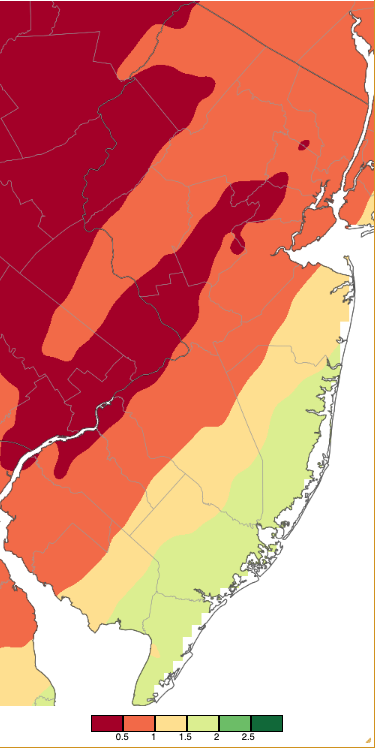
Figure 8. Precipitation across New Jersey from 8 AM on March 27th through 8 AM March 29th based on a PRISM (Oregon State University) analysis generated using NWS Cooperative, CoCoRaHS, NJWxNet, and other professional weather station observations. Note the scale in inches beneath the map.
March (7.76”) was the third excessively wet month of the most recent four. Statewide, December (8.37”) was the wettest on record and January (6.21”) was 7th wettest. Despite a February on the dry side (1.79”, 1.07” below normal), the four-month total of 24.13” was 9.31” above normal and ranks as the wettest December–March period (Table 3). Flooding resulted from several of these events and filled riverbanks on multiple occasions. The discharge profile of the Raritan River at Bound Brook (Somerset; Figure 9) illustrates the many rain-induced rises over the period, including three early in March and a larger one later in the month. The two largest discharge events in December and January ranked as 9th and 10th greatest in almost a century of records at the gaging station. These flows of just over 30,000 cubic feet/second were 30 times greater than lower flows during the period. However, they pale in comparison to the three largest flows on record, each just over 80,000 cubic feet/second and associated with Floyd (1999), Irene (2011), and Ida (2021).
| Rank | Year | Dec.–March Avg. Precip. |
| 1 | 2024 | 24.13” |
| 2 | 2010 | 23.63” |
| 3 | 1979 | 22.69” |
| 4 | 1958 | 21.39” |
| 5 | 1902 | 21.17” |
| 6 | 1903 | 20.84” |
| 7 | 1994 | 20.75” |
| 8 | 1984 | 19.77” |
| 9 | 1899 | 19.41” |
| 10 | 1978 | 19.07” |
Table 3. The ten wettest December–March periods across NJ since 1895/96. The year listed refers to the January–March year.
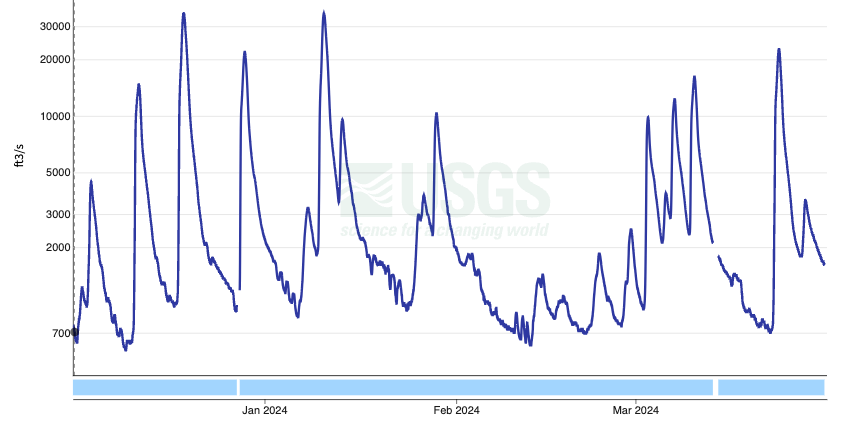
Figure 9. Time series of discharge (cubic feet/second) at the Bound Brook gage on the main stem of the Raritan River from December 1, 2023, to March 31, 2024 (US Geological Survey).
Temperature
As to be expected in a transitional month, the thermometer had its ups and downs in March. As reported earlier, the ups prevailed, particularly during the first half of the month when at least one NJWxNet station reached 70° on five days, while no location reached that mark from the 16th onward. At New Brunswick (Middlesex), the average temperature through the 15th was 49.0° while the remaining 16 days averaged 44.7°. This during a month when the average temperature normally rises by approximately 10° from the 1st to 31st.
There were twelve days when one or more stations climbed to the 60° mark. Of them, nine reached 65°. The first was on the 3rd when Hammonton (Atlantic) reached 70° and 52 of the 67 NJWxNet stations topped out from 65°–69°. The 4th saw Fort Dix (Burlington) and Red Lion (Burlington) up to 68° and 24 stations from 65°–69°. Coastal Sea Girt and Seaside Heights were coolest at 51°.
The 12th–17th saw early-season warmth invade New Jersey. Mansfield (Burlington) reached 70° on the 12th when 51 other stations were from 65°–69° and even the coolest location, High Point Monument, reached 58°. Pennsauken (Camden), Sicklerville (Camden), and Red Lion made it to 75° on the 13th, with 43 stations from 70°–74° and 10 at 65°–69°. The warmest March day was the 14th with Hammonton, Sicklerville, and Red Lion all topping out at 79°, 53 stations from 70°–78°, and seven from 65°–69° (Figure 10). Sea Girt and Harvey Cedars (Ocean) only made it to 56°. A mid-afternoon temperature map shows the impact of the cool coastal waters on atmospheric temperatures with a range among southern stations from 51° (Seaside Heights and Harvey Cedars) to 78° (Sicklerville). Impressive diurnal ranges were observed on the 14th at Walpack (Sussex) with a low/high of 33°/76°, and both Hillsborough/Duke (Somerset) and Hopewell Township (Mercer) 35°/75°.
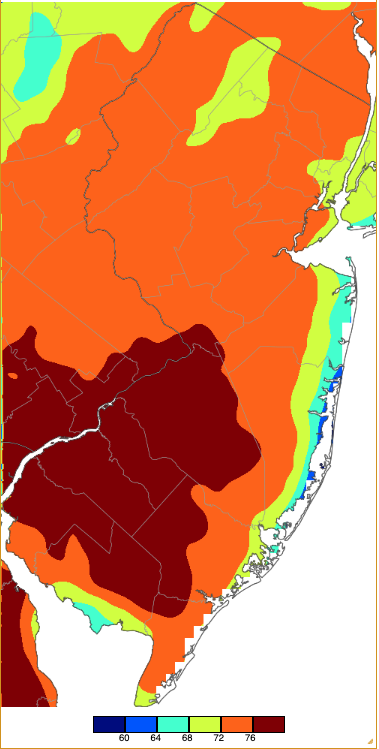
Figure 10. Maximum temperatures on March 14th based on a PRISM (Oregon State University) analysis generated using NWS, NJWxNet, and other professional weather stations. Note the 2° scale beneath the map.
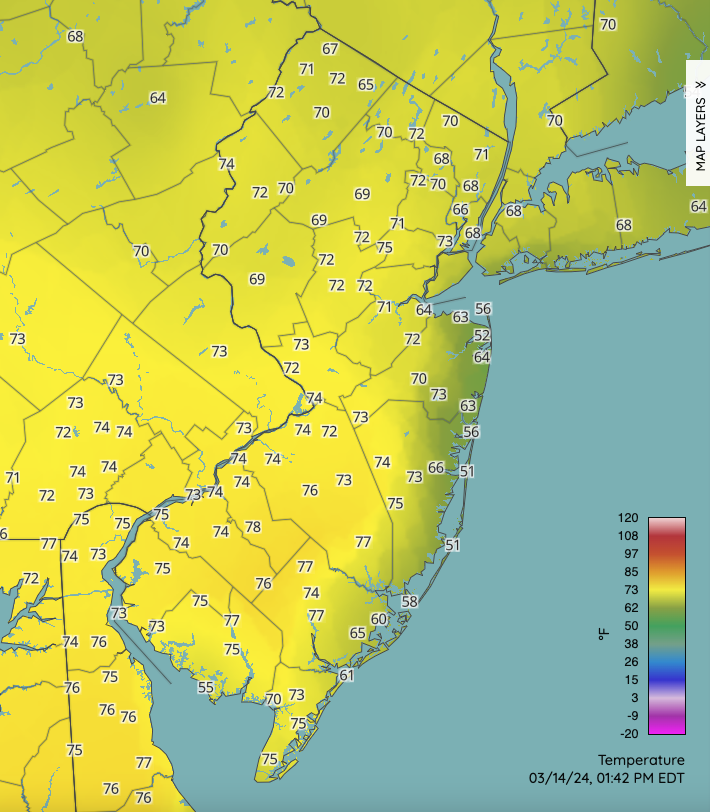
Figure 11. Temperatures at around 1:40 PM on March 14th at NJWxNet, NWS, and other professional weather stations.
Warmth continued on the 15th with Fort Dix, Mansfield, and Sicklerville all up to 77°, 49 stations from 70°–76°, and 12 from 65°–69°. Forty-two stations were in the low 60°s on the 16th before the upper 60°s were reached on the 17th with Hammonton at 68° and 24 locations from 65°–67°.
An impressive spread of high temperatures occurred on the 20th when Cape May Court House (Cape May) made it to 66° with four other sites at 65°, while High Point Monument only reached just 38° and three other northwest stations 42°. Cape May Court House reached 66° again on the 31st and Woodbine (Cape May) 65°.
Daily minimum temperatures dropped below freezing at one or more NJWxNet locations on 21 March days. However, on just two days (21st and 22nd) did every station in the network drop to or below the freezing mark. Twelve of the 21 freezing days found a station at or below 25°. This included the 1st with Walpack down to 16°, 12 stations from 17°–20°, and 39 from 21°–25°. Meanwhile, Seaside Heights fell to just 40°. The 10th and 11th each saw High Point Monument at 25°. While Walpack was only down to 28° on the 13th, the daily maximum of 74° resulted in a 46° diurnal range.
Walpack took low honors on the 18th at 25° and High Point Monument at 24° on the 19th. The Monument fell to 21° and High Point (Sussex) 24° on the 20th. The Monument reached 18° on the 21st with 13 sites from 21°–25°. The regional air mass was quite dry on the 21st, with evening dew points in the single digits to teens (Figure 12). This contributed to the fifth day (22nd) of a nine-day run of 25° or colder minimums and the overall coldest morning for the month with High Point Monument at 16°, 13 stations from 17°–20°, and 27 from 21°–25° (Figure 13). As is often the case, the “milder” stations, all below freezing, were along coasts and in urban areas.
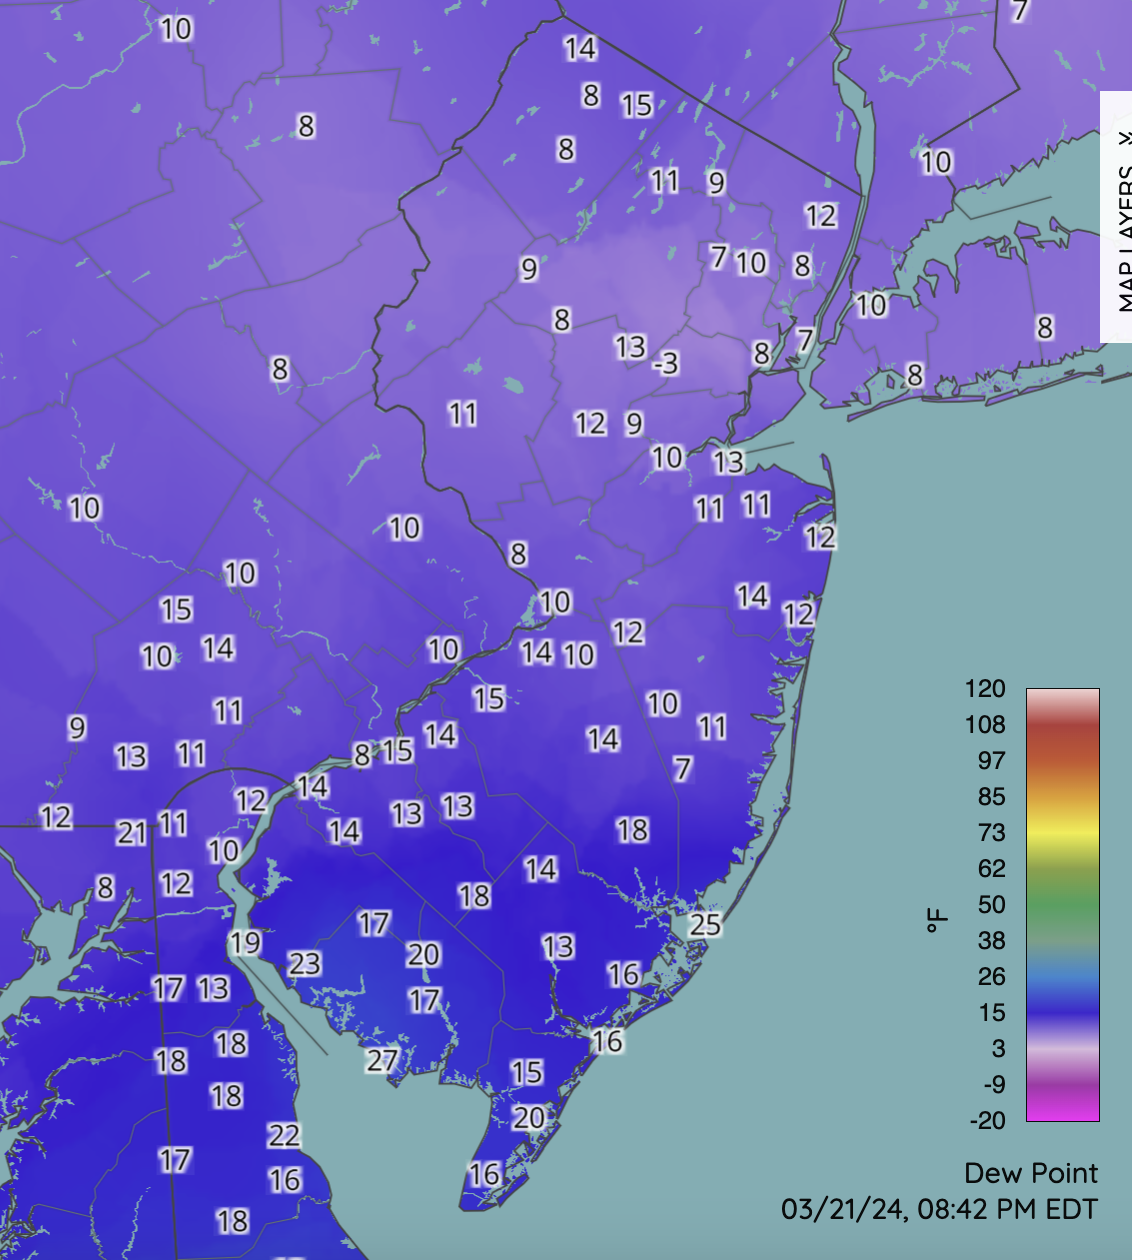
Figure 12. Dew point temperatures at 8:48 PM on March 21st at NJWxNet, NWS, and other professional weather stations.
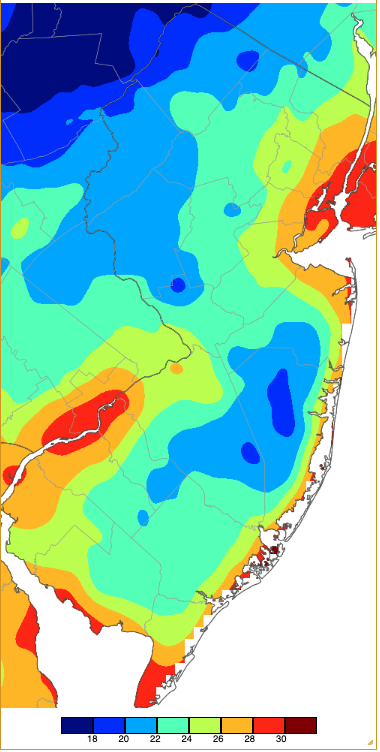
Figure 13. Minimum temperatures on March 22nd based on a PRISM (Oregon State University) analysis generated using NWS, NJWxNet, and other professional weather stations. Note the 2° scale beneath the map.
Cold continued on the 23rd, with High Point Monument at 23° and High Point 25°. Fifty-nine stations had lows of 26°–32° on the 24th while the Monument was as cold as 17° and seven stations were 22°–25°. Walpack fell to 21° with four stations from 22°–25° on the 25th. The last March day of sub-25° cold saw Walpack at 24° on the 26th.
Taking a look at overall temperature for the December–March period, “persistent mildness” was the operative term. The 39.8° average is 4.0° above normal. December ranked 3rd mildest, January 21st mildest, February 13th mildest, and March 9th mildest. Thus, the ranking for this interval tied with 2020 and 2002 for the 3rd mildest over the past 129 years (Table 4). Six of the ten mildest have occur in the past nine years, all since 1991.
| Rank | Year | Dec.–March Avg. Temp. |
| 1 | 2012 | 41.2° |
| 2 | 2016 | 40.6° |
| 3 | 2002 | 39.8° |
| 3 | 2024 | 39.8° |
| 3 | 2020 | 39.8° |
| 6 | 2023 | 39.5° |
| 7 | 1998 | 39.3° |
| 8 | 2017 | 38.0° |
| 9 | 1991 | 37.9° |
| 10 | 2022 | 37.3° |
Table 4. The ten mildest December–March periods across NJ since 1895. The year listed refers to the January–March year.
For those seeking more detailed information on 5-minute, hourly, daily, and monthly conditions, please visit the following Office of the NJ State Climatologist's websites:
Rutgers NJ Weather Network
NJ Community Collaborative Rain, Hail and Snow Network
NJ Snow Event Reports
Interested in receiving our monthly summaries at the end of each month? Send us your e-mail address here to join the mailing list.
Past News Stories

