A Little of This, a Little of That: May 2024
Mild and Damp: Spring 2024
New Jersey State Climatologist
Center for Environmental Prediction, School of Environmental and Biological Sciences/NJAES
Rutgers University
June 7, 2024
May Overview
As spring turns to summer, all in Jersey can be pleased that water supplies are in good shape. Also, while it took some time to become established, by late May, warmer temperatures brought out summer wardrobes. Spring (March–May) conditions will be covered later in this report, but first a look at May. As the title of the monthly portion of this narrative suggests, May 2024 never established a consistent atmospheric pattern. There were plenty of episodes where light to moderate showers dotted the state, but never a broad soaker. Temperatures fluctuated on a weekly basis, without a persistent leaning until warmth prevailed later in the month. Put it all together and May ended on a green note born of somewhat below-normal precipitation and above-normal temperatures. The statewide average temperature of 63.9° was 2.7° above the 1991–2020 normal. This ranks as the 11th mildest May dating back to 1895 (Table 1). This anomaly was driven by elevated minimum temperatures that averaged 54.0° which is 3.8° above normal and ranks as the 4th warmest on record. This no doubt due to persistent nighttime cloud cover. The average high temperature of 73.7° was 1.4° above normal, ranking 35th warmest. The northern climate division averaged 63.0° (+3.1°, 7th warmest). Across the southern division the average temperature was 64.5° (+2.3°, 13th warmest). The coastal division averaged 63.1° (+2.1°, 11th warmest).
| Rank | Year | May Avg. Temp. |
| 1 | 2015 | 66.1° |
| 2 | 2004 | 66.0° |
| 2 | 1991 | 66.0° |
| 4 | 2018 | 65.2° |
| 5 | 2012 | 65.1° |
| 6 | 1944 | 64.6° |
| 7 | 2010 | 64.0° |
| 7 | 1965 | 64.0° |
| 7 | 1918 | 64.0° |
| 7 | 1896 | 64.0° |
| 11 | 2024 | 63.9° |
| 12 | 2011 | 63.7° |
| 13 | 1911 | 63.5° |
| 14 | 1942 | 63.4° |
| 15 | 1998 | 63.3° |
| 15 | 1959 | 63.3° |
Table 1. The 16 mildest Mays across NJ since 1895.
While rain fell somewhere in NJ on more than half of days, the statewide average rainfall for May was only 3.27”. This was 0.48” below normal and ranks as the 55th driest of the past 130 Mays (Figure 1). The north was far wetter than the south, averaging 4.35” (+0.33”, 79th driest/52nd wettest). The south averaged 2.59” (-1.01”, 39th driest). The coast averaged 2.72” (-0.79”, 46th driest).
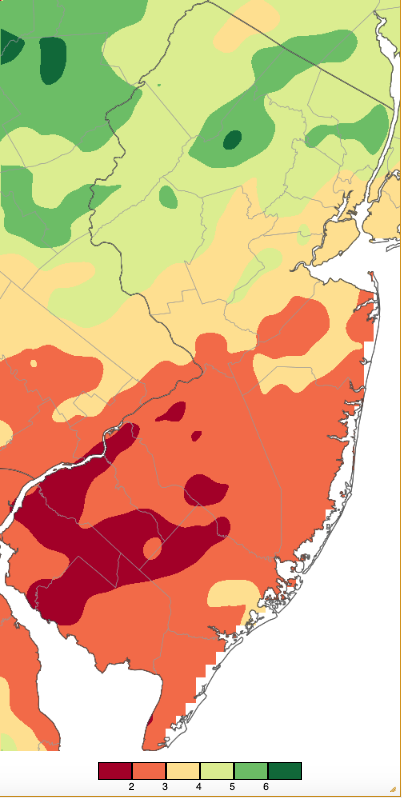
Figure 1. May 2024 precipitation across New Jersey based on a PRISM (Oregon State University) analysis generated using NWS Cooperative, CoCoRaHS, NJWxNet, and other professional weather station observations from 8 AM on April 30th to 8 AM on May 31st. Note the scale in inches at the bottom of the map. Totals range from 1.00”–1.99” (dark red) to 6.00”–6.99” (dark green).
Temperature
Warmth prevailed early and late in the month. Nine afternoons found high temperatures of 85° or higher at one or more of the 68 Rutgers NJ Weather Network (NJWxNet) stations. Three of these came early in the month, beginning on the 2nd when Sicklerville (Camden County) rose to 91°, four other stations hit 90°, and 41 NJWxNet sites topped out from 85°–89° (Figure 2). Meanwhile, West Cape May (Cape May) only made it to 68°.
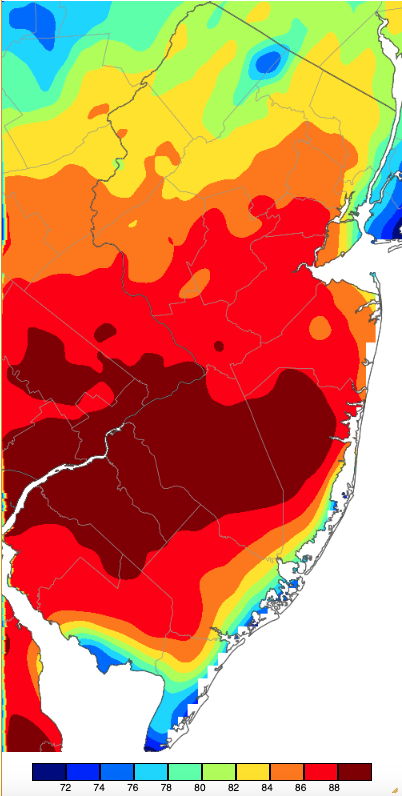
Figure 2. Maximum temperatures on May 2nd based on a PRISM (Oregon State University) analysis generated using NWS, NJWxNet, and other professional weather stations. Note the 2-degree scale beneath the map.
The 7th found Sicklerville up to 85°, a prelude to the 8th when Egg Harbor Township (Atlantic) and Toms River (Ocean) each hit 89° and 51 stations reached from 85°–88° (Figure 3). The consistency of the highs across much of NJ on the 8th was impressive, with Fortescue (Cumberland) at 78° registering the coolest high.
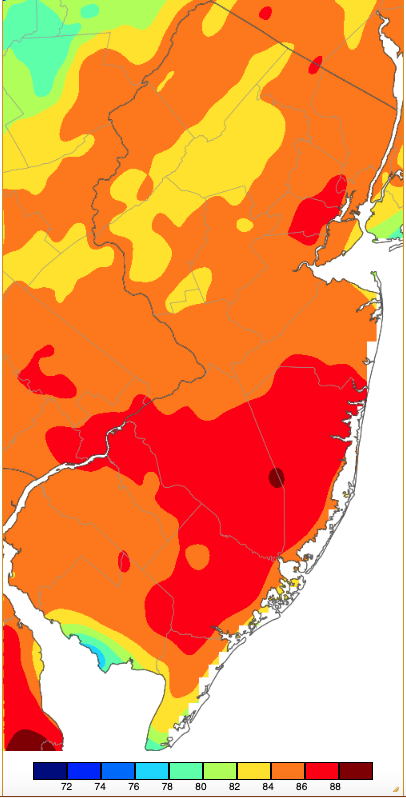
Figure 3. Maximum temperatures on May 8th based on a PRISM (Oregon State University) analysis generated using NWS, NJWxNet, and other professional weather stations.
Warmth returned on the 21st, with Little Falls (Passaic) and Sandyston (Sussex) at 88°, and 31 locations from 85°–87°. The 22nd gave the 2nd and 8th a run for their money when it came to the warmest May day. East Brunswick (Middlesex) and Fort Dix (Burlington) rose to 90° and 42 NJWxNet stations were from 85°–89° (Figure 4), while Harvey Cedars (Ocean), for the second consecutive day, only made it to 67°.
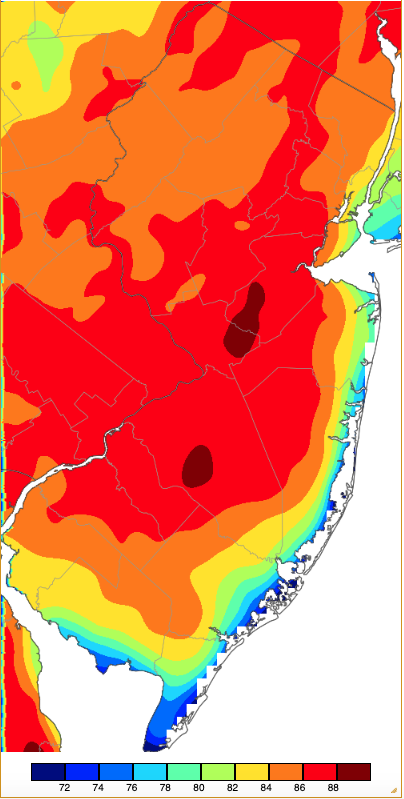
Figure 4. Maximum temperatures on May 22nd based on a PRISM (Oregon State University) analysis generated using NWS, NJWxNet, and other professional weather stations.
Ten locations reached 88° and 28 between 85°–87° on the 24th. Moorestown (Burlington), Pennsauken (Camden), and Sicklerville each hit 90° on the 25th, with 23 sites from 85°–89°. The 26th saw 89° highs at Mansfield (Burlington), Moorestown, and South Harrison (Gloucester), with 30 stations from 85°–88°. Red Lion (Burlington) topped out at 85° on the 28th.
On the cool side of the ledger, eleven days found at least one NJWxNet station with a low at or below 45°. Just a day after nearby Sicklerville reached 91°, Berkeley Township (Ocean) fell to 39°. Twenty other stations sat at 41°–45°. Berkeley Township was again coolest at 36° on the 4th, followed by Hopewell Township (Mercer) at 39° and 38 stations from 40°–45°. High Point Monument (Sussex) was 41° on the 5th with eight locations dropping to 43°–45°. Sandyston fell to 45° on the 7th.
A five-day stretch with lows below 45° began on the 10th with 42° minimums at Chester Borough (Morris), Wantage (Sussex), High Point (Sussex), and High Point Monument, and eight stations at 43°–45°. Wantage fell to 37° and Kingwood (Hunterdon) 38° on the 11th, with 51 locations from 39°–45°. The two coldest sites on the 12th were among the furthest from each other in state, with High Point Monument and Woodbine (Cape May) each 38°. Thirty-nine other sites were from 40°–45°. The 13th was the coolest May morning, particularly in the south, where Woodbine reached 34°, Berkeley Township and Mullica (Atlantic) were each 35°, 22 stations were from 36°–40°, and 34 sites from 41°–45° (Figure 5). Lyndhurst (Bergen) was mildest at 50°. The 14th found Berkeley Township and Hopewell Township at 42°, with eight stations down to 43°–45°.
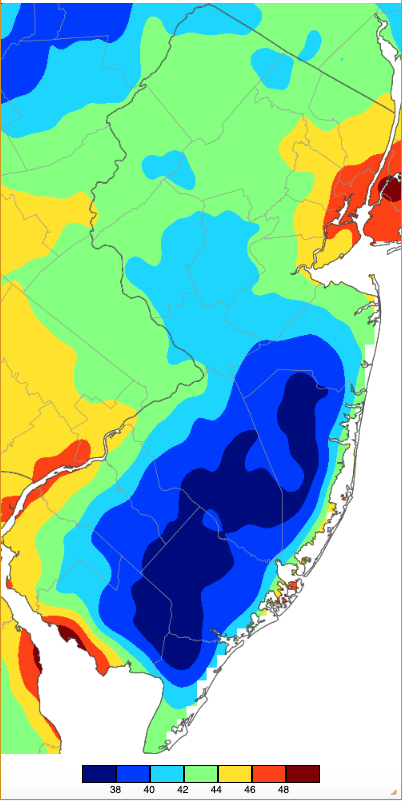
Figure 5. Minimum temperatures on May 13th based on a PRISM (Oregon State University) analysis generated using NWS, NJWxNet, and other professional weather stations.
At month’s end, Walpack (Sussex) fell to 45° on the 30th and 41° on the 31st, on the latter date joined by Pequest (Warren) at 42°, Sandyston 43°, and three locations 45°.
A sea breeze can be a rather pronounced coastal phenomenon in spring when still cold ocean waters chill the overlying air. As daytime temperatures warm inland rising air helps to usher this ocean cooled air inland. This was quite evident during the early afternoon of the 22nd, with Harvey Cedars at 64° and several inland stations up to 87° (Figure 6). Not only did the sea breeze occur in NJ, as a region-wide map shows it extending from southern New England southward to the Delmarva Peninsula (Figure 7).
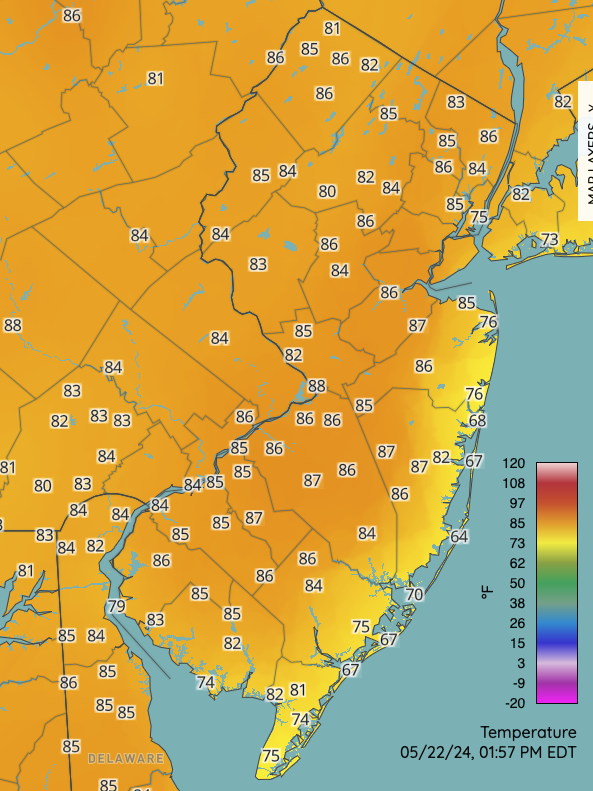
Figure 6. Air temperatures at 1:57 PM EDT on May 22nd. Observations are from NJWxNet, National Weather Service, and Delaware Environmental Observing System stations.
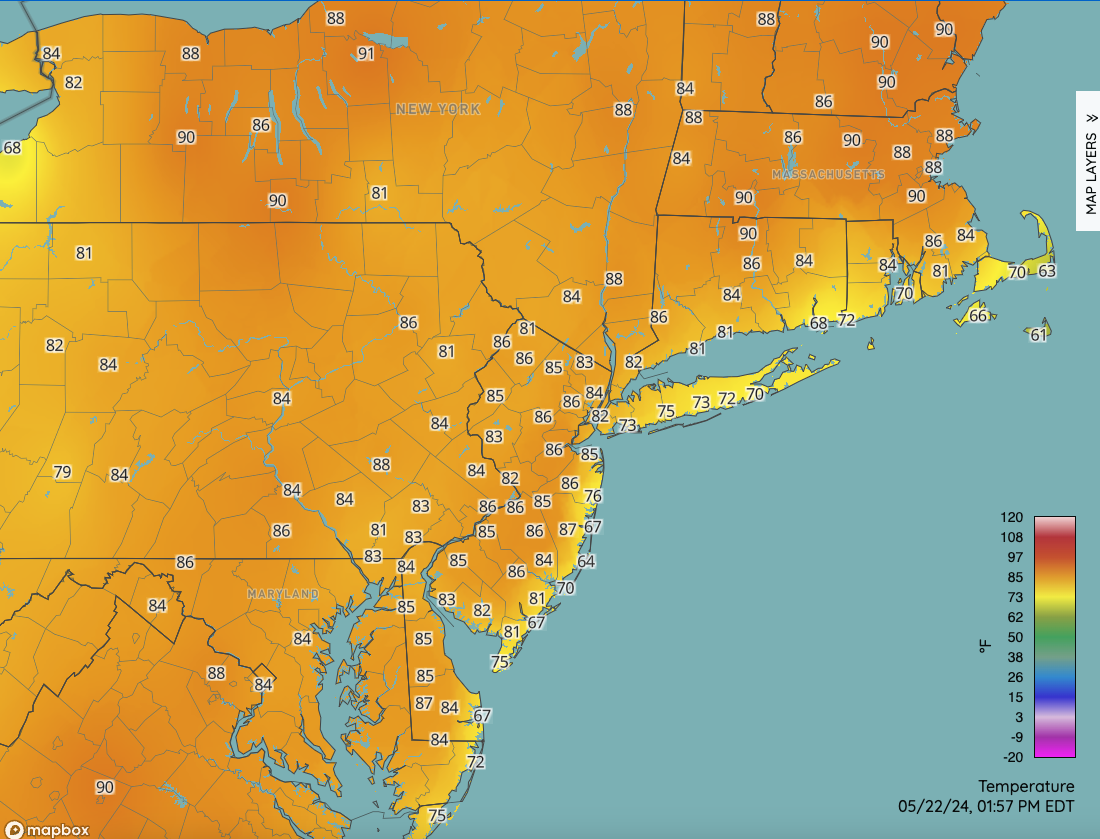
Figure 7. Regional air temperatures at 1:57 PM EDT on May 22nd. Observations are from NJWxNet, National Weather Service, and Delaware Environmental Observing System stations.
A sea breeze is not a guaranteed occurrence on a spring afternoon. On the 28th, northwesterly winds were rather strong and persistent throughout the day. This kept a sea breeze at bay, with locations at the coast as mild as most low-elevation inland spots and milder than the higher elevations to the northwest (Figure 8).
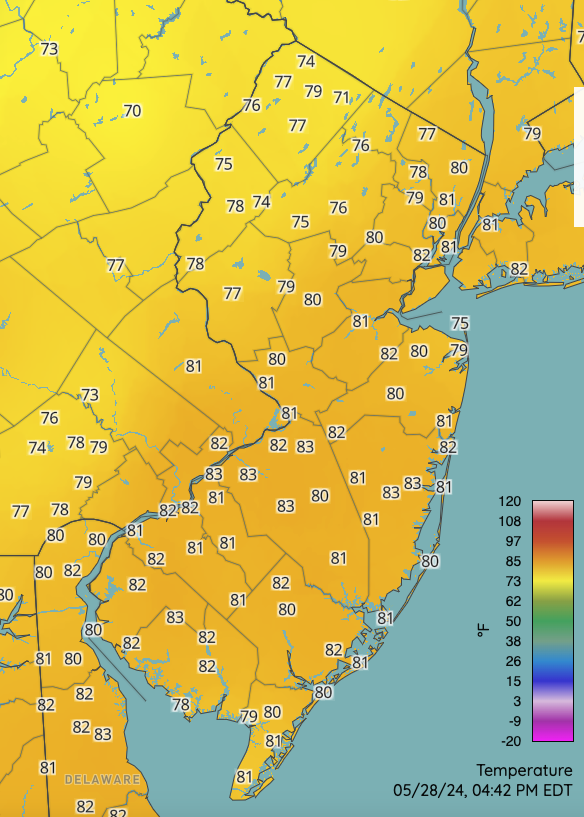
Figure 8. Air temperatures at 4:42 PM EDT on May 28th. Observations are from NJWxNet, National Weather Service, and Delaware Environmental Observing System stations.
Precipitation and Storms
There were eleven rain episodes in May, which would seemingly suggest that it was quite a wet month. However, this was not the case, as events were often quite local and only five events saw a gauge somewhere in NJ catch more than an inch, three of them just barely so. There were some areas, particularly the Highlands (see Figure 1), that received above-normal rainfall, while the southern half of the state caught quite a bit less than normal. The Community Collaborative Rain, Hail, and Snow Network (CoCoRaHS) station finishing on top was Mine Hill Township (Morris) with 7.07”, followed by Mount Arlington (Morris) 6.38”, Vernon Township (Sussex) 6.34”, Denville (Morris) 5.87”, and Jefferson Township (Morris) 5.70”. The driest locations included Franklin Township (Gloucester) 1.34”, Winslow Township (Camden) and Upper Deerfield (Cumberland) each with 1.68”, two Monroe Township (Gloucester) stations with 1.73” and 1.75”, Willingboro (Burlington) 1.80”, and Buena Vista (Atlantic) 1.83”.
A recap of all events that deposited close to 0.50” or higher somewhere in the state follows. The first began late on April 30th continuing into the early hours of the 1st. Mine Hill Township caught 0.64” and Hackettstown (Warren) 0.60”. Next up, Mount Olive Township (Morris) reached 0.50” during the daytime hours of the 4th into early on the 5th. Later on the 5th into early the 6th, Newton (Sussex) received 0.84”, Stillwater (Sussex) 0.65”, and Springfield (Union) 0.61”. Afternoon showers and thunderstorms on the 7th ended during the morning of the 8th, with River Edge (Bergen) the top spot at 0.48”.
Rain moved into NJ during the evening of the 9th, not ending until late afternoon on the 10th. Again, northern areas received the most rain, with two Franklin Township (Hunterdon) stations at 1.01” and 1.00”, Vernon Township 0.94”, and 122 of 261 CoCoRaHS stations from 0.50”–0.93”. Late-day showers on the 11th continued into the afternoon of the 12th, leaving Manasquan (Monmouth), Chatham (Morris), and Clark (Union) all with 0.57”. Late-afternoon rain on the 14th continued into the afternoon of the 15th. Despite the duration of the event and all corners of NJ receiving at least 0.25”, the most that accumulated was 1.06” at Bloomingdale (Passaic), with 0.94” in Galloway Township (Atlantic), 0.90” at Ventnor City (Atlantic), and 0.89” in Tenafly (Bergen). Winds gusted to 44 mph at Atlantic City Marina (Atlantic) and 42 mph in Little Egg Harbor Township (Ocean) on the 15th.
Squalls moved through northern and central Jersey from pre-dawn hours until mid-morning on the 23rd. Two Vernon Township stations caught 1.22” and 1.19”, Hackettstown 1.18”, Southampton (Burlington) 1.00”, and 103 of 266 CoCoRaHS stations received 0.50”–0.99”. Wind gusts accompanying the storms reached 59 mph at Cream Ridge (Monmouth), Stewartsville (Warren) 45 mph, Vernon Township 40 mph, and Pittstown (Hunterdon) 40 mph. Trees and power lines went down in a number of locations across the northern half of the state. Evening showers on the 25th ended early on the 26th, depositing 0.81” at Evesham (Burlington), 0.74” at both Ventnor City and Egg Harbor Township, and 0.73” in Ewing Township (Mercer).
The most locally prolific rain event of May began early on the 27th with showers in the southeast before moving statewide into the afternoon. Roxbury Township (Morris) caught the most with 2.67” followed by Mine Hill Township 2.10”, Hamilton (Atlantic) 2.02”, and Mount Arlington 1.98” (Figure 9). Of 248 CoCoRaHS reports, 46 were from 1.00”–1.68” and 76 from 0.50”–0.99”, leaving well over half the state under 0.50”. Vernon Township received a gust of 40 mph.
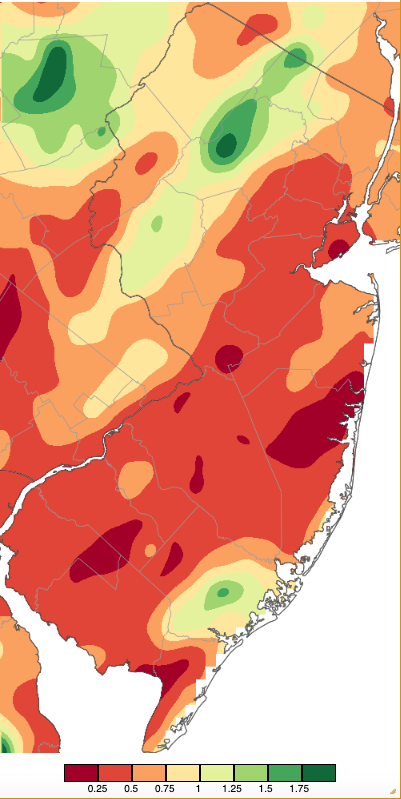
Figure 9. Precipitation across New Jersey from 8 AM on May 26th through 8 AM May 28th based on a PRISM (Oregon State University) analysis generated using NWS Cooperative, CoCoRaHS, NJWxNet, and other professional weather station observations.
The final event of May arrived on the evening of the 29th, ending before dawn on the 30th. Madison (Morris) caught 1.98”, two Little Falls stations came in with 1.79” and 1.65”, West Caldwell (Essex) 1.57”, and Palisades Park (Bergen) 1.56” (Figure 10). Twenty-eight stations saw 1.00”–1.50” and 82 from 0.50”–0.99”. Continuing the geographic theme of the month, southern areas received little to no rain.
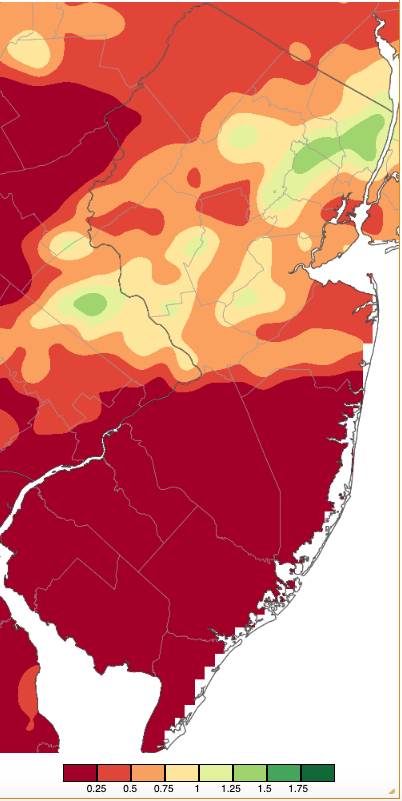
Figure 10. Precipitation across New Jersey from 8 AM on May 29th through 8 AM May 30th based on a PRISM (Oregon State University) analysis generated using NWS Cooperative, CoCoRaHS, NJWxNet, and other professional weather station observations.
The highest barometric pressures in May were not all that high, ranging from 30.25”–30.35” on the 4th and 5th. The lowest pressures were in the 29.45”–29.60” range on the 8th. The three days with 40 mph or higher gusts were mentioned earlier.
Spring OverviewMarch, April, and May all saw above-average temperatures across the Garden State, with March the 9th mildest since 1895. This persistence resulted in spring 2024 emerging tied for the 3rd mildest on record (Table 2). At 54.3°, temperatures were 3.0° above the 1991–2020 normal.
| Rank | Year | Spring Avg. Temp. |
| 1 | 2012 | 55.8° |
| 2 | 2010 | 55.2° |
| 3 | 2024 | 54.3° |
| 4 | 1921 | 54.2° |
| 5 | 1991 | 53.8° |
| 6 | 2004 | 53.6° |
| 7 | 1945 | 53.3° |
| 8 | 1977 | 53.2° |
| 9 | 1998 | 53.0° |
| 10 | 2011 | 52.9° |
Table 2. The 10 mildest springs across NJ since 1895.
Extreme minimum temperatures during spring ranged from the mid-teens to just below freezing (Figure 11). The northwest and Pinelands had the coldest minimums, with urban and coastal locations having the mildest spring minimum temperature.
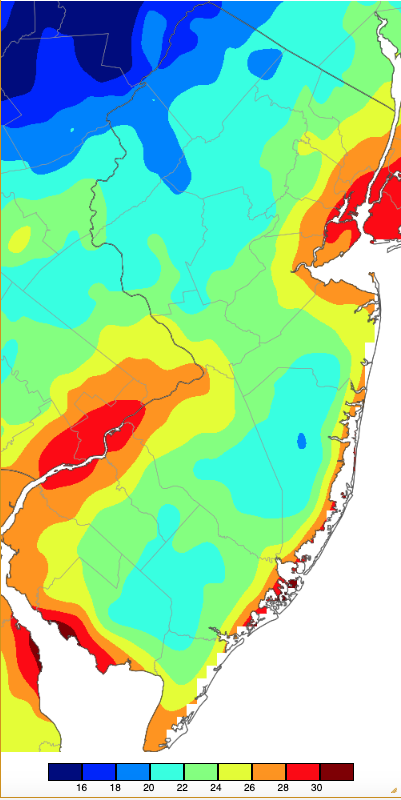
Figure 11. Extreme minimum temperatures during spring 2024 based on a PRISM (Oregon State University) analysis generated using NWS, NJWxNet, and other professional weather stations. The seasonal minimum occurred on different days at different locations.
The warmest spring maximum temperatures ranged from the upper 70°s to just over 90° (Figure 12). Coastal locations were on the low end with higher elevations and the northeast having warmest highs in the mid 80°s. The warmest maximums, in the high 80°s to near 90°, occurred from the southwest into some central areas.
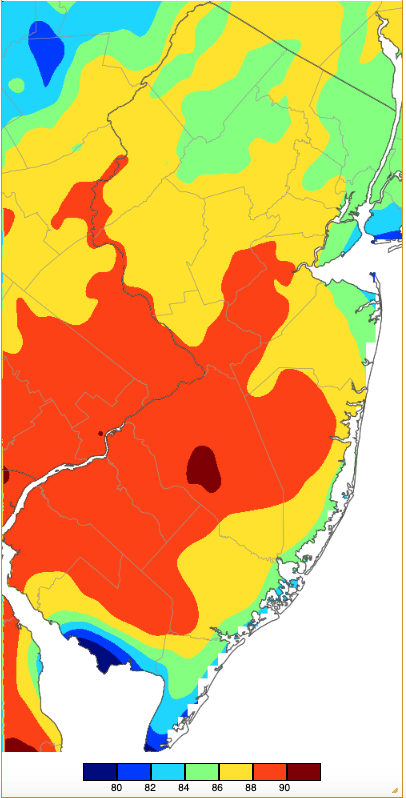
Figure 12. Extreme maximum temperatures during spring 2024 based on a PRISM (Oregon State University) analysis generated using NWS, NJWxNet, and other professional weather stations. The seasonal maximum occurred on different days at different locations.
Spring precipitation was well above normal, with the average state total of 15.17” coming in at 3.52” above normal and ranking 13th wettest (Figure 13). This anomaly was mostly the result of the 3rd wettest March on record, with April and May falling within an inch of either side of normal. The Highlands received the most precipitation, running as high as 22.27” at Mine Hill Township (Morris County), followed by Mount Arlington (Morris) 21.59”, Jefferson Township (Morris) 20.62” and 19.48” (two stations), Denville (Morris) 20.53” and 19.61” (two stations), and Vernon Township (Sussex) 20.12”. Southwest and far-south locations were driest, though still above normal. The lowest totals were 13.19” in Lower Township (Cape May), Franklin Township (Gloucester) 13.50”, Upper Deerfield (Cumberland) 13.57”, Woodstown (Salem) 14.00”, and Pitman (Gloucester) 14.35”.
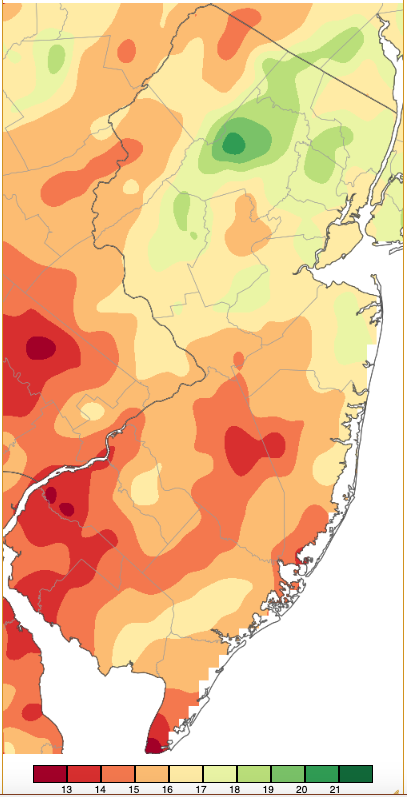
Figure 13. Spring 2024 (March 1st–May 31st) precipitation across New Jersey based on a PRISM (Oregon State University) analysis generated using NWS Cooperative and CoCoRaHS observations. Note the scale in full inches at the bottom of the map. Totals range from 12.00”–12.99” (dark red) to 21.00”–21.99” (dark green).
Spring snowfall was quite meager, with only three locations with complete records coming in over an inch. This includes Vernon Township 2.4”, Sparta (Sussex) 1.9”, and Jefferson Township 1.3”.
For those seeking more detailed information on 5-minute, hourly, daily, and monthly conditions, please visit the following Office of the NJ State Climatologist's websites:
Rutgers NJ Weather Network
NJ Community Collaborative Rain, Hail and Snow Network
NJ Snow Event Reports
Interested in receiving our monthly summaries at the end of each month? Send us your e-mail address here to join the mailing list.
Past News Stories

