A Tale of Two Novembers, and Leaning Warmer and Wetter Than Normal:
November and Fall 2022 Recap
New Jersey State Climatologist
Center for Environmental Prediction, School of Environmental and Biological Sciences/NJAES
Rutgers University
December 9, 2022
November Overview
Last month’s report spoke of how “classic” the weather was during October. November’s weather could be classified as being anything but such. The month began with perhaps the warmest first ten days of November on record in the Garden State, an interval that ranked up there with early November 2020. Then came winter-like temperatures for about ten days leading up to Thanksgiving before the month ended on a closer-to-normal note. There were only two mid-month events that brought more than an inch of rain to parts of the state, one associated with the remnants of a late-season hurricane that struck Florida. Portions of central and northern NJ saw the first snowflakes of the season during the cold spell, though aside from some minor accumulations at higher elevations, mostly traces were observed.
With the ups and downs of temperature, November came out averaging 47.5° for the state as a whole. This is 2.4° above the 1991–2020 normal and ties as the 15th mildest eleventh month on record (Table 1). Ten of the twenty mildest Novembers since 1895 have occurred since 2001. The statewide average high temperature of 58.1° was 3.4° above normal, ranking 10th mildest. The average low of 36.9° was 1.4° above normal, ranking 20th mildest. North Jersey averaged 45.2° (+2.1, 15th mildest), south Jersey 48.7° (+2.4°, 17th mildest), and the Jersey coast 50.0° (+2.7°, 13th mildest).
| Rank | Year | Nov. Avg. Temp. |
| 1 | 2015 | 49.7° |
| 2 | 2006 | 49.6° |
| 3 | 2020 | 49.2° |
| 3 | 2009 | 49.2° |
| 5 | 2011 | 48.9° |
| 5 | 1975 | 48.9° |
| 7 | 2001 | 48.8° |
| 8 | 1931 | 48.7° |
| 9 | 1999 | 48.6° |
| 9 | 1994 | 48.6° |
| 11 | 2003 | 48.5° |
| 12 | 1985 | 48.3° |
| 13 | 1948 | 48.2° |
| 14 | 1979 | 47.9° |
| 15 | 2022 | 47.5° |
| 15 | 1902 | 47.5° |
| 17 | 2005 | 47.4° |
| 18 | 1963 | 47.2° |
| 19 | 2016 | 46.7° |
| 19 | 1946 | 46.7° |
Table 1. The 20 mildest Novembers across NJ since 1895.
Statewide precipitation averaged 3.08”, which is 0.28” below normal and ranks as the 63rd driest (66th wettest) on record. The north averaged 2.98” (-0.28”, 63rd driest), south 3.14” (-0.15”, 71st driest), and coast 3.14” (-0.20”, 68th driest). As the monthly map shows, central and northern coastal areas were wettest, while the driest areas were scattered in the far south, central, and north (Figure 1). It must be noted that the rain falling during the second half of the 30th is not included in the monthly totals for the state, regions, or individual stations presented later in the report. By convention, the reporting day for most National Weather Service (NWS) Cooperative and Community Collaborative Rain, Hail, and Snow Network (CoCoRaHS) stations used in this report ends at morning observation time on the last day of the month. Totals from the afternoon of the 30th, to be included in December totals, ranged as high as about an inch, though mainly 0.25”–1.00”.
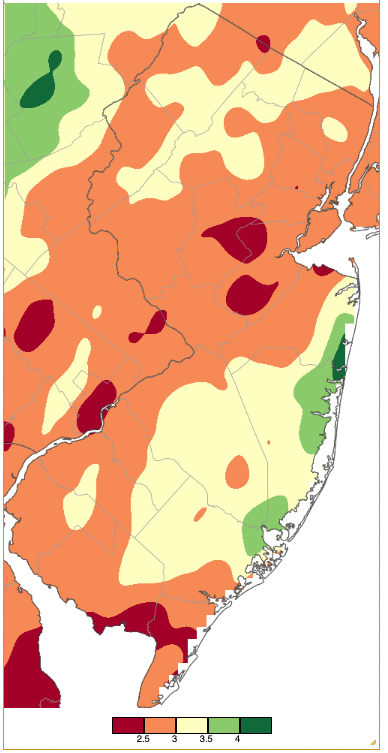
Figure 1. November 2022 precipitation across New Jersey based on a PRISM (Oregon State University) analysis generated using NWS Cooperative and CoCoRaHS observations from 8 AM on October 31st to 8 AM on November 30th. Note the scale in full inches at the bottom of the map. Totals range from 2.00–2.50” (dark red) to 4.00”-4.50” (dark green).
Temperature
The warmth of early November was immediately felt on the 1st when Woodbine (Cape May County) reached 74° and 28 of the 66 Rutgers NJ Weather Network (NJWxNet) stations topped out from 70°–73°. Similar to the 1st, the 2nd found Basking Ridge (Somerset) up to 74° and 46 NJWxNet stations from 70°–73°. Six stations reached 72° on the 3rd. Upper 70°s to low 80°s ruled for the next four days. Piney Hollow (Gloucester) got to 78° and 52 stations had highs ranging from 70°–76° on the 4th. Walpack (Sussex) began the 4th at 31°, later to rise to 72°. The 5th found 12 stations maxing out at 80°, 39 from 75°–79°, and 14 from 70°–74°. Howell (Monmouth), Hammonton (Atlantic), and Vineland (Cumberland) reached 80° on the 6th, with 34 sites from 75°–79° and 16 from 70°–74°. The “warm wave” climaxed on the 7th when Woodbine made it to 82°, 16 stations were either 80° or 81°, 40 from 75°–79°, and 11 from 70°–74°. High Point Monument (HPM; Sussex) was coolest at 67° (Figure 2).
The maximums on the 7th had a record-breaking “launch pad” due to record high minimum temperatures the morning of the 7th that were accompanied by high humidity levels. Figures 3 and 4 show the warm overnight temperatures from the 6th into the 7th and the steady high dew point temperatures. Figure 3 begins earlier on the 6th, showing the warmth of the daytime temperature at Woodbine in the far south. The Figure 4 time series ends around noon on the 7th showing the rapid decline in dew point at northern NJ High Point (Sussex) during the mid/late morning. The minimum of 66° at New Brunswick (Middlesex) on the morning of the 7th was a record high minimum for all of November, dating back to 1912. In fact, it was the warmest for so late in the season after October 20, 1916. At the NWS Atlantic City Airport station in Pomona (Atlantic), the 65° low on the 6th was the highest for so late in the season. During the afternoon of the 7th, while air temperatures rose to high values, the dew point plummeted further in the north, reaching 23° at High Point at 3:20 PM (Figure 5). Drier air had already begun to reach the far south, though dew points were still in the low 50°s. The maximum of 81° at the Atlantic City Airport on the 7th was the highest on record for so late in the year, with records back to the 1950s. More impressive was the 80° high at Atlantic City Marina (Atlantic) on the 7th. This was the highest so late in the season and tied the monthly high set twice previously on the 1st in 1950 and the 3rd in 2016.
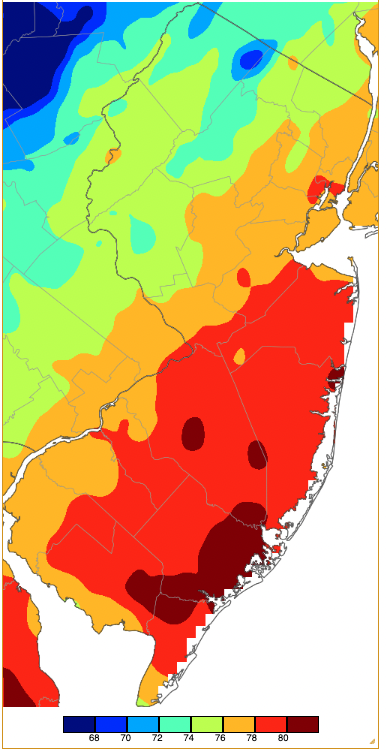
Figure 2. Maximum temperatures on November 7th based on a PRISM (Oregon State University) analysis generated using NWS, NJWxNet, and other professional weather stations. Note the 2-degree increment scale beneath the map.
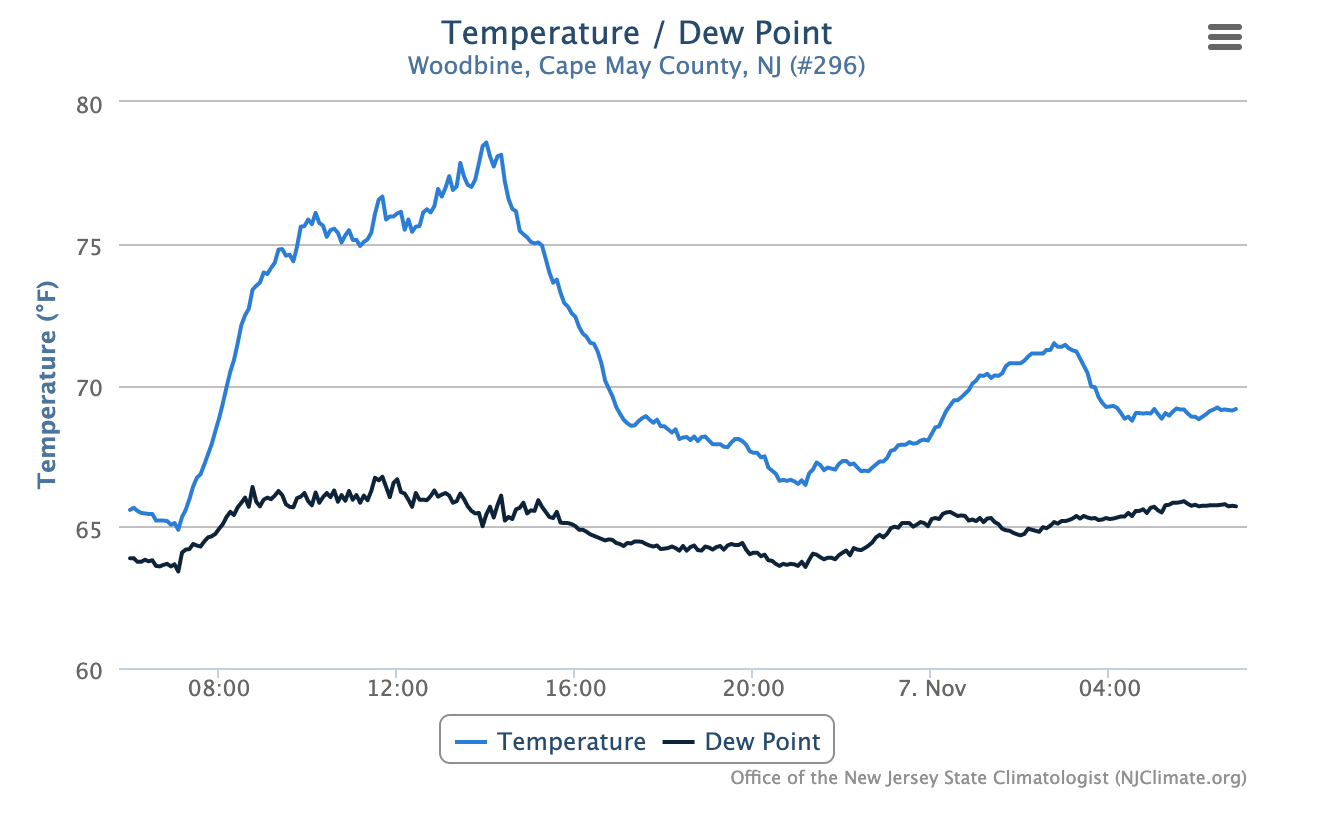
Figure 3. Time series of temperature and dew at the Woodbine NJWxNet station from 6:50 AM on November 6th to 6:50 AM on November 7.
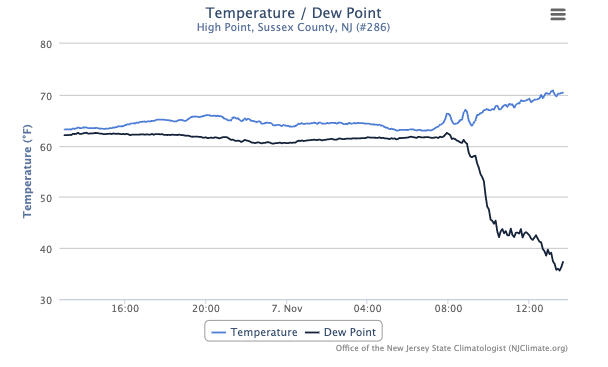
Figure 4. Time series of temperature and dew at the High Point NJWxNet station from 1:40 PM on November 6th to 1:40 PM on November 7.
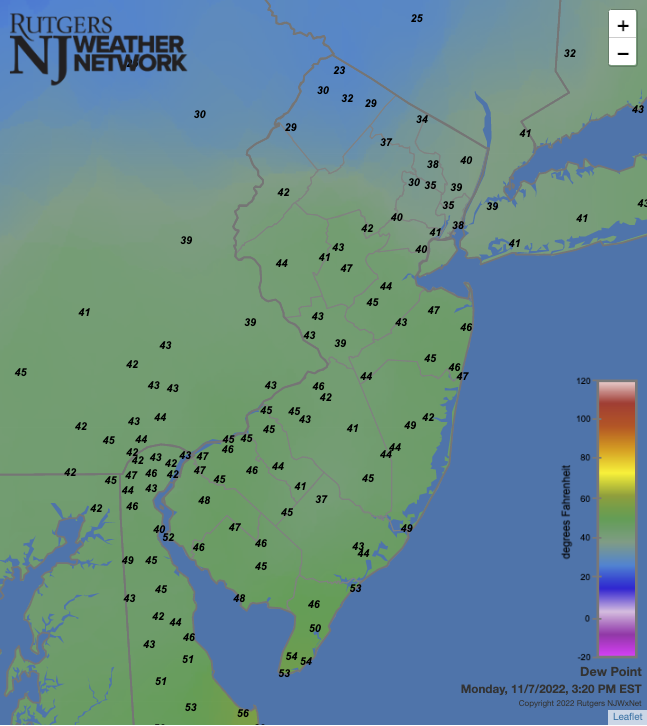
Figure 5. Surface dew point temperatures at 3:20 PM on November 7th. Observations are from automated Rutgers NJ Weather Network, National Weather Service airport stations, Shrewsbury Weather Network, and Delaware Environmental Observing System Network weather stations.
High temperatures again rose to 70° or higher on the 10th when Piney Hollow reached 74°, on the 11th with three stations at 72°, and lastly on the 12th with Little Egg Harbor Township (LEHT; Ocean) at 75° and 49 stations from 70°–74°.
There were 21 November days when the low temperature dipped below freezing at one or more NJWxNet station. However, it was not until the 15th that the first of eight days with lows of 20° or colder occurred. On the 15th, Walpack and Pequest (Warren) dropped to 19°. A seven-day string on 20° or colder days began on the 18th, with Walpack at 20°. Walpack reached 15°, Sandyston (Sussex) 17°, and ten stations from 18°–20° on the 19th, while West Cape May (Cape May) only fell to 35°.
The 20th was the first day of fall where all NJWxNet stations dropped below freezing. Hopewell Township (Mercer) and Walpack reached 16°, with 11 stations from 17°–20°. The 21st was by far the coldest day of November (Figure 6). Walpack bottomed out at 11°, Sandyston 12°, Pequest and Hopewell Township each 13°, and 34 stations from 14°–20°. Lower Alloways Creek Township (LACT; Salem) was “mildest” at 30°.
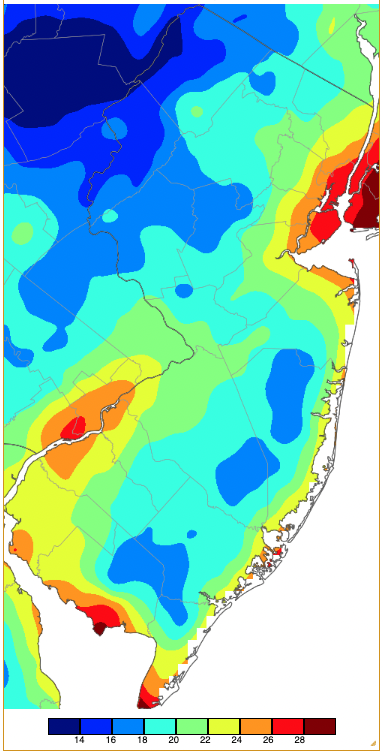
Figure 6. Minimum temperatures on November 21st based on a PRISM (Oregon State University) analysis generated using NWS, NJWxNet, and other professional weather stations. Note the 2-degree increment scale beneath the map.
The final three sub-20° nights were the 22nd with Pequest down to 18°, the 23rd with 19° at Hopewell Township, Walpack, and Pequest, and the 24th with Walpack 18° and Pequest 19°. Skies were clear and winds calm these nights, resulting in pronounced local differences in temperature around the region. A view of conditions late on the 22nd shows urban and coastal locations considerably milder than less-populated areas away from the coast (Figure 7). Also, note the higher elevation mildness compared to valley locations as dense, cold air poured off the hillsides into the lower elevations. It was 41° on hilltops in Parsippany (Morris) and Vernon Township (Sussex), and 35° at High Point, Meanwhile, it dropped down to 21° at Walpack and in the mid and upper 20°s south into the Pine Barrens.
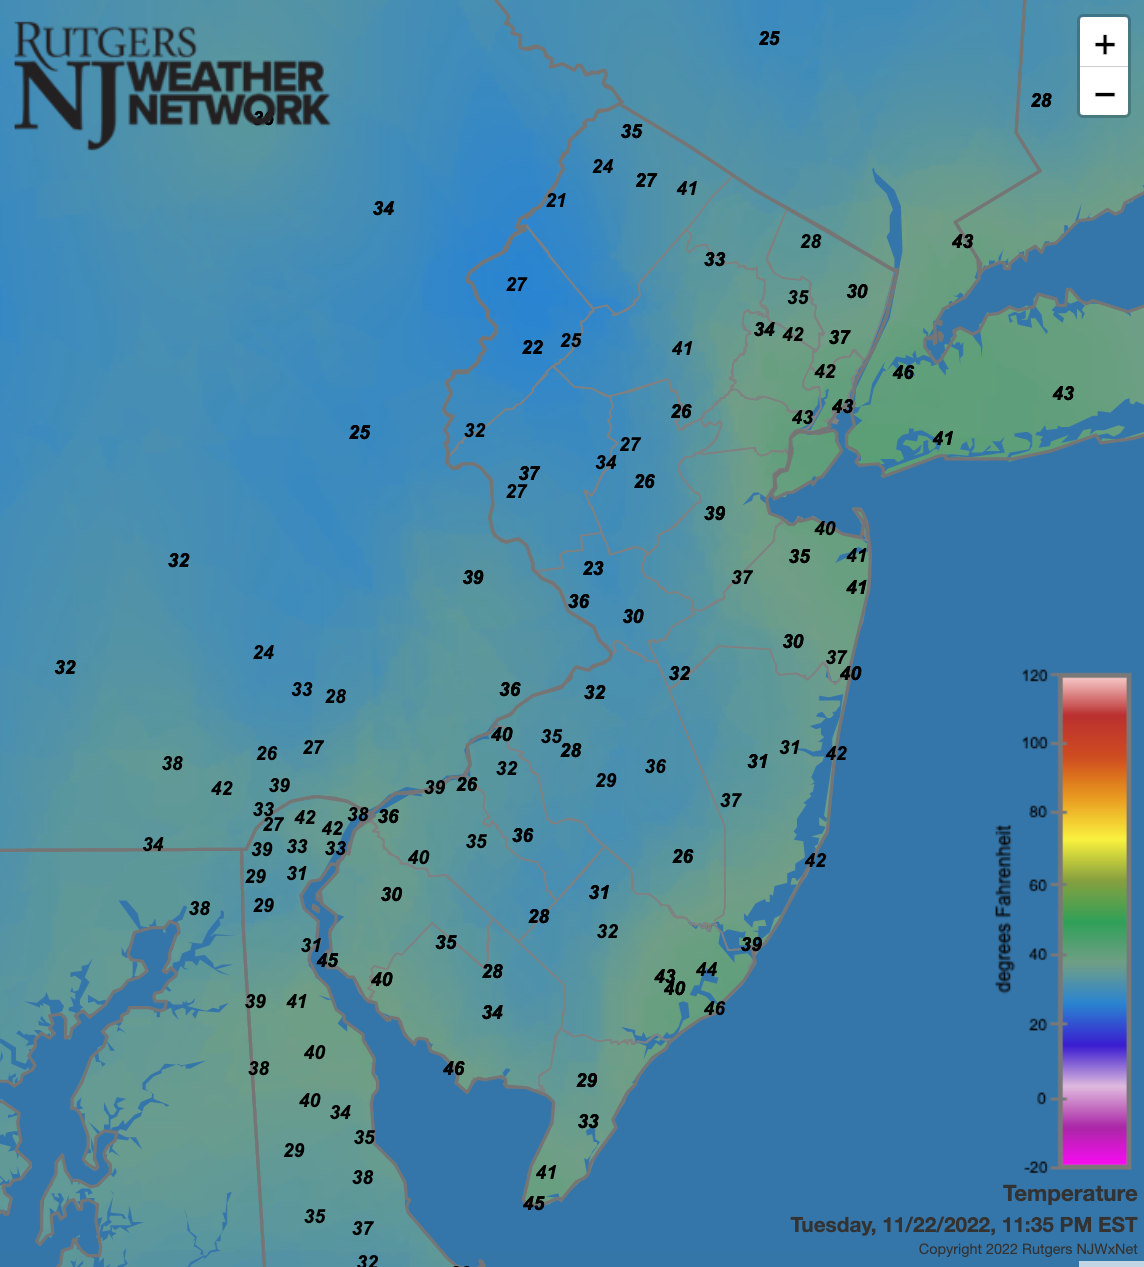
Figure 7. Surface air temperatures across NJ and nearby states at 11:35 PM on November 22nd. Observations are from automated Rutgers NJ Weather Network, National Weather Service airport stations, Shrewsbury Weather Network, and Delaware Environmental Observing System Network weather stations.
Atlantic City Marina and LEHT were the last NJWxNet stations to reach the freezing mark this fall, each making it on the 20th. This ended the growing season for all of NJ, although that had occurred much earlier at Walpack and Sandyston, each with a freeze on October 8th. There were 149 days of above freezing weather at these two locations between their last freezes of spring on May 11th and the October 8th freezes. This resulted in an 85-day shorter growing season than at Atlantic City Marina and LEHT, which each had their last freeze on March 30th, resulting in a 234-day growing season. This is not uncommon from year to year but the difference across NJ is always impressive.
Precipitation and Storms
The ample rains of October did not materialize in November, yet still enough fell to keep NJ from sliding back toward wide-spread drought conditions. The coastal wetness saw Wall Township (Monmouth) come in with 4.94” for November. Other wet spots included Neptune (Monmouth) 4.72”, Sea Girt (Monmouth) 4.56”, Point Pleasant Beach (Ocean) 4.54”, and Berkeley Township (Ocean) 4.21”. On the dry side, Hopewell Township saw just only 2.11”, Wildwood Crest (Cape May) 2.13”, Pennington (Mercer) 2.19”, Maplewood (Essex) 2.23”, and Long Hill Township (Morris) and New Brunswick each with 2.28”.
Rain that began on October 31st and ended early on November 1st amounted to as much as 0.75” in Manasquan (Monmouth) and 0.71” at Barnegat Light (Ocean). Nowhere in NJ totaled more than 0.21” from the 2nd to the 10th. The morning of the 11th saw rain from the remnants of Hurricane Nicole begin moving into the state from south to north. Heavy rain fell from the afternoon into the evening, especially in the north (Figure 8). Top honors went to Bloomingdale (Passaic) with 1.80”, followed by Boonton (Morris) 1.66”, Denville (Morris) 1.65”, and Parsippany-Troy Hills (Morris) 1.61”. Of 273 CoCoRaHS reports, 80 came in from 1.00”–1.80”, with the lowest total of 0.32” in Long Beach Township (Ocean).
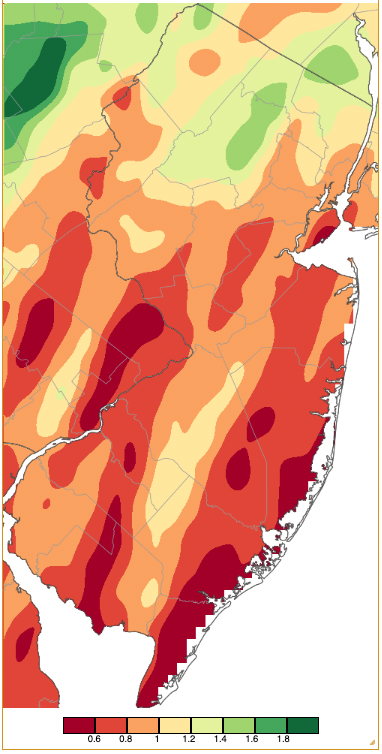
Figure 8. Precipitation across New Jersey from 8 AM on November 11th through 8 AM November 12th based on a PRISM (Oregon State University) analysis generated using NWS Cooperative and CoCoRaHS observations. Note the scale in inches beneath the map.
New Jersey did not have to wait long for the next event, as rain journeyed northward into the state during the afternoon of the 15th. It was cold enough in the evening for snow and sleet to fall in the north, particularly over the northwest hills where Wantage (Sussex) picked up 1.2” of the white stuff at a higher location and 0.5” at a lower spot. Montague (Sussex) caught 1.2”, Sparta (Sussex) 0.6”, and Vernon Township 0.5”. Rainfall totals were most impressive near the coast where Bradley Beach (Monmouth) received 2.95”, Neptune 2.87”, Point Pleasant Beach 2.82”, Manasquan 2.65”, and Wall Township 2.56” (Figure 9). Of the 282 CoCoRaHS event reports, 17 were from 2.00”–2.95” and 131 from 1.00”–1.99”. Maplewood, with 0.53”, caught the least.
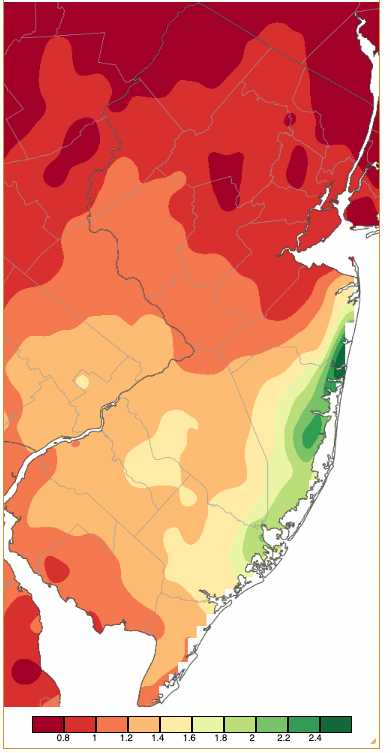
Figure 8. Precipitation across New Jersey from 8 AM on November 15th through 8 AM November 16th based on a PRISM (Oregon State University) analysis generated using NWS Cooperative and CoCoRaHS observations. Note the scale in inches beneath the map.
Another period of dry weather followed from the 16th–24th with nowhere in NJ accumulating more than 0.10”. The 27th into early on the 28th saw as much as 0.95” accumulating at North Wildwood (Cape May), 0.76”, 0.69”, and 0.64” at three Lower Township (Cape May) locations, 0.66” in Warren (Somerset), and 0.65” at both Bedminster (Somerset) and Watchung (Somerset).
At month’s end, the US Drought Monitor was little changed from the late October map (Figure 10), while the NJ Department of Environmental Protection continued to maintain a statewide drought watch. As the map shows, greatest concerns continued in the Highlands and adjacent areas, and also in the far south.
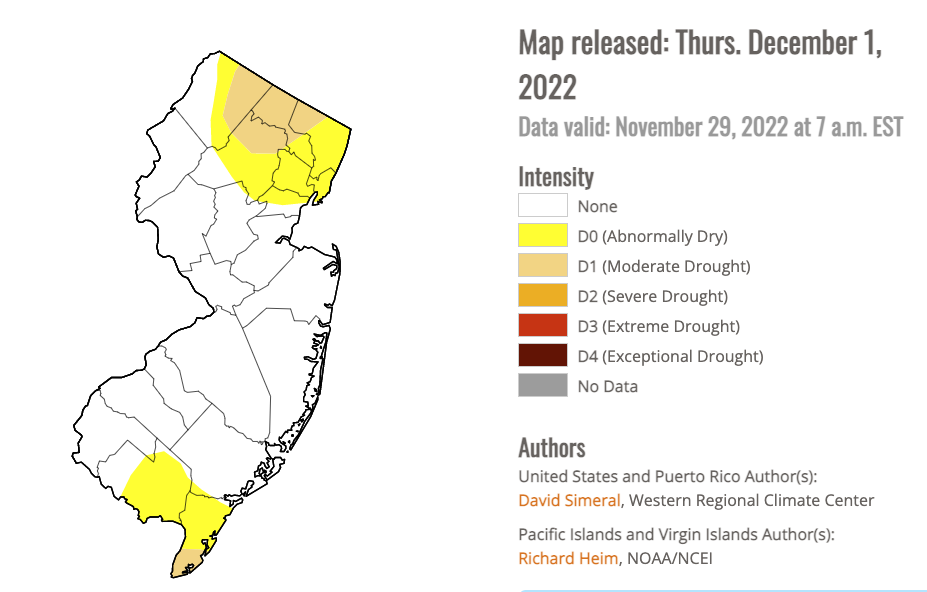
Figure 9. New Jersey portion of the U.S. Drought Monitor map for November 29th.
The highest barometric pressures of the month occurred on the 9th, ranging from 30.60”–30.70” around NJ. Lowest values were in the 29.35”–29.45” range on the 27th. Winds gusted to 40 mph or higher at one or more NJWxNet station on eleven November days. HPM started this off with a 41-mph gust on the 7th. Mannington (Salem) reached 40 mph on the 11th. HPM made it to 49 mph on the 12th, followed by LACT at 42 mph, and 40 mph at Pennsauken (Camden), Harvey Cedars (Ocean), and Atlantic City Marina. HPM reached 41 mph on the 13th and Fortescue (Cumberland) on the 17th. A windy 20th found gusts to 47 mph at HPM, Fortescue 45 mph, LACT 44 mph, LEHT 43 mph, and Pennsauken 40 mph. HPM gusted to 46 mph on the 25th and 44 mph on the 26th, LACT 41 mph on the 27th, and HPM 49 mph on the 28th. The 30th was the windiest day of the month, with HPM and Fortescue each gusting to 47 mph, Cream Ridge (Monmouth) 46 mph, LACT 45 mph, and seven NJWxNet stations at 40–44 mph.
Fall OverviewThe fall months of September, October, and November together averaged somewhat milder and wetter than normal. The average temperature of 56.3° was 0.5° above the 1991–2020 normal, tied with 2001 as the 20th warmest fall since 1895. Last year ranked 8th and, of the top 21 warmest, 12 have occurred since 2001. September averaged 67.5° (+0.6°), October 54.0° (-1.4°), and November 47.5° (+2.4°).
Fall precipitation averaged 12.62” across NJ. This is 0.91” above normal and ranks as the 33rd wettest of the past 128 falls. Ten of the wettest 33 have occurred since 2002. September averaged 3.11” (-1.05”), October 6.43” (+2.24”), and November 3.08” (-0.28”). Coastal areas north of Cape May County and also the far northwest were wettest (Figure 11). Scattered areas from the Highlands to central Jersey, to the southwest, and southern Cape May were driest. Top totals include Berkeley Township (Ocean) 18.51”, Egg Harbor Township (Atlantic) 18.44”, Wall Township (Monmouth) 18.22”, Lacey Township (Ocean) 17.90”, Galloway (Atlantic) 17.46”, and Montague (Sussex) 17.38”. Lowest accumulations include Lower Township (Cape May) 9.84”, Bernards Township (Somerset) 10.42”, Evesham (Burlington) 10.71”, Lawrence Township (Mercer) 10.79”, Middletown (Monmouth) 10.82”, and Madison (Morris) 11.08”.
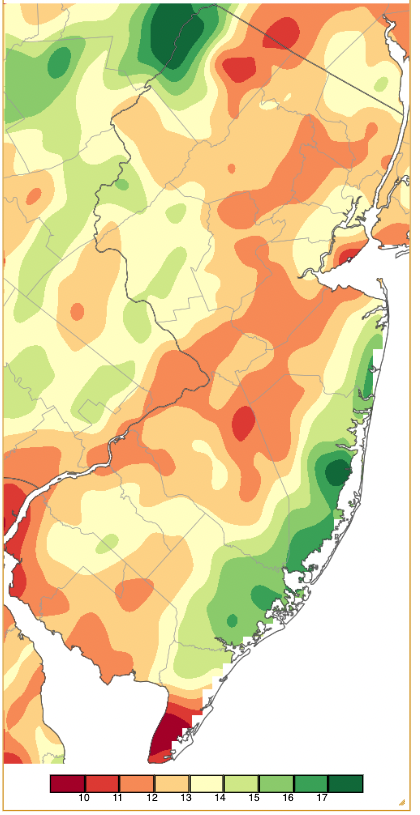
Figure 11. Precipitation across New Jersey from 8 AM on August 31st through 8 AM November 30th based on a PRISM (Oregon State University) analysis generated using NWS Cooperative and CoCoRaHS observations. Note the scale in inches beneath the map.
While New Jersey remains in a drought watch, fall rains, in particular in early October, contributed to a marked reduction of areas in various stages of drought across the state. The late-fall drought map above (Figure 10) shows the improvement over conditions in early fall (Figure 12).
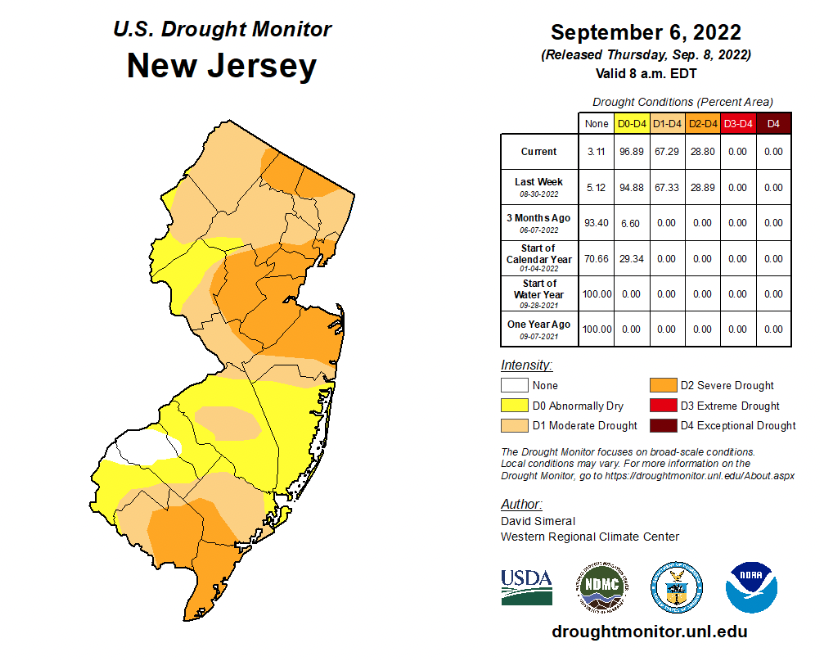
Figure 9. New Jersey portion of the U.S. Drought Monitor map for September 6th.
For those seeking more detailed information on 5-minute, hourly, daily, and monthly conditions, please visit the following Office of the NJ State Climatologist's websites:
Rutgers NJ Weather Network
NJ Community Collaborative Rain, Hail and Snow Network
NJ Snow Event Reports
Interested in receiving our monthly summaries at the end of each month? Send us your e-mail address here to join the mailing list.
Past News Stories

