Recap Triple Header
Smoke Gets In Your Skies: May 2023
Another Mild One: Spring 2023
Snow Totals: 2022/2023 Season
New Jersey State Climatologist
Center for Environmental Prediction, School of Environmental and Biological Sciences/NJAES
Rutgers University
June 7, 2023
May Overview
When the headline for this monthly report alludes to hazy May skies that were frequently overhead, you know it was a quiet period weather-wise across the Garden State. Such was the case during the middle two weeks of May and at month’s end, with smoke from wildfires in western Canada frequently passing well overhead, followed by smoke from fires in Nova Scotia and a few in NJ. Otherwise, May temperatures were cooler than normal, and rainfall sparse.
The statewide average temperature of 59.3° was 1.9° below the 1991–2020 normal. This ranked as the 52nd coolest May since 1895. It was the coolest month compared to normal since January 2022. Following the third mildest April on record, May was only 4.0° milder than the previous month. This is the third smallest temperature difference on record between these two months. The average high temperature of 71.7° was 0.6° below normal, ranking 60th warmest and 68th coolest. The average low temperature of 46.9° was 3.3° below normal, ranking 26th coolest. The northern division averaged 57.8° (-2.1°, 50th coolest), the southern division 60.3° (-1.9°, 50th coolest), and the coastal division 59.6° (-1.4°, 63rd coolest).
May precipitation averaged 2.24” across New Jersey. This was 1.51” below normal, ranking as the 22nd driest on record. The misleading nature of this value, as explained in last month’s recap and also too many times to count in earlier reports, is that most of the heavy rain reported on May 1st actually fell during the second half of April 30th. However, given morning (generally 7–8AM) observing practices at most National Weather Service Cooperative Observing (COOP) network stations as well as at Community Collaborative Rain, Hail, and Snow network stations, precipitation falling after observation time on a given day is reported during the next morning’s report (in this case the morning of the next month). Official divisional and statewide precipitation totals provided from NOAA’s National Centers for Environmental Information are largely calculated using data from these AM-reporting COOP stations, though a good number of midnight-reporting stations are also included. Thus, the official monthly total for May largely includes the heavy rain that fell on the afternoon and evening of April 30th (Figure 1). Official divisional totals for May included 2.40” in the north (-1.62”, 27th driest), 2.09” in the south (-1.51”, 24th driest), and 2.63” at the coast (-0.88”, 44th driest).
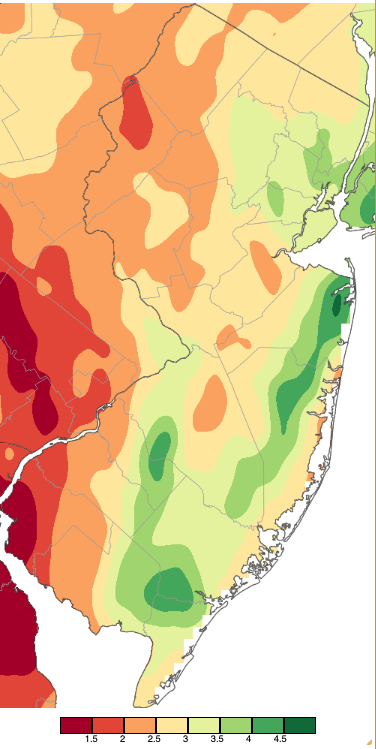
Figure 1. May 2023 precipitation across New Jersey based on a PRISM (Oregon State University) analysis generated using NWS Cooperative, CoCoRaHS, NJWxNet, and other professional weather station observations from approximately 8 AM on April 30th to 8 AM on May 31st. Note the scale in inches at the bottom of the map. Totals range from 1.00”–1.50” (dark red) to 4.50”–5.00” (dark green).
Ultimately, the May 1st rain came to dominate monthly totals, as the remainder of the month was quite dry. If the first day’s report is removed from the May 2nd–31st statewide PRISM-estimated total is 1.00” (Figure 2). This is 2.75” below the long-term May average and would have ranked as the 2nd driest on record, following behind 1903 (0.64”) and tied with 1964 (1.00”). This illustrates both how very dry the vast majority of the month was but also how fortunate the state was to have received the copious rainfall of late April. At least for the time being, this staved off drought concerns and reduced May local wildfire occurrences until the last two days of the month.
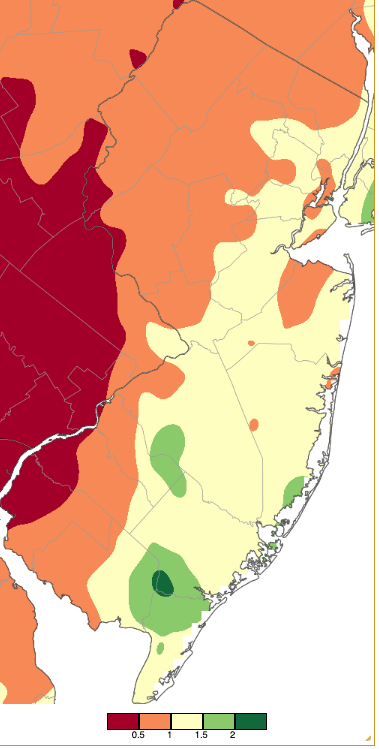
Figure 2. May 2–31, 2023, precipitation across New Jersey based on a PRISM (Oregon State University) analysis generated using NWS Cooperative, CoCoRaHS, NJWxNet, and other professional weather station observations from approximately 8 AM on May 1st to 8 AM on May 31st. Note the scale in inches at the bottom of the map. Totals range from 0.50”–1.00” (dark red) to 2.00”–2.50” (dark green).
Smoke
New Jersey is indeed fortunate that late April rain and cool May temperatures reduced the local wildfire danger until month’s end. Such was not the case in western Canada where abnormally warm temperatures, an early snowmelt, and rapidly-drying conditions resulted in numerous dangerous wildfires that lofted enormous amounts of smoke into the atmosphere. Winds aloft steered the smoke in various directions across the middle and high latitudes of North America throughout the month. Far away from the fires, the smoke was at altitudes of 20,000 feet or greater, thus there was no health hazard nor smell evident. However, skies were frequently quite hazy, with the sun bright red at sunrise and sunset as its rays scattered all but the longest visible (red) rays.
Smoke was first visible in western Canada on the 5th and was close to NJ by the 8th. From the 9th to the 24th, most days found smoke aloft somewhere in the Northeast and Mid-Atlantic, with waves of smoke from the west shifting north and south as cold and warm fronts moved through the region. Most every day found smoke somewhere across NJ. A continental view of the trail of smoke on May 16th is seen in a visible satellite image composite (Figure 3). A regional image shows smoky conditions on May 18th (Figure 4). Along the smoky path solar radiation reaching the surface was reduced, thus likely impacted temperatures, something that likely will be studied using observations and models in the days ahead. A persistent trough in eastern North America (southward dip in the jet stream) not only helped direct the smoke toward the Northeast but also explained the cooler-than-normal temperatures during most of May.
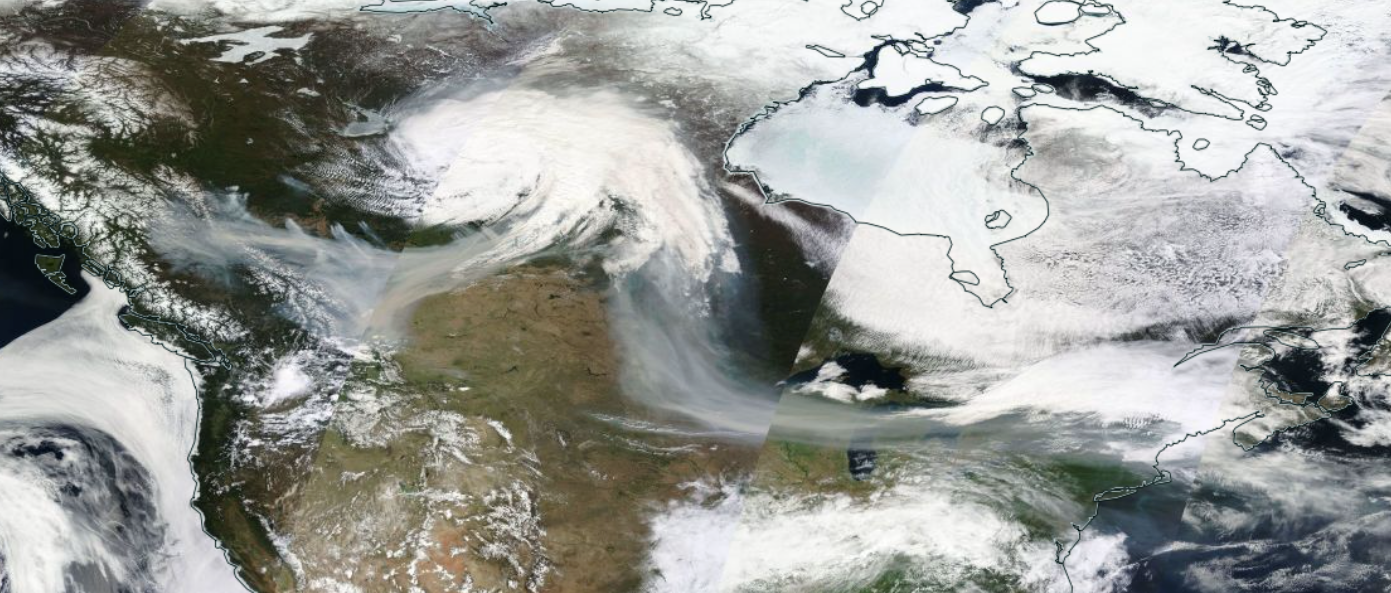
Figure 3. Visible satellite composite across North America on the morning of May 16th. Smoke (greyer than most clouds and snow-covered ground) can be seen emerging from wildfires in western Canada, being pulled into a low-pressure system to the east, and then flowing south and east by upper-level winds into the northern US Plains, across the Great Lakes and into the Northeast. (NASA MODIS imagery).
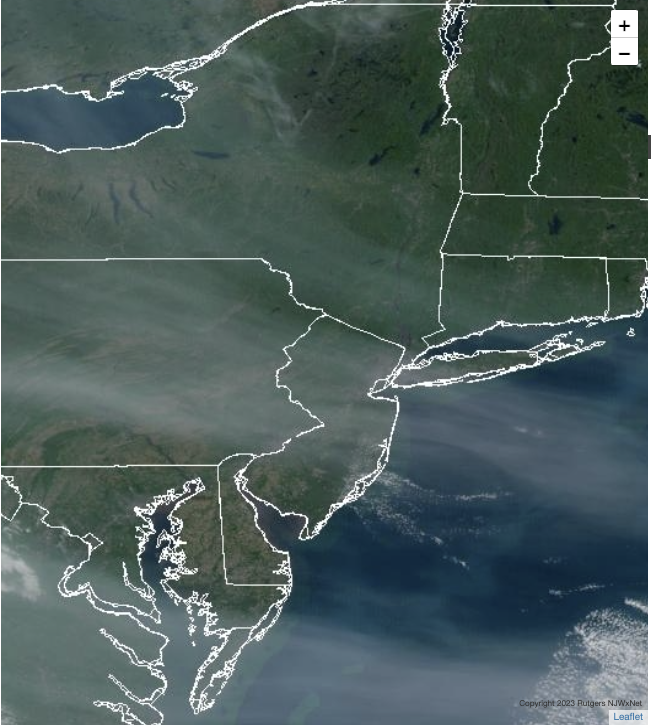
Figure 4. Smoky skies over New Jersey and surroundings at 8:36 AM on May 18th. (NOAA GOES visible satellite image).
Yet more Canadian smoke invaded the region at month’s end. This time it was eastern smoke from wildfires in Nova Scotia and New Brunswick, the result of quite dry conditions in these provinces. Given their closer proximity to New Jersey, the smoke invaded at lower altitudes than the western smoke, making for lower visibility and even some smell of smoke later on the 30th, with diminished smoke on the 31st. Finally, two fires broke out in south Jersey to end the month. The 30th found a several hundred-acre fire burning in the White Oaks Wildlife Management Area in Franklin Township/Monroe Township area (Gloucester County). The 31st saw the ignition of a fire in Bass River State Forest (Burlington) that was several hundred acres as the 31st transitioned to June 1st, destined to grow to over 3,000 acres by morning.
Temperature
Daily high temperatures reached 80° or greater on 11 May afternoons, just three more than in April. The May maximum of 89° was below the top April value of 92° (reached on two days). Hamilton (Mercer) touched 80° on the 8th to kick things off. Five stations hit 82° on the 11th. The 12th was the warmest day, with Sicklerville (Camden) reaching 89°, 46 of the 66 Rutgers NJ Weather Network (NJWxNet) stations topping off at 85°–88°, and 15 from 80°–84° (Figure 5). Nearby cool waters kept Harvey Cedars (Ocean) to a 73° high. Walpack (Sussex), at 87°, was one of the warmer locations following its statewide minimum of 42° that morning. Jersey City (Hudson) reached 84° on the 13th with 9 sites from 80°–83°. Without a cooling sea breeze in play, Point Pleasant (Ocean) and Toms River (Ocean) reached 83° on the 16th, with 36 stations tightly packed from 80°–82°. Logan Township (Gloucester), Mannington (Salem), and West Deptford (Gloucester) made it to 80° on the 22nd. Pennsauken (Camden) hit 83° on the 24th with 28 stations from 80°–82°.
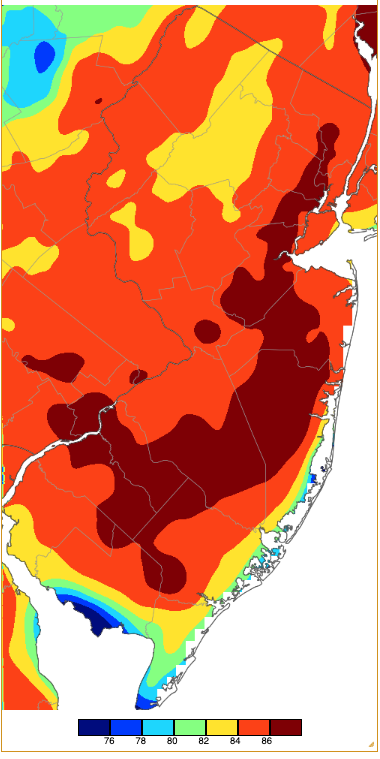
Figure 5. Maximum temperatures on May 12th based on a PRISM (Oregon State University) analysis generated using NWS, NJWxNet, and other professional weather stations. Note the 2-degree scale beneath the map.
Four of the last five days of the month saw highs eclipsing 80°. Hillsborough-Duke (Somerset) and Pequest (Warren) were 81° on the 27th. Sandyston (Sussex) was 85° on the 28th with 16 sites from 80°–84°, while Harvey Cedars only made it to 65°. Upper Deerfield (Cumberland) reached 85° on the 29th with 24 locations from 80°–84°. The 31st found Sandyston and Walpack each at 84° with 11 stations from 80°–83°, while Harvey Cedars reached just 62°.
Daily minimum temperatures at one or more NJWxNet locations fell into the 30°s on an impressive 22 mornings. Twelve of these days saw lows of 35° or colder, where the risk of frost or freeze can threaten young vegetation. The first of these was the 6th with Sandyston down to 33°. Walpack, frequently New Jersey’s coldest location on calm, clear mornings when the coldest air settles into valleys, fell to 34° on the 7th. Walpack made it to 31° on the 10th with four stations from 33°–35°. The 18th was an unusually cold mid-May morning with Walpack down to 25°, 11 NJWxNet locations 27°–32°, and 10 from 33°–35° (Figure 6). Meanwhile, Harvey Cedars only fell to 53°. Fortunately, there was no significant damage to vegetation in NJ, though notable impacts were felt in upstate New York and New England.
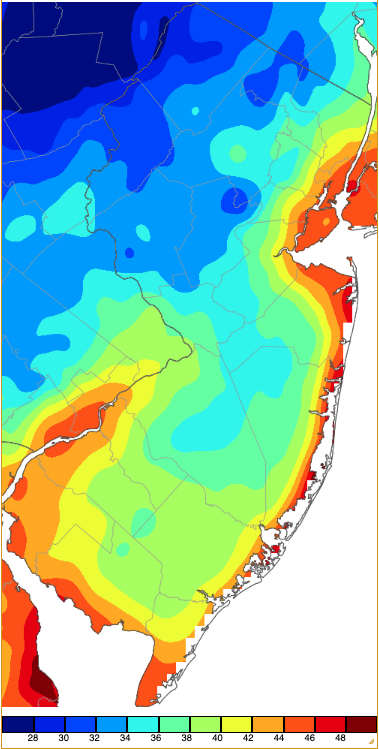
Figure 6. Minimum temperatures on May 18th based on a PRISM (Oregon State University) analysis generated using NWS, NJWxNet, and other professional weather stations. Note the 2-degree scale beneath the map.
The 19th found Berkeley Township (Ocean) in the Pinelands down to 34°. Walpack, at 32°, fell to the freezing mark or lower for the fourth May day on the 26th, while Sandyston was 35°. Walpack reached 33° and Berkeley Township 34° on the 27th, with Walpack down to 35° on the 31st.
Late-afternoon temperatures across the region on May 24th are shown in Figure 7. This was a rather typical spring distribution of temperatures in cases where an Atlantic coastal sea breeze develops. The day began with a state low of 38° at Berkeley Township and an afternoon maximum of 83° was achieved at Pennsauken (Camden). By late afternoon, coastal sites were in the low 60°s while near 80° in the lower Delaware Valley.
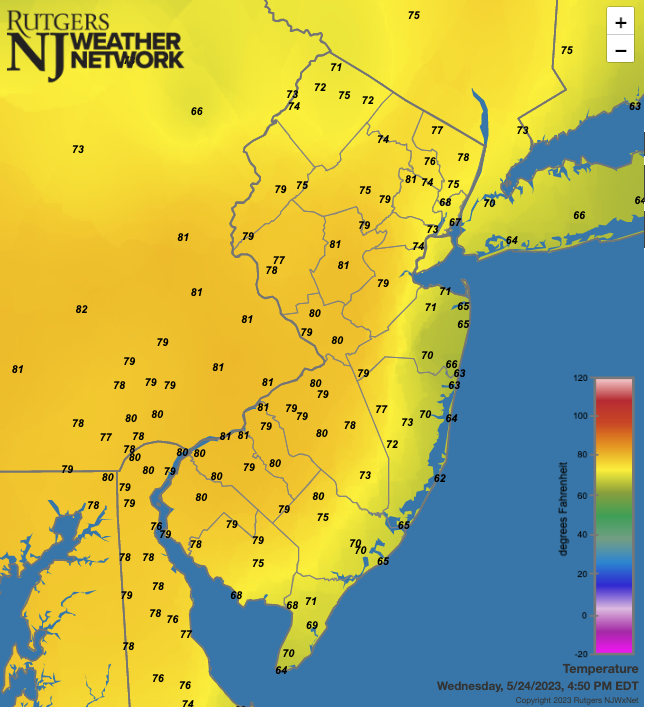
Figure 7. Temperatures on May 24th at 4:50 PM from Rutgers NJWxNet, Delaware Environment Observing System, and National Weather Service stations.
Precipitation and Storms
To start off this section of the report, again May rainfall from the morning of April 30th to the morning of May 1st will be covered, as will rainfall from the morning of May 1st through the end of the month. Rainfall totaled as much as 4.94” at Medford Lakes (Burlington), followed by Manchester Township (Ocean) 4.77”, Medford Township (Burlington) 4.74”, Little Silver (Monmouth) 4.61”, and Lakewood (Ocean) 4.58”. On the low end was Maurice River (Cumberland) 1.69”, Frelinghuysen Township (Warren) 1.92”, Upper Deerfield 2.04”, Woodstown (Salem) 2.07”, and Montague (Sussex) 2.19”.
Rainfall from the morning of May 1st until the morning of the 31st was as great as 2.45” in Estell Manor (Atlantic), Medford Lakes 2.12”, Woodbine (Cape May) 2.02”, Brigantine (Atlantic) 1.96”, and Medford Township 1.85”. The smallest totals included Frenchtown (Hunterdon) with 0.38”, Woodstown 0.43”, Phillipsburg (Warren) 0.45”, Greenwich Township (Warren) 0.46”, and Montague and Liberty Township (Warren) each at 0.47”.
The rainfall event from midday on April 30th to the predawn hours of May 1st was covered in the April report. Briefly, the largest totals included Eatontown (Monmouth) 3.62”, Manchester Township 3.38”, Lakewood 3.29”, Springfield (Union) 3.23”, Little Silver 3.20”, and Westfield (Union) 3.03”. Some 98 CoCoRaHS stations received 2.00”–2.99”, 157 sites from 1.00”–1.99”, and four from 0.74” (Barnegat Light; Ocean) to 0.98”.
Scattered afternoon and evening showers on the 5th deposited 0.75” at Medford Lakes, Medford Township 0.73”, and 0.49” at both Estell Manor and Belvidere (Warren). Hail fell in Medford Township. The 6th–19th saw a few days with scattered showers but the largest cumulative totals over this period were just 0.35” in Ocean City (Cape May), and 0.34” in both Somers Point (Atlantic) and Woodbine.
Rain moved into southern areas during the predawn hours of the 20th, moved north into the afternoon, and ended early on the 21st. Of 253 CoCoRaHS reports, the 1.58” at Brigantine was greatest followed by Long Beach Township (Ocean) 1.54”, Estell Manor 1.43”, and both Stafford Township (Ocean) and Barnegat Light 1.42” (Figure 8). Some 41 stations saw 1.00”–1.58” and 153 from 0.50”–0.99”.
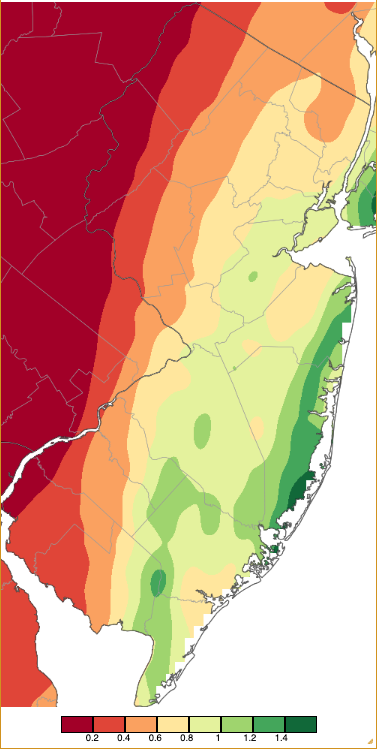
Figure 8. Precipitation across New Jersey from 8 AM on May 19th through 8 AM May 21st based on a PRISM (Oregon State University) analysis generated using NWS Cooperative, CoCoRaHS, NJWxNet, and other professional weather station observations. Note the scale in inches beneath the map.
Statewide pressures on the 1st were quite low, ranging from 29.00”–29.20”, much like on April 30th. The 1st was the only May day with a NJWxNet station recording a gust of 40 mph or greater, including a 51-mph gust at High Point Monument (Sussex) and seven stations gusting from 41–46 mph. The highest barometric pressures during May were between 30.30”–30.40”, occurring on the 18th, 19th, and 23rd.
Spring OverviewPrecipitation from March–May averaged 10.55” across New Jersey (Figure 9). This was 1.10” below normal and ranks as the 54th driest/76th driest spring since 1895. March and May dryness was largely offset by a wet April. The most spring precipitation fell at Little Silver (Monmouth) 16.37”, followed by Eatontown (Monmouth) 16.36”, Ocean Township (Monmouth) 14.96”, North Arlington (Bergen) 14.61”, and Long Branch (Monmouth) 14.52”. The Delaware River Valley received the least, with Barrington (Camden) at 7.99”, Blairstown (Warren) 8.17”, Mount Ephraim (Camden) 8.19”, Woodstown (Salem) 8.31”, and in the far south Wildwood Crest (Cape May) saw caught 8.43”.
Seven tornadoes touched down on April 1st, with this total not only equaling the record of most for any day of the year, but alone this day was enough for a record for any spring since data began being collected in 1950.
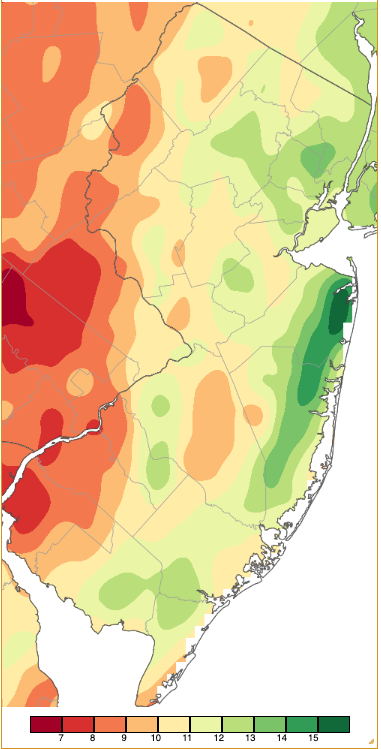
Figure 9. Spring 2023 precipitation across New Jersey based on a PRISM (Oregon State University) analysis generated using NWS Cooperative and CoCoRaHS observations from 7 AM on February 28th to 8 AM on May 31st. Note the scale in full inches at the bottom of the map. Totals range from 6.00"–7.00” (dark red) to 15.00”–16.00” (dark green).
Measurable snow fell in March, with the largest totals in the north led by Sparta (Sussex) with 17.4” followed by the Morris County communities of Mount Olive 13.0”, Randolph 12.1”, 11.8”, 11.5”, Jefferson Township 12.0”, 11.9”, 11.5”, and Rockaway Township 10.1”. Many southern locations did not see measurable snow in March and nowhere saw flakes accumulate in April or May.
The March–May spring temperature averaged 52.3°. This is 1.0° above normal and the 17th mildest on record. The mild leaning came from above-normal March and third warmest April temperatures not quite balanced by a cool May. Adding a record-mild January and third mildest February into the mix, the first five months of 2023 averaged 47.4°. This is 3.6° above normal and ranks as the second mildest January through May, only falling below 48.4° in 2012. Seven of the ten mildest January–May intervals since 1895 have occurred since 2002, with the remaining three in the 1990s.
Snow SeasonNew Jersey experienced its 3rd least snowy season on record at 4.8” (period of record 1894/1895–present; this was listed as 4th in the April report, but a reanalysis of all years pushed it into a tie with 2019/2020; see Table 1). Only 1972/1973 with 4.0” and 1918/1919 with 4.3” saw less. Northern counties averaged 13.8” for the season (-21.3”, 7th least snowy) and central ones 3.9” (-24.5”, 3rd least snowy). In the south, the 0.4” seasonal average was 18.2” below normal and was the least snowy on record, surpassing the previous minimum of 0.8” in 2019/2020.
| Rank | Snowfall | Season |
| 1 | 4.0" | 1972/1973 |
| 2 | 4.3" | 1918/1919 |
| 3 | 4.8" | 2022/2023 |
| 3 | 4.8" | 2019/2020 |
| 5 | 5.9” | 2001/2002 |
| 6 | 6.5" | 1997/1998 |
| 7 | 7.5" | 1949/1950 |
| 8 | 7.8" | 2011/2012 |
| 9 | 8.3" | 1991/1992 |
| 10 | 8.6" | 1994/1995 |
Table 1. The lowest ten New Jersey seasonal (October-May) snowfall totals dating back to 1894/1895.
Not surprisingly, the snowiest locations this past season were at higher elevations in the northwest portion of the state (Table 2, Figure 10). There was a notable decline in totals once into the central region, with most of southern NJ under an inch for the season.
| Community | Elevation | County | Snowfall |
| Highland Lakes | 1362’ | Sussex | 37.9" |
| Sparta Township | 1054’ | Sussex | 34.3" |
| Wantage Township | 948’ | Sussex | 32.4" |
| Jefferson Township | 958’ | Morris | 25.2" |
| Charlotteburg Reservoir | 778’ | Passaic | 24.3" |
| Hardyston Township | 1061’ | Sussex | 23.6" |
| Jefferson Township | 781’ | Morris | 23.4" |
| Mount Olive Township | 1038’ | Morris | 23.0" |
| Wantage Township | 566’ | Sussex | 23.0" |
| Randolph Township | 971’ | Morris | 22.9" |
Table 2. Top 10 snowiest NJ locations: November 2022–April 2023.
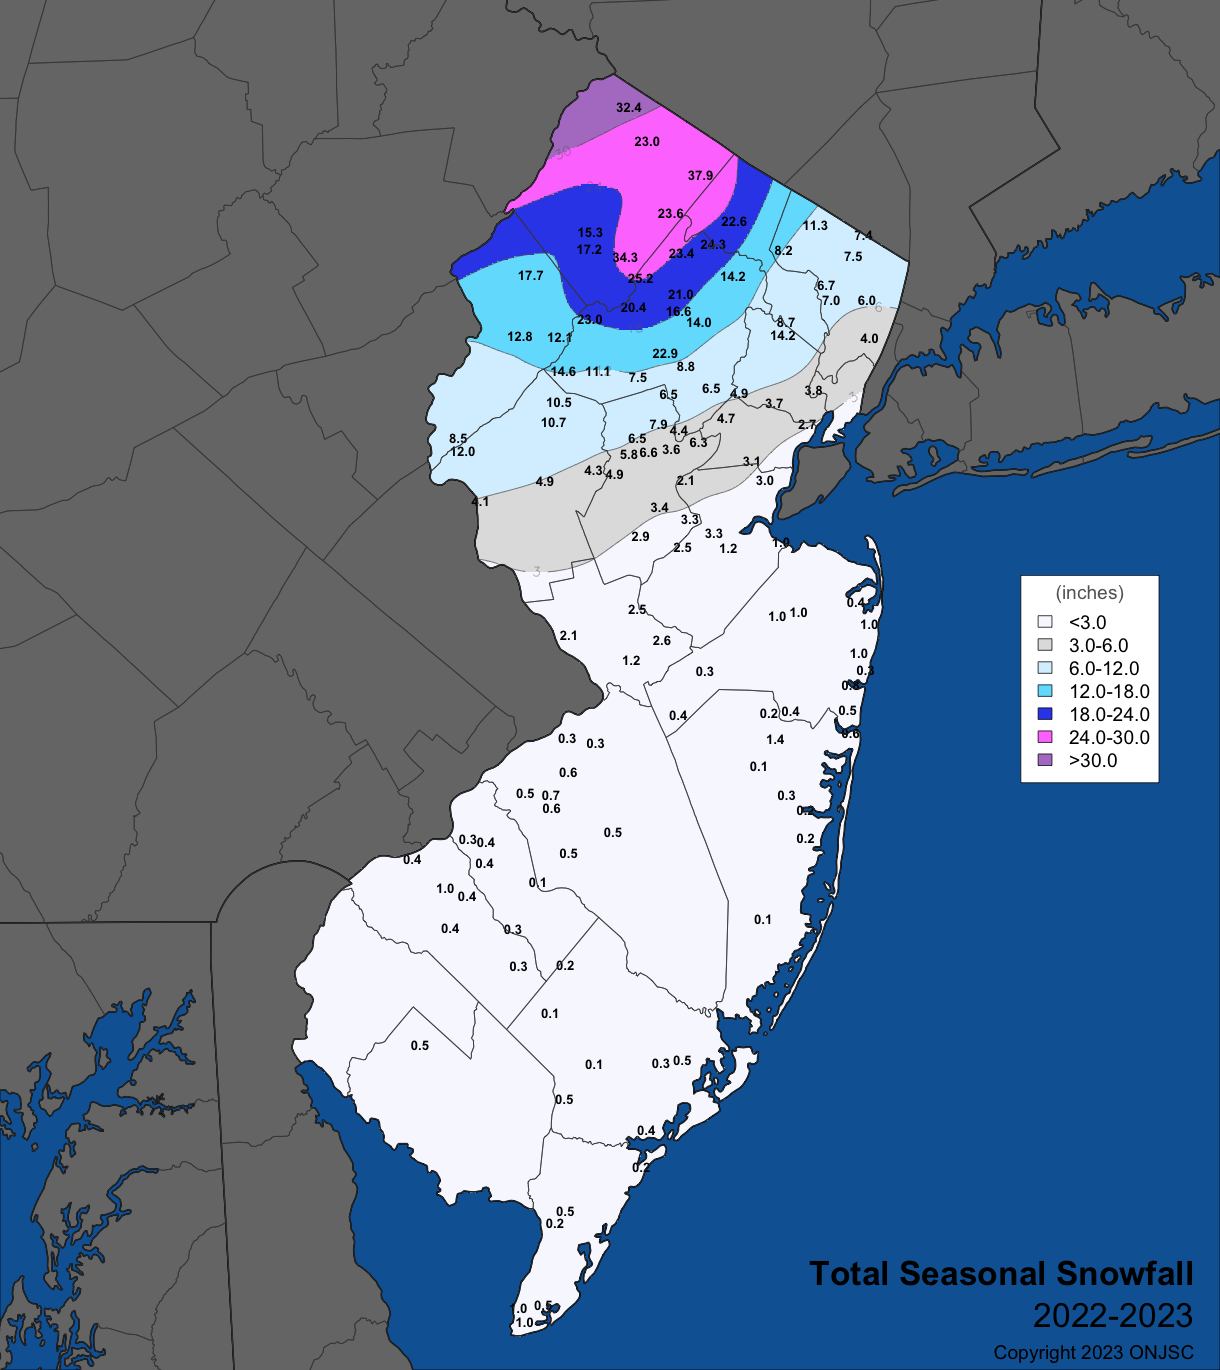
Figure 10. 2022–2023 seasonal snowfall across New Jersey based on complete records provided by CoCoRaHS, North Jersey Weather Observer, and NWS Cooperative Network observers.
For those seeking more detailed information on 5-minute, hourly, daily, and monthly conditions, please visit the following Office of the NJ State Climatologist's websites:
Rutgers NJ Weather Network
NJ Community Collaborative Rain, Hail and Snow Network
NJ Snow Event Reports
Interested in receiving our monthly summaries at the end of each month? Send us your e-mail address here to join the mailing list.
Past News Stories

