Bone Dry: October 2024 Recap
New Jersey State Climatologist
Center for Environmental Prediction, School of Environmental and Biological Sciences/NJAES
Rutgers University
November 8, 2024
Overview
New Jersey has transitioned into a worrisome drought situation following historically low October precipitation. So, too, was the September–October combined total a record low. The NJ Department of Environmental Protection issued a Drought Watch on October 17th, serving as a “heads up” that the state had been exceedingly dry for weeks. This continued through the end of the month, one in which, averaged statewide, precipitation totaled only 0.02”. This was 4.17” below the 1991–2020 normal and surpassed October 1963 as the driest October on record (Table 1). Many gauges failed to collect any measurable precipitation and those that did, at best, saw no more than about 0.10” (Figure 1). The northern climate division averaged 0.03” (-4.42”, driest), southern division 0.01” (-4.02, driest), and coast 0.02” (-4.07”, driest).
| Rank | Year | Oct. Avg. Precip. |
| 1 | 2024 | 0.02" |
| 2 | 1963 | 0.25" |
| 3 | 1924 | 0.29" |
| 4 | 2000 | 0.77" |
| 5 | 1952 | 0.86" |
| 6 | 2001 | 0.93" |
| 7 | 1994 | 0.95" |
| 7 | 1921 | 0.95" |
| 9 | 1909 | 1.21" |
| 10 | 1928 | 1.22" |
Table 1. The 10 driest Octobers across New Jersey since 1895.
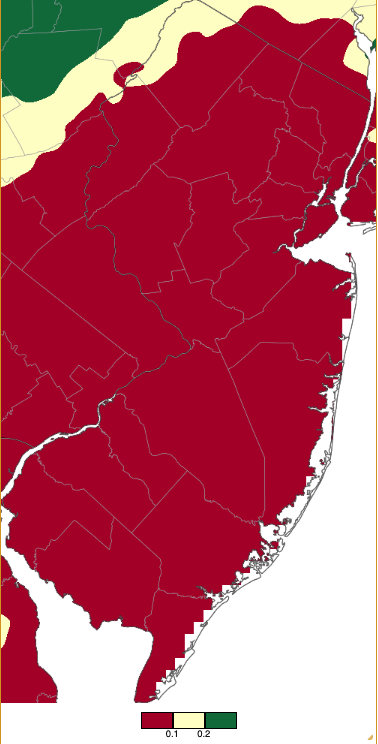
Figure 1. October 2024 precipitation across New Jersey based on a PRISM (Oregon State University) analysis generated using NWS Cooperative, CoCoRaHS, NJWxNet, and other professional weather station observations from approximately 8 AM on September 30th to 8 AM on October 31st. Note the scale in inches at the bottom of the map. Totals range from 0.00”–0.10” (dark red) to 0.20”–0.30” (dark green).
This was not a record low precipitation just for October, rather for any month (Table 2). Seven of the ten driest months since 1895 have occurred in the fall. When warm-season showers and possible late-season tropical systems fail to deliver rain to the Garden State, and early cold-season low pressure systems fail to arrive, extended dry spells may occur. Still, runs of 30 or more days without measurable precipitation are quite rare. Dry streaks at some stations were continuing into November as of the report publication date (November 8th).
| Rank | Month/Year | Precip. |
| 1 | October 2024 | 0.02" |
| 2 | October 1963 | 0.25" |
| 3 | September 1941 | 0.29" |
| 3 | October 1924 | 0.29" |
| 5 | June 1949 | 0.32" |
| 6 | September 1914 | 0.38" |
| 7 | December 1955 | 0.40" |
| 8 | January 1981 | 0.54" |
| 8 | November 1917 | 0.54" |
| 10 | November 1976 | 0.59" |
Table 2. The 10 driest months on record across New Jersey since 1895.
October precipitation futility in conjunction with the third driest September on record resulted in the driest of any pairing of consecutive months on record (Table 3). The 0.80” total was 0.55” lower than the previous record in December 1980–January 1981. The southern half of the state was drier than the north, though both were woefully dry (Figure 2).
| Rank | Month Pair/Year | 2-Month Precip. |
| 1 | September–October 2024 | 0.80" |
| 2 | December 1980–January 1981 | 1.35" |
| 3 | October–November 2001 | 1.93" |
| 4 | September–October 1941 | 2.15" |
| 4 | September–October 1914 | 2.15" |
| 6 | October–November 1922 | 2.26" |
| 7 | November–December 2021 | 2.27" |
| 8 | October–November 1924 | 2.37" |
| 9 | February–March 2006 | 2.58" |
| 10 | February–March 2009 | 2.67" |
Table 3. The 10 driest consecutive two-month intervals across New Jersey since 1895.
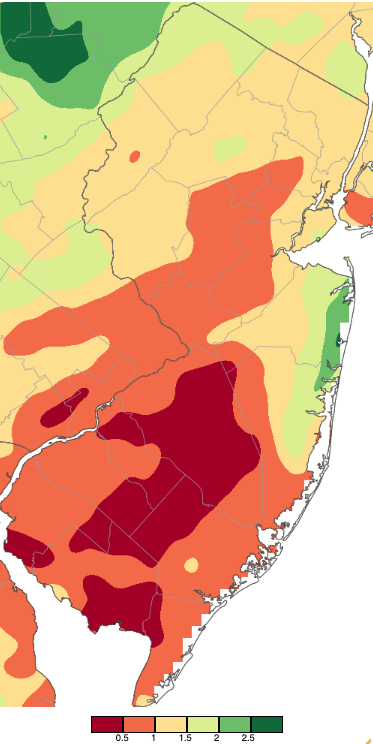
Figure 2. September–October 2024 precipitation across New Jersey based on a PRISM (Oregon State University) analysis generated using NWS Cooperative, CoCoRaHS, NJWxNet, and other professional weather station observations from approximately 8 AM on August 31st to 8 AM on October 31st. Note the scale in inches at the bottom of the map. Totals range from 0.00”–0.50” (dark red) to 2.50”–3.00” (dark green).
The statewide October average temperature of 57.5° was 2.1° above normal. This ranks as the 18th mildest on record. The average high was 70.9°, which was 5.1° above normal and ranks 5th warmest. The average low was 44.2°, which was 0.7° below normal and ranks 52nd warmest. The range of 26.7° between these two values and their opposite departures in unusually large and indicative of the clear skies and exceedingly dry conditions persisting all month. The average temperature in the northern division was 55.8° (+2.5°, 14th mildest), 58.5° in the south (+2.0°, 18th mildest), and 59.4° (+1.8°, 18th mildest) along the coast.
Precipitation, Storms, and Drought
The lead picture for this month’s report shows the magnificent aurora borealis that was viewed by many across NJ on the evening of October 10th. The solar storm that led to this was the only storm of note affecting NJ this month! It is indeed fortunate that skies were clear statewide for this rare showing. As for meteorological “storms”, the best that could be managed were scattered showers on the 1st, 13th, 14th, 24th, and 29th that rarely wetted the ground where they occurred. The top monthly total was 0.14” at High Point Monument (Sussex County). This was followed by 0.13” at High Point (Sussex), 0.10” at Sandyston (Sussex), Stillwater Township (Sussex), Franklin (Sussex), and Woodbine (Cape May). Walpack (Sussex) and a second Woodbine station caught 0.09”.
The prolonged dry spell resulted in 353 wildfires in October according to the NJ Forest Fire Service. Ground water, stream flow, and reservoir levels all fell below annual minimum levels that typically occur in October, leading to some local water restrictions but nothing statewide. Issues with water availability for the cranberry harvest arose, while on the positive side, vineyards reported high-quality grape harvests, and the continuous sunny weather was a boon to the agritourism business.
The US Drought Monitor weekly map covering the last week of October (Figure 3; data valid October 29th) indicates that the southern half of the state is in Severe Drought (D2), conditions that have an expected recurrence interval of 10–20 years. The north was classified as Moderate Drought (D1), conditions having an expected recurrence interval of approximately 6–10 years. Each area has deteriorated one class in the past month.
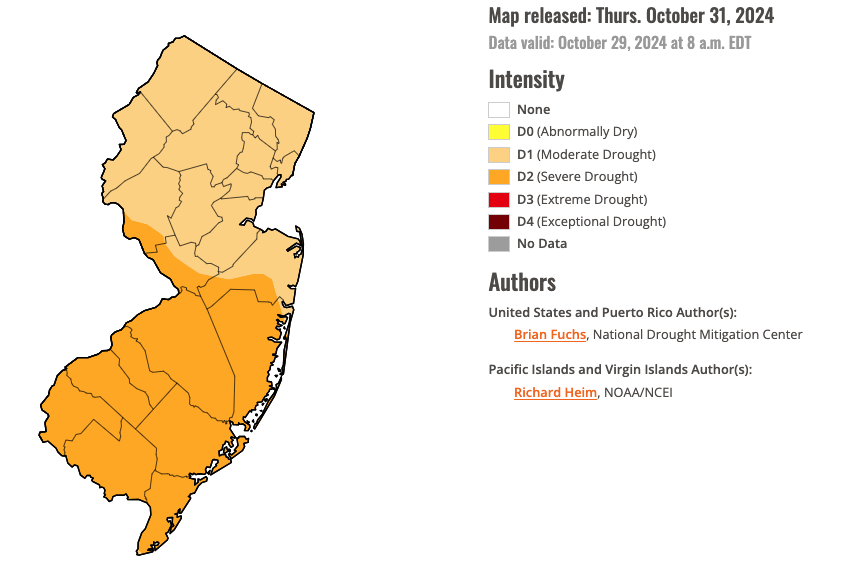
Figure 3. U.S. Drought Monitor map of conditions in NJ as of October 29, 2024.
The highest atmospheric pressure of the month was observed on the 19th at 30.50”–30.60. The lowest pressure came on the 14th at 29.55”–29.65”. Winds on the 14th gusted to 43 mph at Lower Alloways Creek Township (Salem), High Point Monument 41 mph, and Fortescue (Cumberland) 40 mph. The only other 40 mph gust was reached at Vernon Township (Sussex), with 40 mph recorded on the 26th.
Temperature
October temperatures began on a warm note and ended on a warmer one. In between and even toward month’s end, lows were quite chilly, with the season’s first freezes at many locations, including 15 days with freezing lows at Walpack.
There were an impressive 11 days where one or more of the 69 Rutgers NJ Weather Network (NJWxNet) stations reached at least 80°. A four-day run began on the 4th with Hammonton (Atlantic) and Red Lion (Burlington) at 81°. Red Lion hit 82° on the 2nd, with eight stations either 80° or 81°. Hammonton, Piney Hollow (Gloucester), and Sicklerville (Camden) reached 80° on the 6th, with Woodland Township (Burlington) at 82° and seven locations 80°–81° on the 7th. Lower Alloways Creek Township rose to 82° on the 12th. The 13th found Fort Dix (Burlington) and Mannington (Salem) at 84° and 30 stations from 80°–83°. While warmth reigned over most of NJ on that day, a cold front with clouds to its north kept Sussex County much cooler. The maximum at High Point Monument was only 51° (Figure 4).
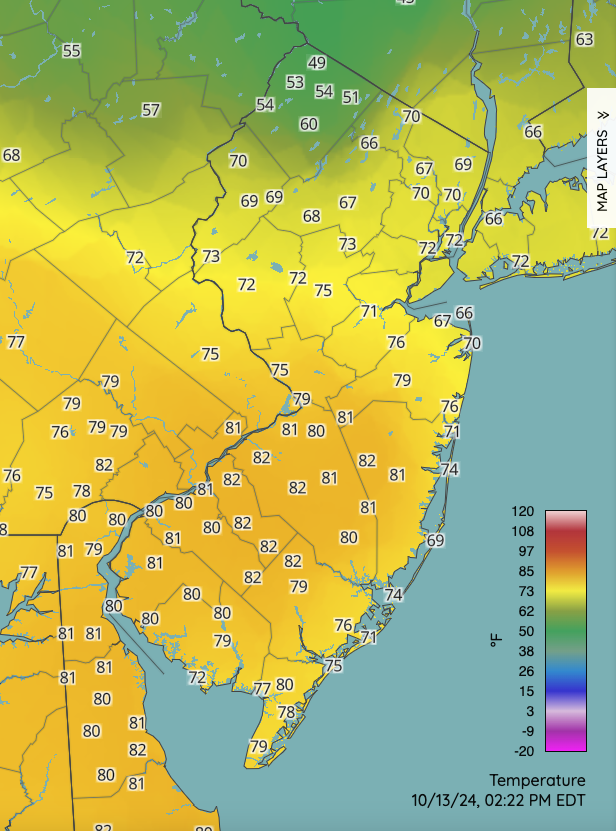
Figure 4. Temperatures at 2:22 PM on October 13th. Observations are from NJWxNet, NWS, and other professional weather stations.
Hammonton, Woodland Township, Hillsborough-Duke (Somerset), and New Brunswick (Middlesex) each hit 84° on the 21st. The warmest October day was the 22nd, with Cherry Hill (Camden) a hot 89°, Hammonton and Piney Hollow each 88°, 26 stations from 85°–87°, and 28 from 80°–84° (Figure 5). Coolest were Harvey Cedars (Ocean) at 68° and Seaside Heights (Ocean) 75°.
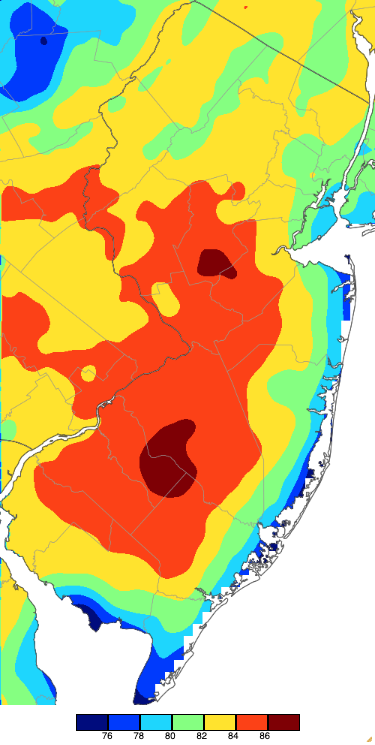
Figure 5. Maximum temperatures on October 22nd based on a PRISM (Oregon State University) analysis generated using NWS, NJWxNet, and other professional weather stations. Note the 2° scale beneath the map.
Mannington checked in with 82° on the 23rd, with 29 stations either 80° or 81°. The month finished with Hillsborough-Duke at 81° on the 30th with 14 sites at 80°. Halloween was one of the warmest on record in NJ with Fort Dix, Hillsborough-Duke, and Woodland Township all at 86° and 57 stations from 80°–85°. New Brunswick had a record high of 83°. Fortescue was coolest at 73°.
As mentioned previously, Walpack, the cold-air-drainage valley station, led the way joining in on every one of the 15 freezing days. This began on the 10th when Walpack dropped to 31° to end their growing season. The 11th saw Walpack at 29°, with six other stations at 30°–32° experiencing their first freeze.
Walpack led the way on the 15th at 29° with four other freezing locations. With the number of other stations below freezing (but not as cold as Walpack) noted in parentheses, Walpack fell to 26° on the 16th (10), 22° on the 17th (16), 25° on the 18th (11), 26° on the 19th (10), 26° on the 20th (7), 30° on the 21st (2), 32° on the 23rd, 26° on the 25th (7), 32° on the 26th, and 26° on the 27th (17). It was not the “winner” on the 28th, that honor going to Hopewell Township (Mercer) at 24° followed by 36 stations from 25°–32°. This marked the coldest day of the month, noting that the southern interior was as cold or colder than many northern locations and certainly colder than coastal and urban sites (Figure 6). That morning, Atlantic City Marina (Atlantic) and Harvey Cedars were mildest at 45°. Walpack resumed its low position at 26° on the 29th (17).
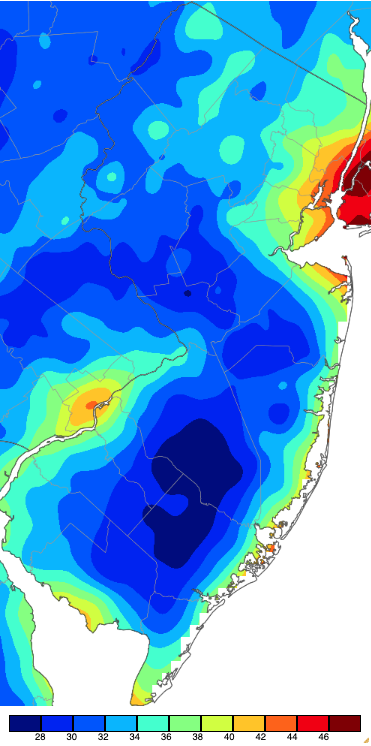
Figure 6. Minimum temperatures on October 28th based on a PRISM (Oregon State University) analysis generated using NWS, NJWxNet, and other professional weather stations.
By month’s end, over half of the NJWxNet stations had fallen below freezing at least once. However, the end of the growing season had yet to arrive over almost half of the state (Figure 7).

Figure 7. Areas that have experienced a freezing temperature this fall (blue) and those yet to have fallen to below freezing (maroon). Graphic is based on a PRISM (Oregon State University) analysis generated using NWS, NJWxNet, and other professional weather stations.
While Walpack only fell to 33° on the 13th, this low was in stark contrast to the morning low of 61° at Atlantic City Marina. An even wider spread occurred on the 23rd with Walpack down to 32° and Atlantic City Marina 62°. This morning also found Walpack 7° colder than the next coldest site, that being 39° in Hopewell Township.
The 20th and 21st saw diurnal temperature ranges at a number of stations that are rarely exceeded. Walpack’s low of 26° on the 20th was 51° lower than its afternoon maximum of 77°. The 21st saw a 53° range at Walpack (30°/83°), 52° at Hopewell Township (31°/83°), and 50° ranges at Pequest (Warren), Basking Ridge (Somerset), Hillsborough-Duke, and Oswego Lake (Burlington).
For those seeking more detailed information on 5-minute, hourly, daily, and monthly conditions, please visit the following Office of the NJ State Climatologist's websites:
Rutgers NJ Weather Network
NJ Community Collaborative Rain, Hail and Snow Network
NJ Snow Event Reports
Interested in receiving our monthly summaries at the end of each month? Send us your e-mail address here to join the mailing list.
Past News Stories

