Anything but Boring: February 2021 and Winter 2020/21 Recaps
New Jersey State Climatologist
Center for Environmental Prediction, School of Environmental and Biological Sciences/NJAES, Rutgers University
March 8, 2021
February Overview
Fate was clearly tempted when last month’s report was entitled: “Pretty Darn Boring.” Not that this wasn’t a truthful statement from both meteorological and climatological perspectives. So now this month’s title, being just as legitimate as January’s. The turnaround began in the waning hours of January 31st when what proved to be an impactful, long-lasting coastal storm began to invade the Garden State. This major event was followed by a series of storms that resulted in record or near record-setting monthly snowfall totals in northern and central regions and quite wet conditions in the south.
Statewide precipitation (rain and melted snowfall) averaged 4.89” in February. This was 2.03” above the 1991–2020 average* and ranks as the 14th wettest February in 127 years of record keeping. The coastal south averaged 5.91” (+2.84”), ranking as 6th wettest. The remainder of the south came in with 5.09” (+2.20”, 11th) and the north 4.44” (+1.65”, 19th). More specifically, the southeast and central areas were wettest and the southwest and far north least wet (Figure 1).
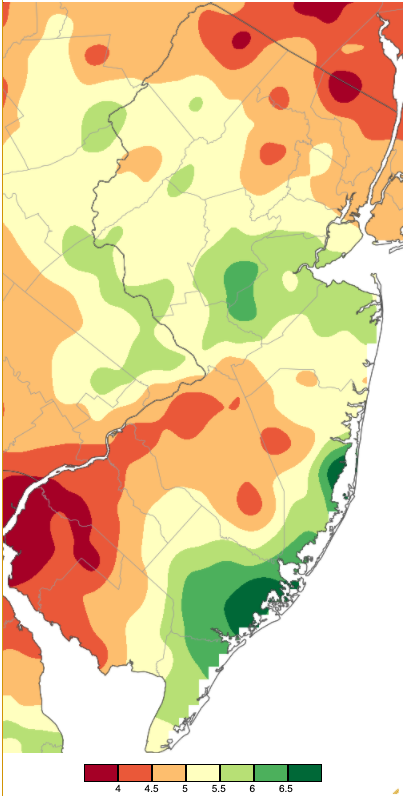
Figure 1. February 2021 precipitation across New Jersey based on a PRISM (Oregon State University) analysis generated using NWS Cooperative and CoCoRaHS observations from 7 AM on January 31st to 7 AM on February 28th. Totals range from 3.50”–3.99” (red) to 6.50”–6.99” (dark green).
While plenty of precipitation fell throughout the state, it was more often than not in the form of rain across the southern third of NJ, while central and northern areas were visited by one major snowstorm and a series of modest ones. All told, the statewide average snowfall was 23.5”. This is 15.3” above the 1991–2020 average and ranked as the 7th snowiest February (Table 1).
| Rank | Year | Feb. Snow (Statewide) |
|---|---|---|
| 1 | 2010 | 38.4" |
| 2 | 2003 | 31.0" |
| 3 | 1899 | 30.5" |
| 4 | 1967 | 26.7" |
| 5 | 1934 | 24.1" |
| 6 | 1979 | 23.8" |
| 7 | 2021 | 23.5" |
| 8 | 2014 | 22.7" |
| 9 | 1958 | 20.4" |
| 10 | 1926 | 20.3" |
Table 1. The 10 snowiest Februarys across New Jersey since 1895.
The northern portion of New Jersey had its snowiest February on record. The 36.9” eclipsed the average by 26.7”. The top four totals have occurred since 2003 (Table 2).
| Rank | Year | Feb. Snow (North) |
|---|---|---|
| 1 | 2021 | 36.9" |
| 2 | 2010 | 35.8" |
| 3 | 2014 | 31.2" |
| 4 | 2003 | 28.2" |
| 5 | 1899 | 27.8" |
| 6 | 1926 | 27.4" |
| 7 | 1967 | 26.3" |
| 8 | 1983 | 25.6" |
| 9 | 1907 | 24.6" |
| 10 | 1994 | 23.8" |
Table 2. The 10 snowiest Februarys across northern New Jersey since 1895. This region includes Sussex, Warren, Morris, Passaic, Bergen, Hudson, and Essex counties.
Central New Jersey experienced its second snowiest February at 32.0”, which is 22.9” above average. 2010 still leads the list (Table 3).
| Rank | Year | Feb. Snow (Central) |
|---|---|---|
| 1 | 2010 | 34.0" |
| 2 | 2021 | 32.0" |
| 3 | 1899 | 30.3" |
| 4 | 2014 | 29.1" |
| 5 | 1967 | 29.0" |
| 6 | 2003 | 26.2" |
| 7 | 1934 | 25.5" |
| 8 | 1979 | 24.4" |
| 9 | 1983 | 23.5" |
| 10 | 1978 | 22.9" |
Table 3. The 10 snowiest Februarys across central New Jersey since 1895. This region includes Hunterdon, Somerset, Union, Middlesex, Monmouth, and Mercer counties.
It was not as if snow did not fall in the south, particularly in the southwest. The 12.0” total was 5.4” above average and ranks as the 22nd snowiest February. Thus far this snow season, a statewide average of 29.9” has fallen. This exceeds the full-season average by 4.7”. Thus, should not another flake fall through spring, this would rank as the 42nd snowiest season of the past 127 years. The 49.8” that has fallen in the north exceeds the season average by 15.1” and would rank 21st snowiest. The central average of 39.2” is 11.1” over the season average and would rank 32nd snowiest, while the south at 14.4” is 4.2” below the season average and would rank 46th least snowy.
The statewide February average temperature of 32.2° was 1.7° below the 1991–2020 average*. However, given warming in recent decades, it ranked as the 52nd mildest January in the past 127 years. This was the first below-average month since May 2020 and the coldest February since 2015. Of particular interest was the different behavior of average high and low temperatures. The former came in at 39.1°, which was 4.0° below normal and ranked 53rd coldest. However, the average minimum of 25.3° was 0.7° above normal and ranked as the 32nd mildest. This 4.7° reduction from the normal monthly diurnal temperature range (the average difference between daily high and low temperatures in February) can be attributed to the abundance of cloud cover and, likely but to a lesser extent, frequent windy conditions.
*NOAA’s National Centers for Environmental Information (NCEI) has released 1991–2020 averages for NJ monthly temperature and precipitation. In this report, we are using these values for the first time when discussing departures from normal. For the past decade we have used 1981–2010 normals, thus the difference with the new normal compared to what we’ve used previously is the addition of the past decade and the removal of 1981–1990. More will be reported on changes in a forthcoming note from our office, but a quick look shows that, overall, temperature normals have warmed in eleven months and annually (November cooled slightly). Precipitation increased in nine months and annually (April, May, and November became drier).
Precipitation and Storms
Monthly precipitation (rain and melted snow) at NJ CoCoRaHS stations across the state was as high as 7.55” in Lacey Township (Ocean County). Other large amounts included Galloway (Atlantic) 7.13”, Linwood (Atlantic) 7.05”, Cranford (Union) 6.91”, and Mine Hill (Morris) 6.83”. The lowest totals were in the southwest, including Mansfield (Burlington) 4.16”, Wenonah (Gloucester) 4.20”, Burlington (Burlington) 4.22”, Woodstown (Salem) 4.26”, and Moorestown (Burlington) 4.40”. Monthly snowfall totaled as much as 56.0” at Mine Hill. This is being evaluated as a possible monthly record for any month in New Jersey. The current official record is 50.1” at Mt. Holly in February 2010. Other notable February 2021 totals included 50.3” in Frelinghuysen (Warren), Newton (Sussex) 48.4”, Randolph Township (Morris) 47.8”, and two locations in Jefferson Township (Morris) 47.6” and 47.4”. The lowest monthly totals were in Cape May County with 1.3” in Lower Township, Ocean City 2.1”, and Woodbine 2.5” and 3.5” (two stations).
The biggest storm of the month was already underway as the 1st began. The heaviest snow fell in central and northern areas during the morning and afternoon of the 1st, with rates of 2” or more per hour for multiple hours. The storm stalled off the mid-Atlantic coast and, with this, snowfall continued at various rates and in various locations into the afternoon of the 3rd. When the flakes finally stopped flying, snowfall totaled over 30” at several locations in Morris, Sussex, and Warren counties, with 20” totals also found in Bergen, Essex, Hudson, Hunterdon, Passaic, and Somerset counties (Figure 2, Table 4). Six other counties recorded 10.0” to 18.5”. Lesser totals occurred in six southern counties, with as little as 0.2” in Ocean City.
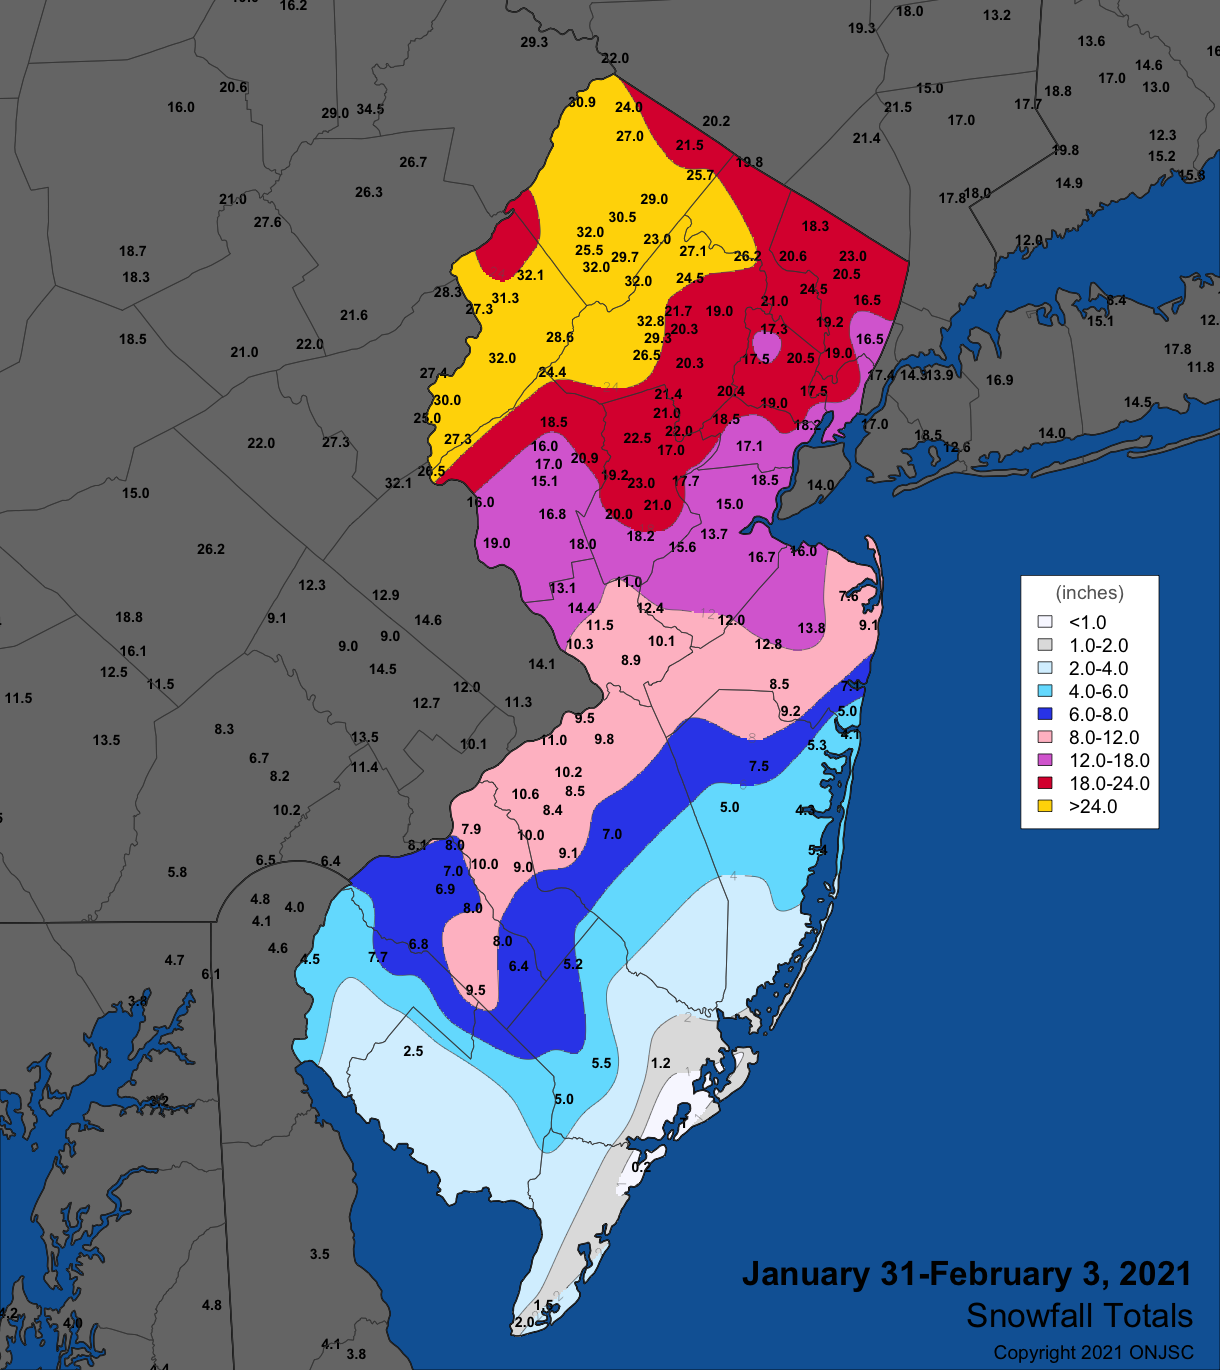
Figure 2. Snowfall from mid-day on January 31st through the morning of February 3rd. Observations are from CoCoRaHS, NWS Cooperative Observer, and NWS Spotter reports.
| County | Location | Snowfall |
|---|---|---|
| Bergen | Park Ridge & Hillsdale | 23.0” |
| Burlington | Burlington | 11.0” |
| Camden | Gibbsboro | 10.6” |
| Essex | Bloomfield | 20.5” |
| Hudson | Kearny | 20.1” |
| Hunterdon | Holland | 24.2” |
| Mercer | Pennington | 14.4” |
| Middlesex | Woodbridge | 18.5” |
| Monmouth | Union Beach | 16.0” |
| Morris | Mine Hill | 32.8” |
| Passaic | Bloomingdale | 26.2” |
| Somerset | Somerville | 23.0” |
| Sussex | Andover & Newton | 32.0” |
| Union | New Providence | 18.5” |
| Warren | Frelinghuysen | 32.1” |
Table 4. Maximum snowfall for the January 31st to February 3rd storm in counties where at least 10.0” fell. Observations are from CoCoRaHS, NWS Cooperative Observer, and NWS Spotter reports.
A considerable amount of moisture fell as rain, freezing rain, sleet, and snow in this storm. Total precipitation amounts were as high as 3.43” in Mine Hill, Frelinghuysen 3.32”, Cranford 3.28”, Vernon Township (Sussex) 3.24”, and Newton 3.17”. Some 98 CoCoRaHS stations reported 2.00”–3.16” and 83 from 1.00”–1.99”. The least amount fell at Maurice River (Cumberland) with 0.65”. Winds were quite strong during the storm, particularly along the coast on the 1st when Seaside Heights (Ocean) gusted to 56 mph, Harvey Cedars (Ocean) 53 mph, and Atlantic City Marina (Atlantic) and Sea Girt (Monmouth) each 51 mph. Seven other NJWxNet stations gusted from 41–47 mph (Figure 3). These easterly winds pushed a considerable amount of water onto the beaches and into the bays and estuaries along the entire coast over multiple tidal cycles. This resulted into minor to moderate flooding along the coast during four tidal cycles at the Sandy Hook (Monmouth) gauge (Figure 4). Later on the 3rd, the departing storm brought gusts to 46 mph at High Point Monument (HPM; Sussex) and 40 mph in Lower Alloways Creek Township (Salem). Once clouds dissipated, a satellite image on the morning of the 4th shows the broad extent of snow cover across New Jersey (Figure 5).
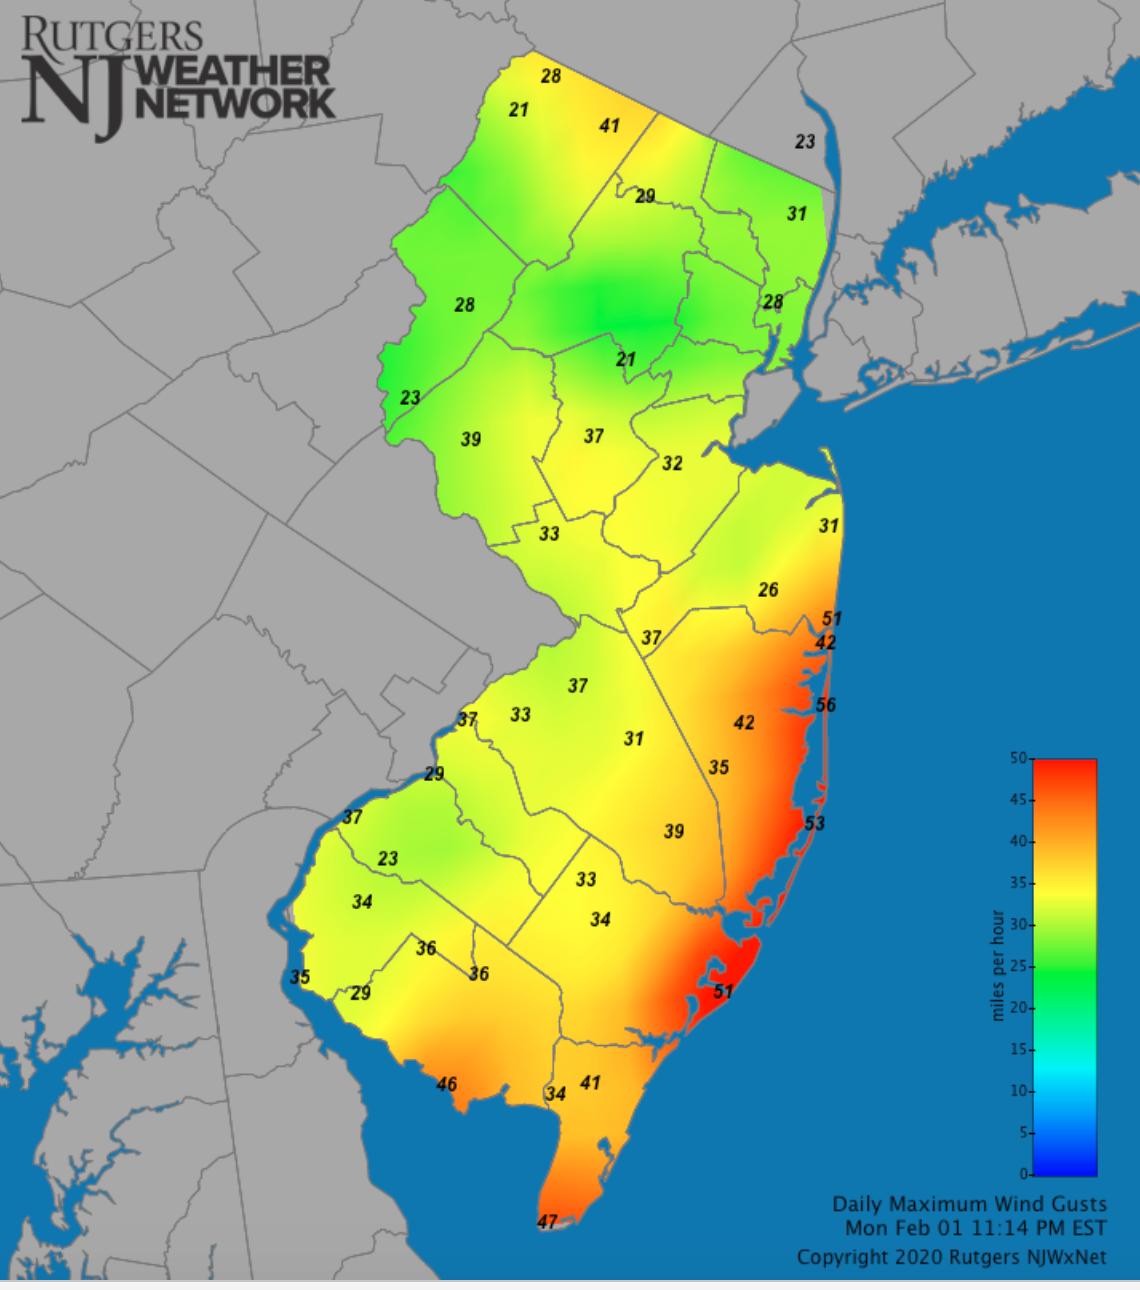
Figure 3. Maximum wind gusts on February 1st as recorded at Rutgers NJ Weather Network stations.
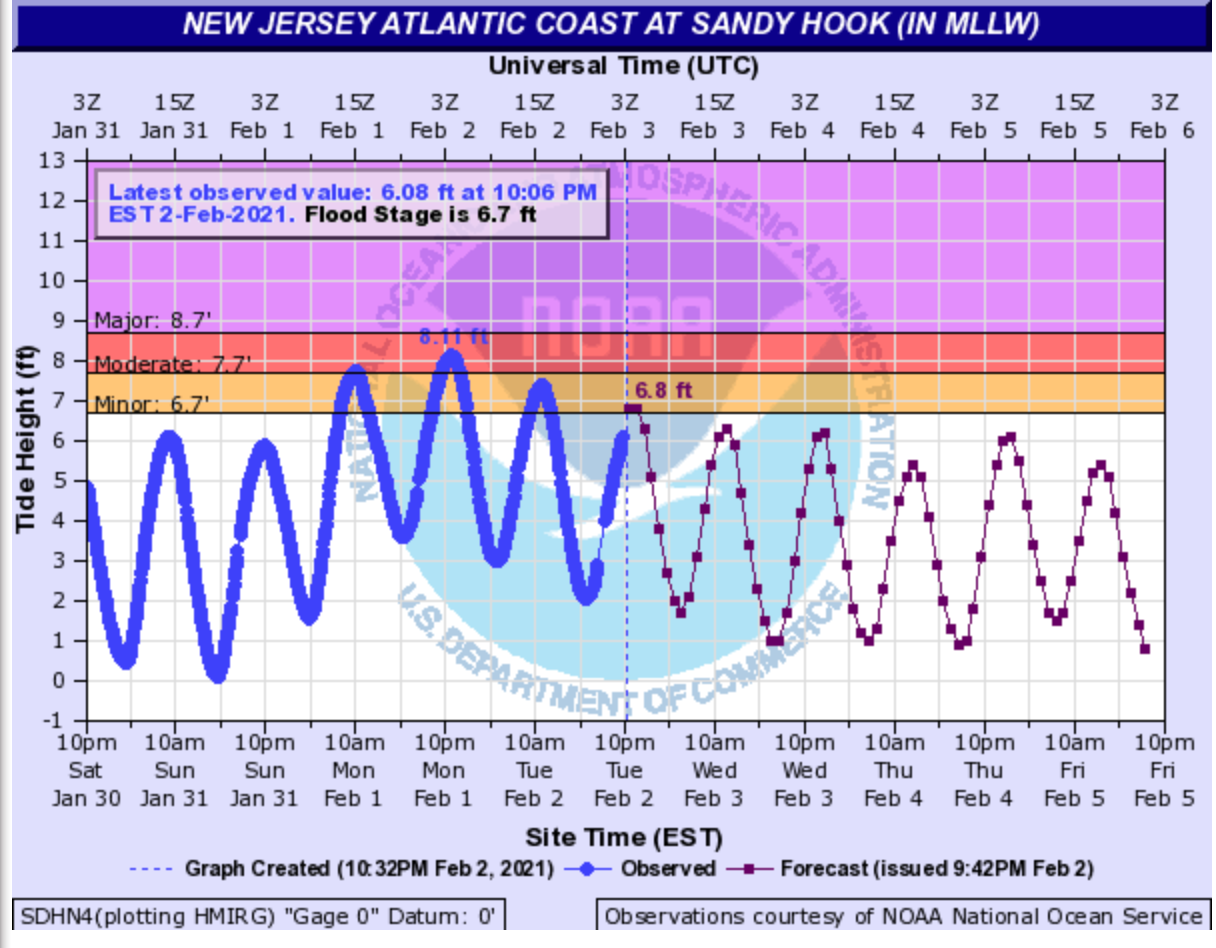
Figure 4. Tide height at the Sandy Hook (Monmouth) gauge from 10 PM on January 30th to 10 PM on February 2nd (blue line) and projected heights onward to February 5th (red line). Minor flood level was achieved at high tide during the evening of the 2nd. Courtesy of NOAA National Ocean Service.
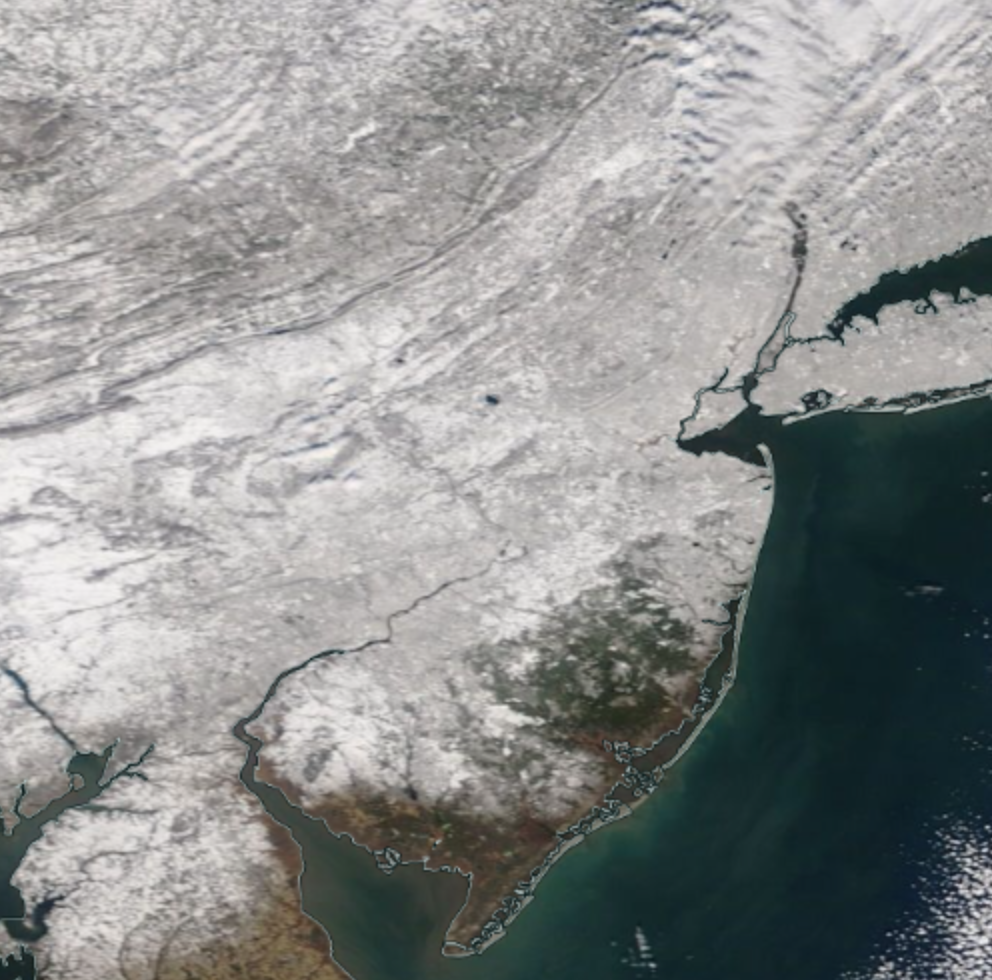
Figure 5. NASA MODIS visible satellite image on the morning of February 4th showing all but extreme southern and portions of south coastal NJ snow covered. The dark spot in west central NJ is unfrozen Round Valley Reservoir (Hunterdon). NJ skies are cloud free with some clouds lying just north of the NJ border.
As crews were still dealing with snow removal from the big storm, along came another event on the 7th that saw morning snow taper off during the afternoon. Rain fell in the south prior to briefly changing to snow as the storm ended. The heaviest snow fell in a narrow swath from Hunterdon to Bergen counties, with amounts much lower to the northwest where precipitation was limited and gradually lower to the south where rain kept totals down (Figure 6). Snow totaled 6.5” or more at stations in 11 counties. Top totals in counties with 8.0” or more included Westwood (Bergen) 9.1”, Stockton (Hunterdon) and Branchburg (Somerset) each with 9.0”, and Verona (Essex), Chatham (Morris), and Wayne (Passaic) each with 8.0”. Precipitation associated with this storm was as much as 1.16” in Wildwood Crest (Cape May), Lacey Township 1.05”, and Ventnor (Atlantic) 1.02”, with 90 CoCoRaHS stations from 0.50”–0.90”. Montague (Sussex) saw the least with 0.10” (Figure 7).
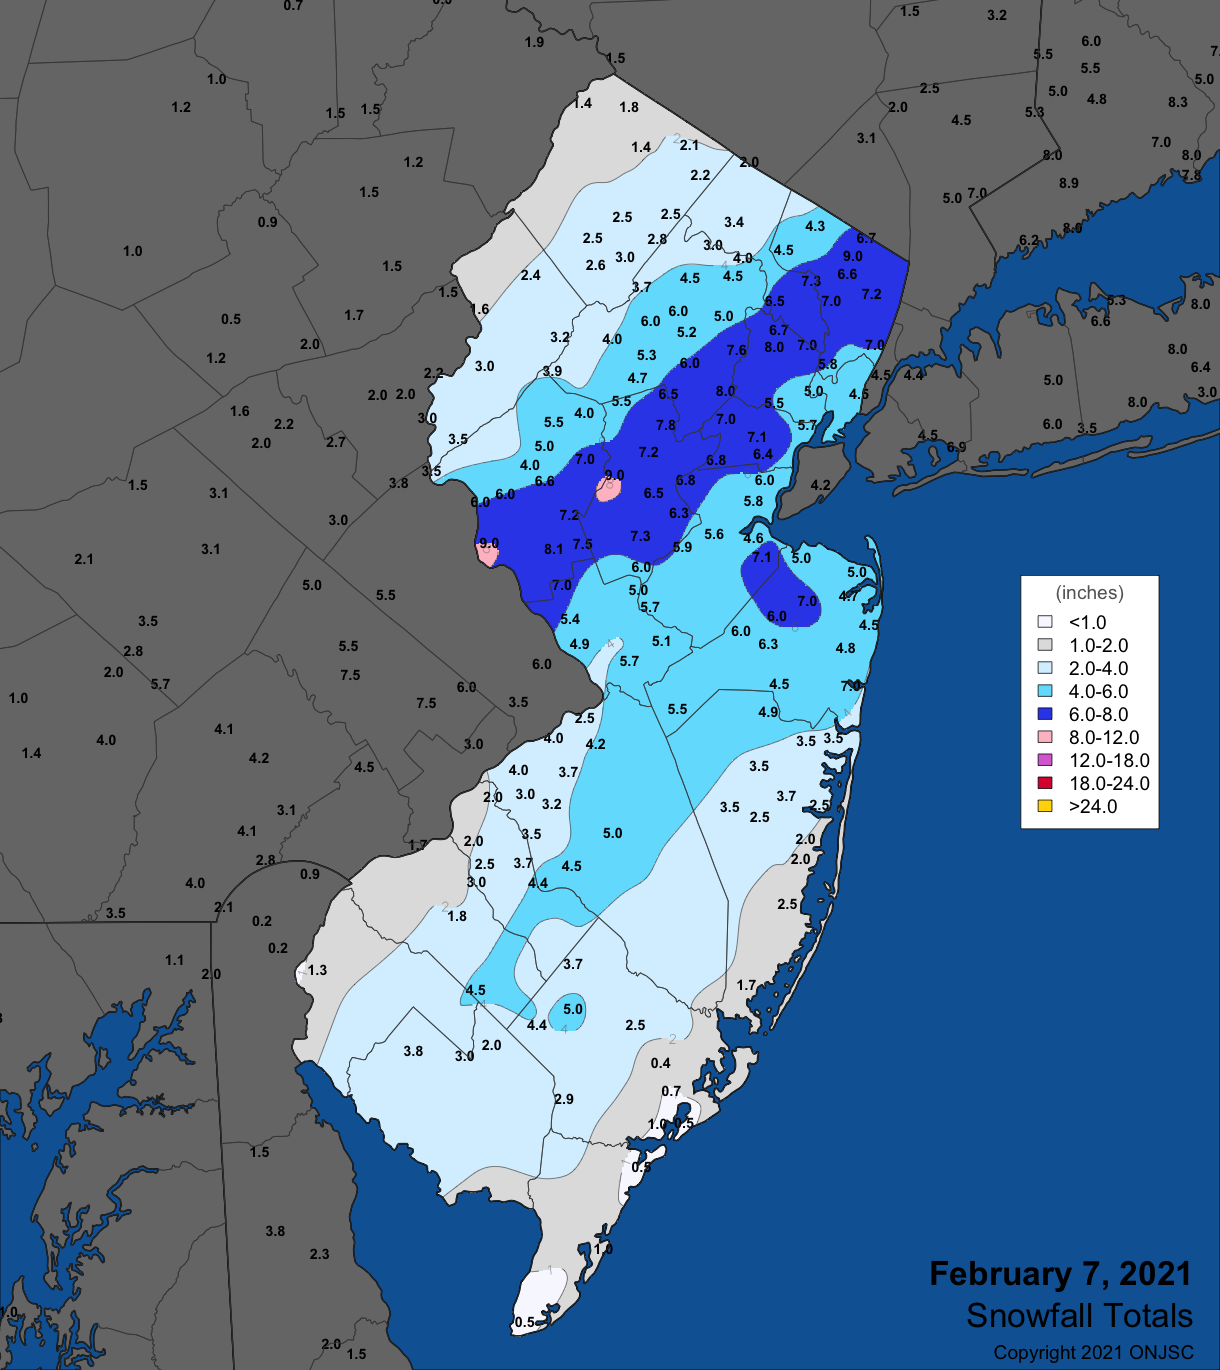
Figure 6. Snowfall from early morning through the afternoon of February 7th. Observations are from CoCoRaHS, NWS Cooperative Observer, and NWS Spotter reports.
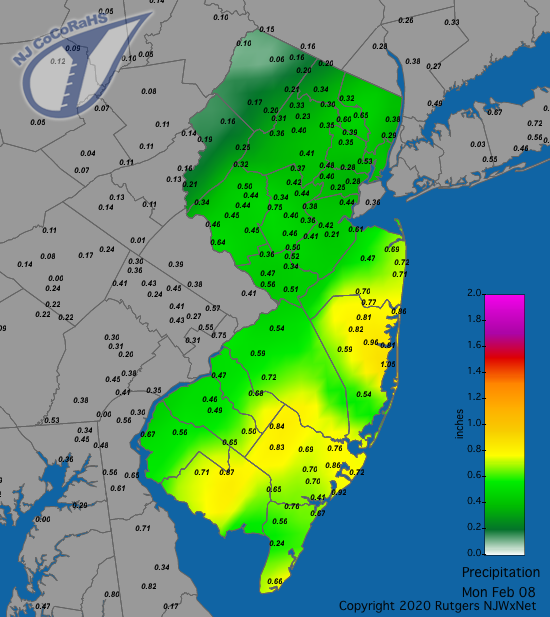
Figure 7. Rainfall and liquid equivalent of snow and sleet from approximately 7 AM on February 7th to 7 AM on February 8th. Reports are from CoCoRaHS observers.
Next up was a modest event on the 9th that brought morning rain to the far south, daytime snow to the northwest, and a mix, including freezing drizzle, to central areas. Snow totaled as much as 3.7” in Wantage (Sussex), 3.1” at Green Pond (Morris), and 2.6” in Frelinghuysen. Rainfall amounted to 0.50” in Wildwood Crest and 0.47”, 0.45”, and 0.36” at three Lower Township (Cape May) locations.
The cavalcade of storms continued with light snow breaking out in the south during the evening of the 10th before reaching central areas by midnight and ending close to dawn on the 11th. This was south Jersey’s snow event with four inches or more falling at locations in six counties (Figure 8). Top county totals included 5.6” in both Estell Manor and Galloway (Atlantic), Winslow (Camden) 4.0”, Dennisville (Cape May) and Upper Township (Cape May) 4.0”, Millville (Cumberland) 4.5”, Newfield (Gloucester) 5.0”, and Forked River (Ocean) 5.5”. Melted snow accumulated to 0.65” in Middle Township (Cape May), Absecon (Atlantic) 0.64”, and Galloway 0.62”.
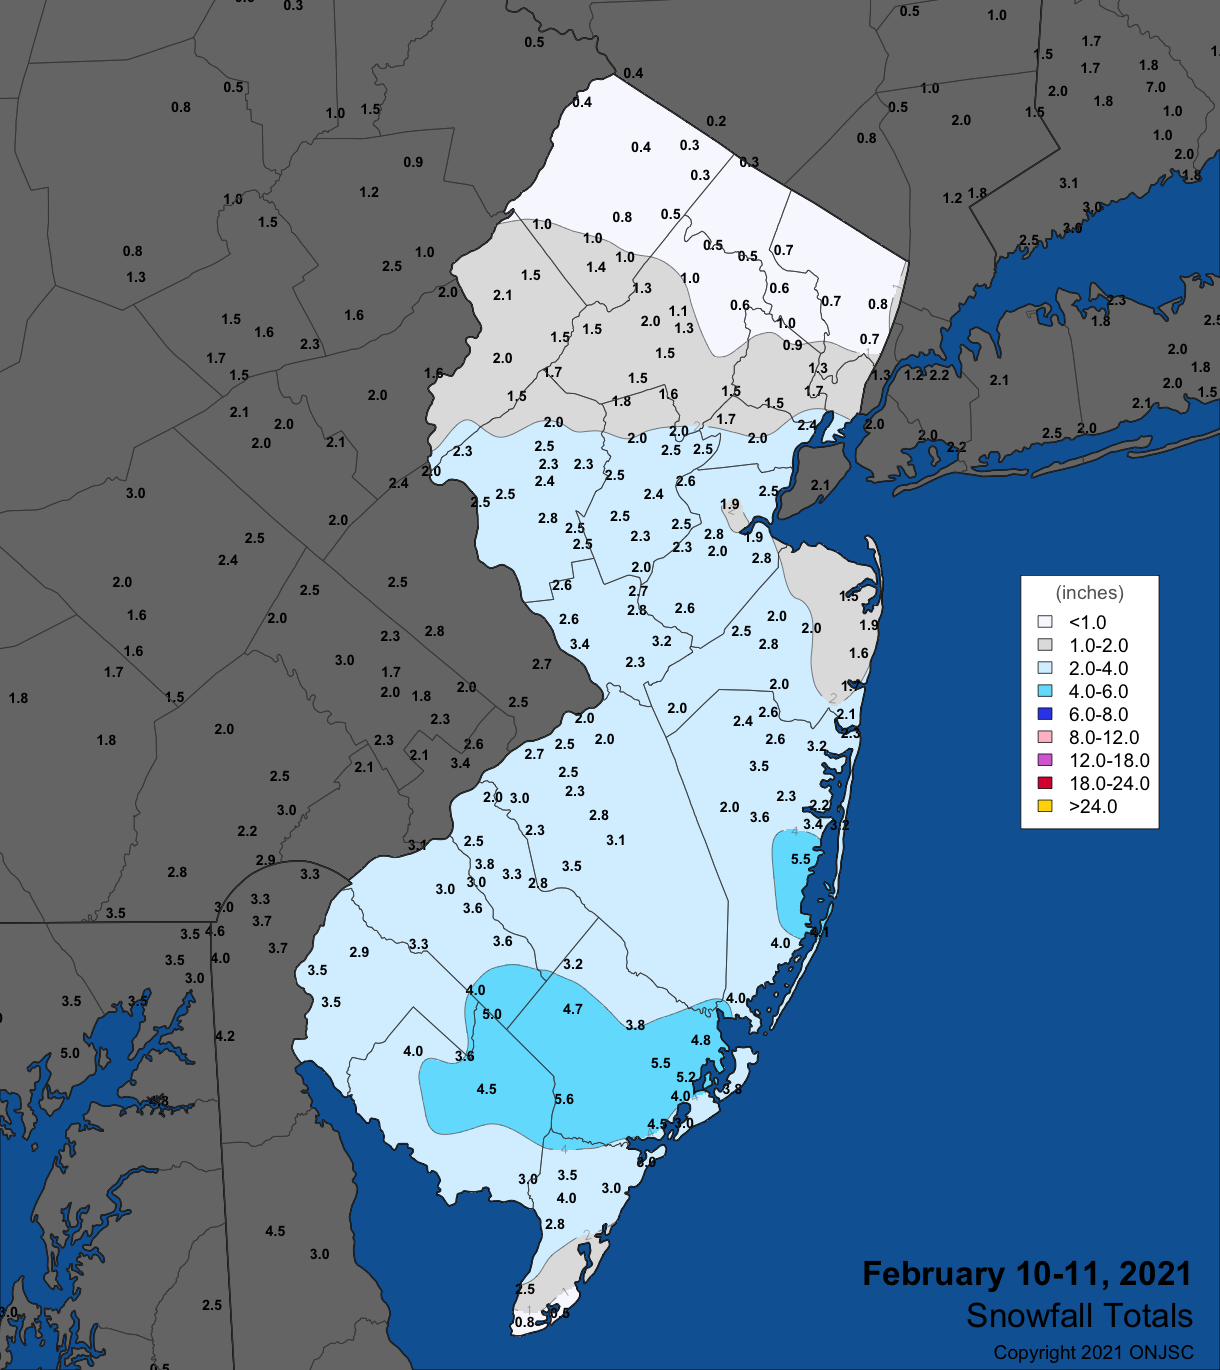
Figure 8. Snowfall from the evening of February 10th through the morning of the 11th. Observations are from CoCoRaHS, NWS Cooperative Observer, and NWS Spotter reports.
Precipitation mainly fell as rain in the south from daytime on the 13th into early on the 14th. A light mix of precipitation fell in central and northern areas. Lower Township’s three stations came in with 0.58”, 0.48”, and 0.43”, with Wildwood Crest catching 0.49”.
A statewide rain event began on the light end during the afternoon of the 15th, became moderate to heavy overnight, and ended during the morning of the 16th. Some fell as freezing rain at higher northern locations. The heaviest rainfall totals included Mt. Arlington (Morris) 1.21”, Cranford 1.20”, Linwood 1.14”, and Middle Township 1.13”. The rainfall was distributed rather equitably statewide with 212 CoCoRaHS stations receiving from 0.50” to 1.09” (Figure 9). Stafford Township (Ocean) had the lowest total in NJ at 0.50”.
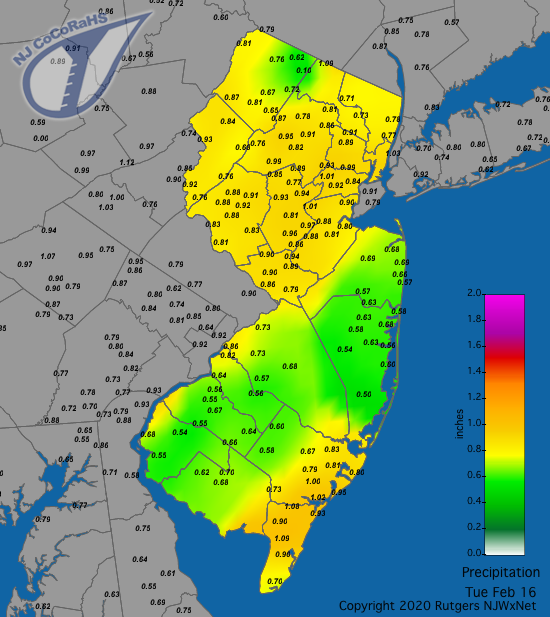
Figure 9. Rainfall from approximately 7 AM on February 15th to 7 AM on February 16th. Reports are from CoCoRaHS observers.
The storms kept coming New Jersey’s way with a mix of precipitation in the south beginning during the pre-dawn hours of the 18th and spreading north as snow. A heavy band of snow became established during the morning, depositing 10.2” in Hamilton (Mercer) and 9.8” at Colts Neck (Monmouth; Figure 10). Some light snow, sleet, freezing rain, and rain continued into the evening of the 19th. Snowfall in seven other central and northern counties totaled as much as 6.5” in Westwood, Florence (Burlington) 6.4”, Wertsville (Hunterdon) 6.8”, Pequannock (Morris) 6.9”, Bloomingdale (Passaic) 6.1”, Bedminster (Somerville) 6.3”, and White Township (Warren) 6.0”. Maximum precipitation values were 1.30” in Middle Township, Ewing (Mercer) 1.05” and 1.06”, Red Bank (Monmouth) 1.01”, Colts Neck 1.00”, and 142 CoCoRaHS stations from 0.50”–0.99”.
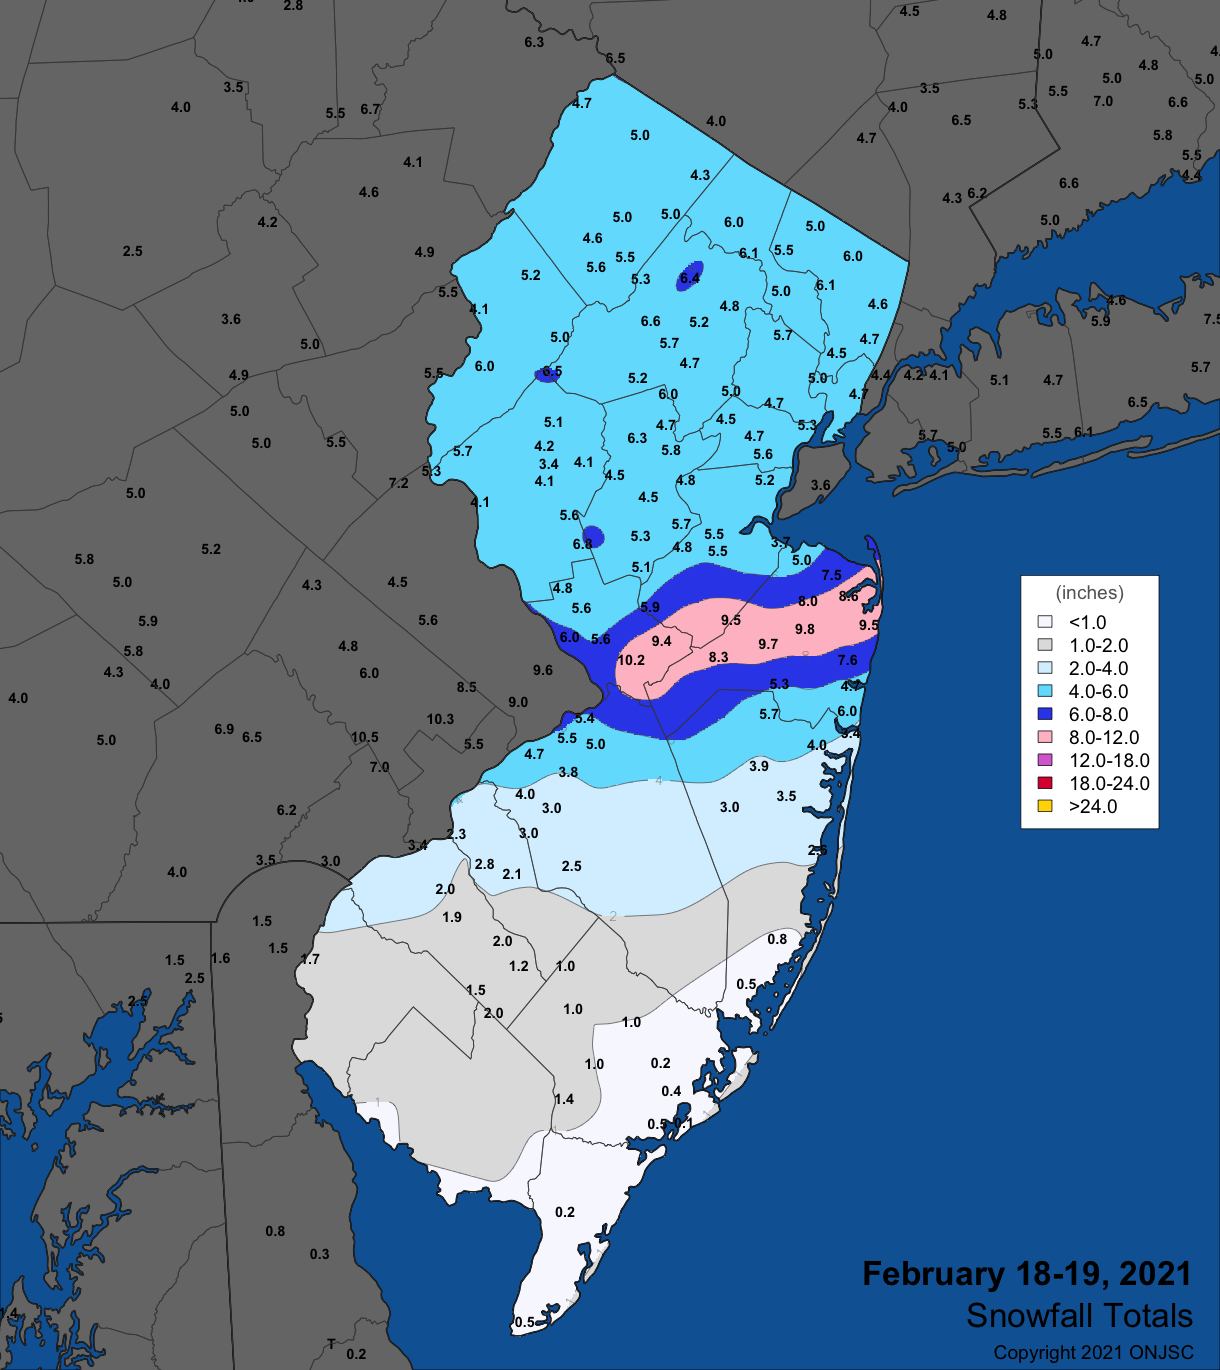
Figure 10. Snowfall from the pre-dawn hours of February 18th through the afternoon of the 19th. Observations are from CoCoRaHS, NWS Cooperative Observer, and NWS Spotter reports.
The daylight hours of the 22nd saw moderate rain fall in the south and light to moderate snow, sleet, and freezing rain in central and northern areas. Four or more inches of snow was reported in seven counties, with top honors going to Randolph and Peapack-Gladstone (Somerset) each with 5.5” (Figure 11). Rain and melted snow amounted to as much as 1.02” and 0.99” at two Port Republic (Atlantic) stations, 1.00” in Weymouth Township (Atlantic), and 0.99” at Galloway. 143 out of the 212 CoCoRaHS reports were from 0.50” to 0.98”, while only 0.25” fell in Montague (Figure 12).
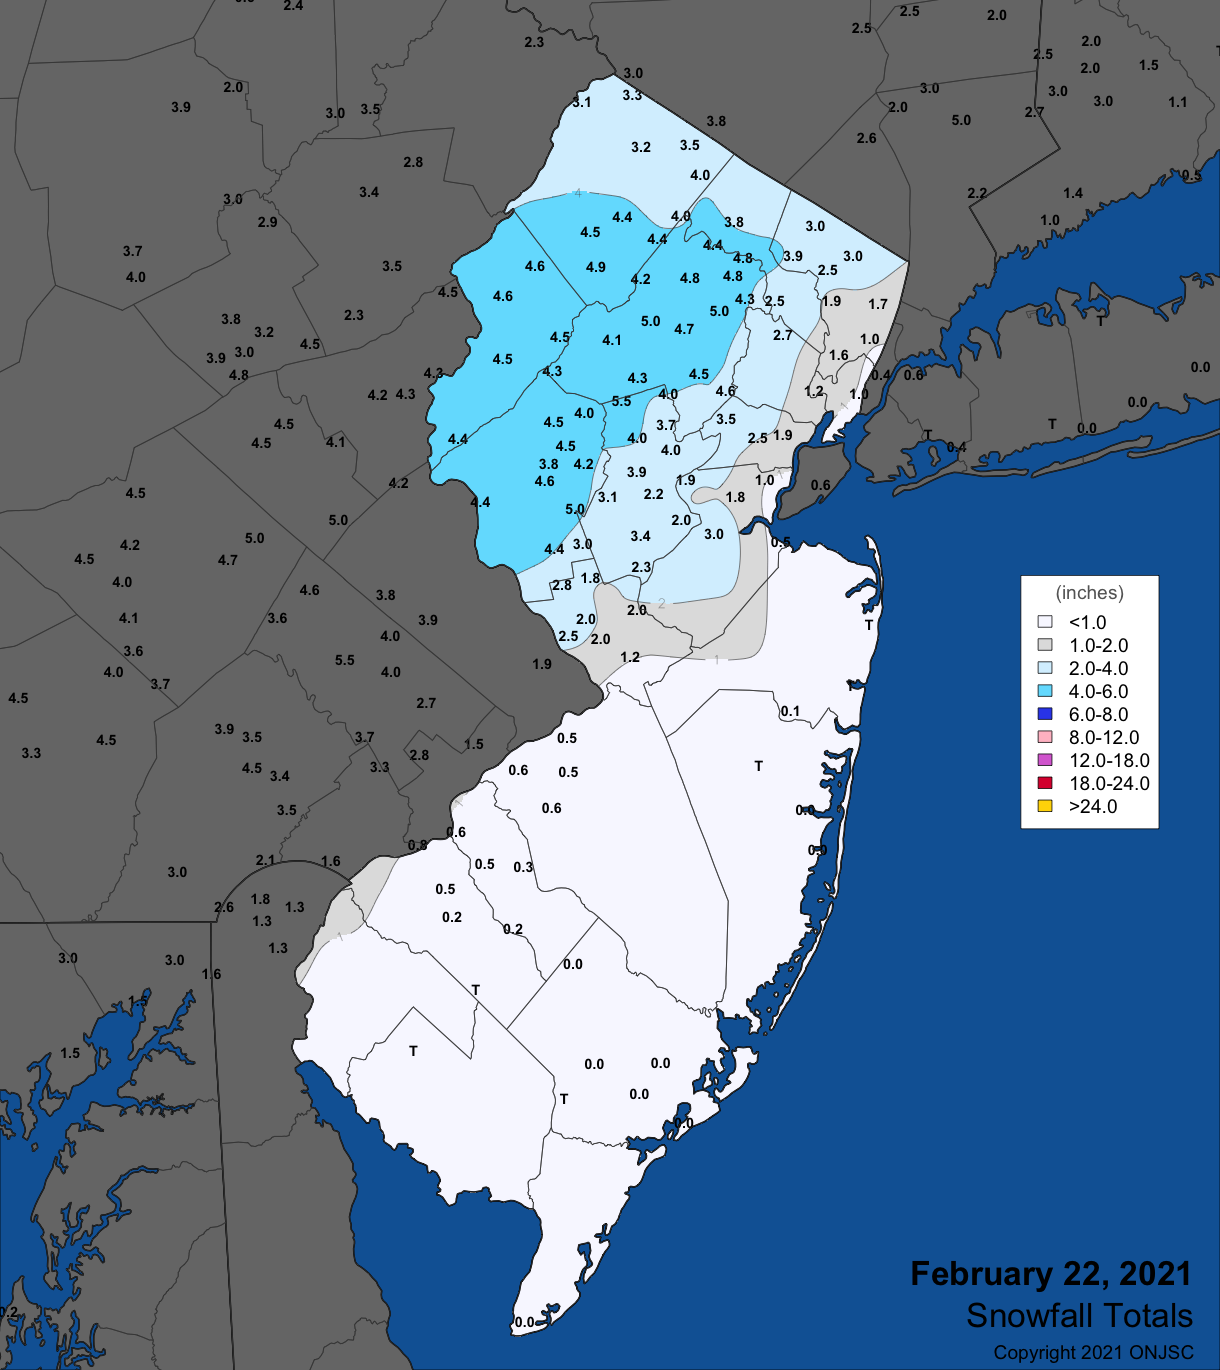
Figure 11. Snowfall during the daytime hours of February 22nd. Observations are from CoCoRaHS, NWS Cooperative Observer, and NWS Spotter reports.
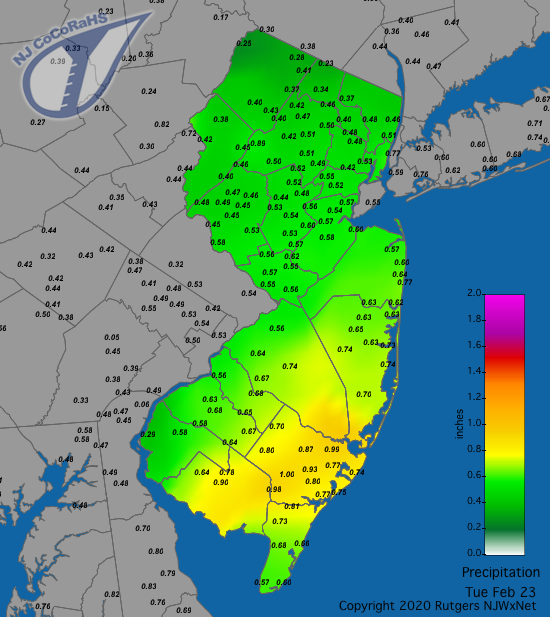
Figure 12. Rainfall from approximately 7 AM on February 22nd to 7 AM on February 23rd. Reports are from CoCoRaHS observers.
Rain fell early on the 27th in most locations, tapering off by midday. The northwest saw some light snow, amounting to, at most, 1.2” in Montague. Top precipitation totals included 0.72” in Hamilton (Atlantic) and 0.69” at Galloway.
As has been the case on the last day of the previous three months, precipitation fell on the last day of February after the standard CoCoRaHS and most NWS Cooperative station early-morning observation times. Thus, the post-observation rain that fell, which continued into the morning of March 1st, counts toward March totals. More will be said about this event in the March report but for now suffice it to say that Estell Manor (Atlantic) and Millville caught the most rain, each coming in with 1.73”.
The early-month storm brought the lowest monthly barometric pressures observed across the state at 29.35”–29.45”. Highest pressures, in the 30.45”–30.50” range, occurred on the 17th and 26th. In addition to the previously-mentioned 40 mph or greater wind gusts on the 1st and 3rd, strong winds occurred on nine other days. As usual, HPM was most often one of the stations in the mix of windy ones. The 6th saw gusts to 46 mph at the top of Mountain Creek in Vernon Township, 43 mph at HPM, 41 mph in Lower Alloways Creek Township, and 40 mph in Stewartsville (Warren). HPM reached 47 mph and Harvey Cedars 40 mph on the 7th. HPM gusted to 41 mph on the 8th, 51 mph on the 16th, 44 mph on the 17th, and 43 mph on the 20th. Vernon Township came in with a 40 mph gust on the 22nd and 43 mph on the 24th. HPM reached 51 mph and Vernon Township 44 mph on the 25th.
Temperature
There were nine February days when the temperature at one or more Rutgers NJ Weather Network stations topped out at or above 50°. The first occurrence included seven stations reaching 53° on the 5th, with 28 of the 63 NJWxNet stations from 50°–52°. Five stations made it to 51° on the 6th. The 9th had a high of 50° at Cape May Court House (Cape May), while HPM only made it to 24°. A week later on the 16th, Woodbine reached 59°, Mullica (Atlantic) and Hammonton (Atlantic) got to 58°, 17 locations from 55°–57°, and 28 from 50°–54°. Another week passed before five stations peaked at 53° and 24 from 50°–52° on the 23rd. The 24th was the warmest day of February with Sicklerville (Camden) reaching 60°, five sites at 59°, 31 from 55°–58°, and 21 from 50°–54°. Even HPM made it to 47°. Cape May Court House got to 56° and 38 stations from 50°–54° on the 25th. Mullica and Vineland (Cumberland) were 50° on the 26th. It was interesting at this time of the year with nearby cool ocean and bay waters to find the maximum temperature list topped by Point Pleasant (Ocean), Sea Girt, and Toms River (Ocean), with each reporting 59° on the 27th. Southwest winds and the absence of snow cover in south Jersey helped this cause, and led to 19 other stations reaching 55°–59° and 23 getting to 50°–54°.
Low temperatures dropped to 15° or lower at one or more NJWxNet stations on 16 February days. Discussed here are eight of those days where lows of 10° or lower were observed. This began with the coldest day of the month on the 8th, when Walpack (Sussex) and Sandyston (Sussex) each fell to 1°. Basking Ridge (Somerset) was 3°, and 11 stations had lows from 4°–10°. Hillsborough-Duke (Somerset) was coldest at 4° on the 9th, followed by Hopewell Township (Mercer) at 5°, and six locations from 6°–10°. Atlantic City Marina only made it down to 33° that morning. Kingwood (Hunterdon) was 4° and Pequest (Warren) and Hopewell Township 5° on the 10th. Walpack fell to 1° and Sandyston 4° on the 12th, with HPM at 8° and four locations at 10° on the 13th. HPM had lows of 10° on the 17th and 20th. The 21st saw the temperature fall to 3° at Walpack, 6° at Pequest, and 8° at Sandyston.
Winter Overview
The statewide average winter (December–February) temperature of 34.3° was 0.2° above the 1991–2020 normal and ranks as the 29th warmest of the past 126 winters. It included positive departures of 0.4° and 1.9° in December and January, respectively, and a 1.7° negative departure in February. The coldest winter temperature was -5° at Walpack on December 19th. The warmest temperature was 67° both at West Creek (Ocean) on December 13th and West Deptford (Gloucester) on December 25th.
Winter precipitation (rain and melted snow) averaged 12.28” across New Jersey. This is 1.66” above average and ranks as the 27th wettest winter. December with 5.40” (+1.13”) ranked 21st wettest, January’s 1.99” (-1.50”) made it the 13th driest, with February at 4.89” (+2.03”) 14th wettest.
Snowfall was 29.9”, which is 9.9” above average. December saw 5.2” (+0.9”) fall, January was almost a shut out with just 1.1” (-6.0”), and February a substantial 23.5” (+15.3”).
For those seeking more detailed information on 5-minute, hourly, daily, and monthly conditions, please visit the following Office of the NJ State Climatologist's websites:
Rutgers NJ Weather Network
NJ Community Collaborative Rain, Hail and Snow Network
NJ Snow Event Reports
Interested in receiving our monthly summaries at the end of each month? Send us your e-mail address here to join the mailing list.
Past News Stories

