Winter Arrives Early, Record Wet Fall: November 2018 and Fall 2018 Recaps
New Jersey State Climatologist
Center for Environmental Prediction, School of Environmental and Biological Sciences/NJAES, Rutgers University
December 5, 2018
November Overview
November weather packed quite a punch, putting an exclamation point on what will go into the book as the wettest Fall (September–November) on record (since 1895). With seven storms that each deposited an inch or more of rain (or melted snow) at numerous locations, this was the second wettest November (Table 1). The statewide average of 8.77” was 5.16” above the 1981–2010 average. The record will remain 9.01” in 1972.
| Rank | Year | Nov. Avg. Prcp. |
|---|---|---|
| 1 | 1972 | 9.01" |
| 2 | 2018 | 8.77" |
| 3 | 1977 | 7.49" |
| 4 | 1932 | 7.44" |
| 5 | 1963 | 6.74" |
| 6 | 1898 | 6.60" |
| 7 | 1951 | 6.45" |
| 8 | 1988 | 6.40" |
| 9 | 1986 | 6.33" |
| 10 | 1983 | 6.21" |
Table 1. The ten wettest Novembers across NJ since 1895.
One of the largest early-season snowstorms on record delivered significant impacts to all but southeastern NJ on the 15th. This event alone resulted one of the snowiest Novembers on record. Statewide, the monthly snowfall was 4.1”, which is 3.3” above average and ranks as the 6th snowiest since 1895 and the snowiest since 1989. With 7.4” in the north (Sussex, Passaic, Bergen, Warren, Morris, Essex, and Hudson counties), it was the snowiest November since 1938 and 3rd most on record. Central NJ (Hunterdon, Somerset, Union, Middlesex, Mercer, and Monmouth counties) received 4.8” (+3.9”), the 5th snowiest on record and most since 2012. The south (Burlington, Ocean, Camden, Gloucester, Atlantic, Salem, Cumberland, and Cape May counties) averaged 2.0” (+1.4”), the 10th snowiest and most since 2012.
The wind howled on numerous occasions, as the barometer exhibited rapid, wide swings resulting from powerful high and low pressure systems traversing the eastern US. One or more NJWxNet stations recorded a gust of 40 mph or higher on 14 days, including eight days over 50 mph.
Following six consecutive months with above-average conditions, the statewide November temperature averaged 42.7°. This is 2.5° below normal and ranked as the 54th coolest of the past 124 years. All NJWxNet stations reached the freezing point for the first time in the season by November 12th. The biggest temperature story of the month was the exceptional cold on Thanksgiving (11/22), followed by record cold for so early in the season at some locations on the 23rd.
Precipitation and Storms
Monthly precipitation (rain and melted snow) at almost 250 CoCoRaHS and NJWxNet stations was as high as 11.59” at Mine Hill Township (Morris County). Other large totals include West Milford (Passaic) 11.55”, Jefferson Township (Morris) 11.26”, Egg Harbor Township (Atlantic) 11.16”, and Bethlehem Township (Hunterdon) and Greenwich (Warren) each with 11.02”. Totals between 10.00”–10.99” were achieved at 31 stations and between 9.00”–9.99” at 73 other sites. On the low end, West Cape May (Cape May) saw 5.94”, Middle Township (Cape May) 7.15”, Sea Isle City (Cape May) 7.29”, Lower Township (Cape May) 7.46”, Monroe Township (Gloucester) 7.61”, and Winslow Township (Camden) 7.80”. Even these “driest” stations had close to twice-normal totals, while some of the wetter spots were close to three times the norm. This spread is not all that large, and is much lower than often found during summer months when rainfall is frequently deposited in localized heavy events, such as witnessed many times earlier this year.
November snowfall totals were solely delivered by the November 15th–16th event, with the exception of Montague (Sussex) where 0.2” also accumulated in a squall on the 10th. Top monthly values included 12.8” at Montague, Wantage (Sussex) 11.4”, Highland Lakes (Sussex) 10.9”, Bethlehem Township 10.0”, and 9.0” at four stations in Hunterdon, Morris, and Warren counties.
The first storm of the month saw rain move from south to north through the state, beginning on the evening of the 2nd and lasting until about dawn on the 3rd. Totals exceeded 2.00” in the northwest, tapering off to a third to half an inch along the coast (Figure 1). Two West Milford stations took top honors with 3.96” and 3.84”, followed by Phillipsburg (Warren) with 3.72”, Jefferson Township (Morris) 3.64”, and Andover (Sussex) 3.54”. Of the more than 200 CoCoRaHS stations reporting, 16 had totals exceeding 3.00”, 28 from 2.00”–2.99”, and 50 from 1.00”–1.99”. Street flooding occurred in a number of locations, something that reoccurred in the subsequent six November storms. As the rain moved away, winds gusted to 40 mph or higher on the 3rd at nine NJWxNet locations. This included Pennsauken (Camden) 57 mph, High Point Monument (HPM; Sussex) 55 mph, Columbus (Burlington) 44 mph, Sea Girt (Monmouth) 42 mph, and four stations from 40 mph–41 mph.
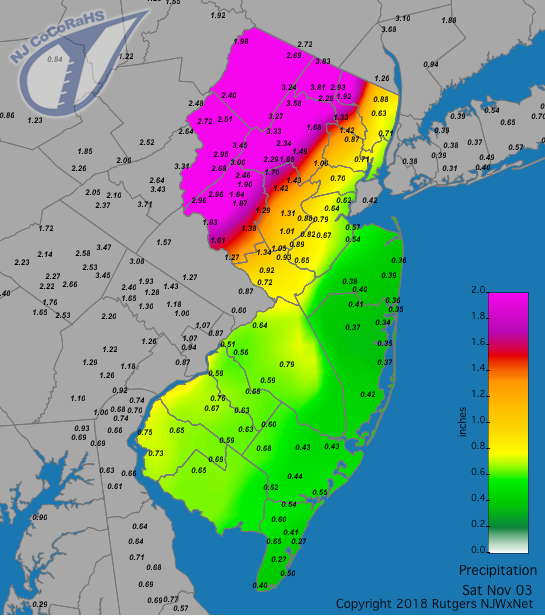
Figure 1. Rainfall from approximately 7 AM on the 2nd to 7 AM on the 3rd. Observations are from CoCoRaHS stations.
Next up was a lengthy event from pre-dawn on the 5th into the late afternoon of the 6th that saw most of the rain falling during the daylight hours of each day, with drizzle at night. The distribution of rainfall was quite even throughout NJ, with 149 of the 205 CoCoRaHS stations reporting receiving from 0.75”–1.24”. Another 41 caught from 1.25”–1.99”. Riverton (Burlington) received 2.23”, Cinnaminson (Burlington) 2.00”, Salem (Salem) 1.87”, and Hamilton (Mercer) 1.82”.
The third storm of the month arrived during the afternoon of the 9th, ending after midnight on the 10th. Heaviest rains fell during the evening rush hour. This was followed by gusty winds and, for many areas, the first snow flurries of the season during the daylight hours of the 10th. Again, rainfall was rather uniformly distributed, with 171 stations receiving between 0.75”–1.24”, 22 from 1.25”–2.10”, and 17 from 0.55”–0.74”. Along the south coast, Lacey Township (Ocean) caught 2.10”, followed by Linwood (Atlantic) 1.97” and two Galloway Township (Atlantic) stations with 1.83” and 1.77”. Rockaway Township (Morris) received just 0.55”. Winds gusted to 49 mph at HPM, 47 mph at Fortescue (Cumberland), 44 mph in Lower Alloways Creek Township (Salem), and 40 mph–42 mph at four other sites. Trees and wires were reported down in scattered locations. Much like localized flooding, these impacts were common during most storms this month, but never got significantly out of control.
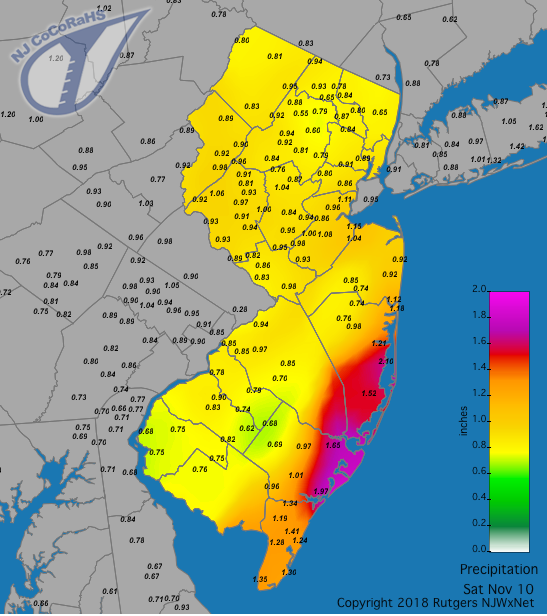
Figure 2. Rainfall from approximately 7 AM on the 9th to 7 AM on the 10th. Observations are from CoCoRaHS stations.
Rain again arrived in the south and worked its way north late on the 12th, with the storm delivering moderate rain into the morning of the 13th. Keeping with the distribution theme of the month, 152 stations received from 0.75”–1.24”, with 47 from 1.25”–1.99”. Middle Township saw the least with 0.56”, while stations just up the coast in Stafford Township (Ocean) collected 1.99”, 1.88”, and 1.84”. Two Galloway Township locations saw 1.77” and 1.83” accumulate. The wind gusted to 44 mph at HPM on the 13th and to 50 mph on the 14th, ushering colder air into the state and setting the scene for the next event.
Unfortunately, that storm brought several traffic deaths and considerable inconvenience to many state residents. Few were prepared for the ramifications of a fast moving storm that began with a multi-inch “thumping” of snow that quickly accumulated on roadways from late morning through the afternoon hours of the 15th. The snow raced northward up the NJ Turnpike from Salem County, and within a few hours enveloped all of central and northern NJ. Only the slightly warmer southeast was spared the snow, sleet, and freezing rain, receiving just heavy rain. The timing could not have been worse for road conditions to so rapidly deteriorate, resulting in afternoon commutes from work and school that lasted for many hours. Would that forecast models were able to predict well in advance such rapid escalation of storm impacts, however, this remains a challenge. Adding to the situation was the unseasonable nature of this first winter storm.
Snowfall exceeded 4.0” in 16 of the state’s 21 counties, with the largest totals in the northwest hills (Figure 3 and Table 2). Montague saw the most, with 12.6” accumulating. Other totals are found as monthly snow numbers earlier in this section and in the table (a complete list of totals may be found here). Rain and melted snow amounted to as much as 2.31” in Cranford (Union), 2.30” at Jackson Township (Ocean), and 2.12” in Matawan (Monmouth). Seven CoCoRaHS stations measured between 2.00” –2.31”, 171 from 1.00” –1.99”, and only four were lower, each from 0.96”–0.98”.
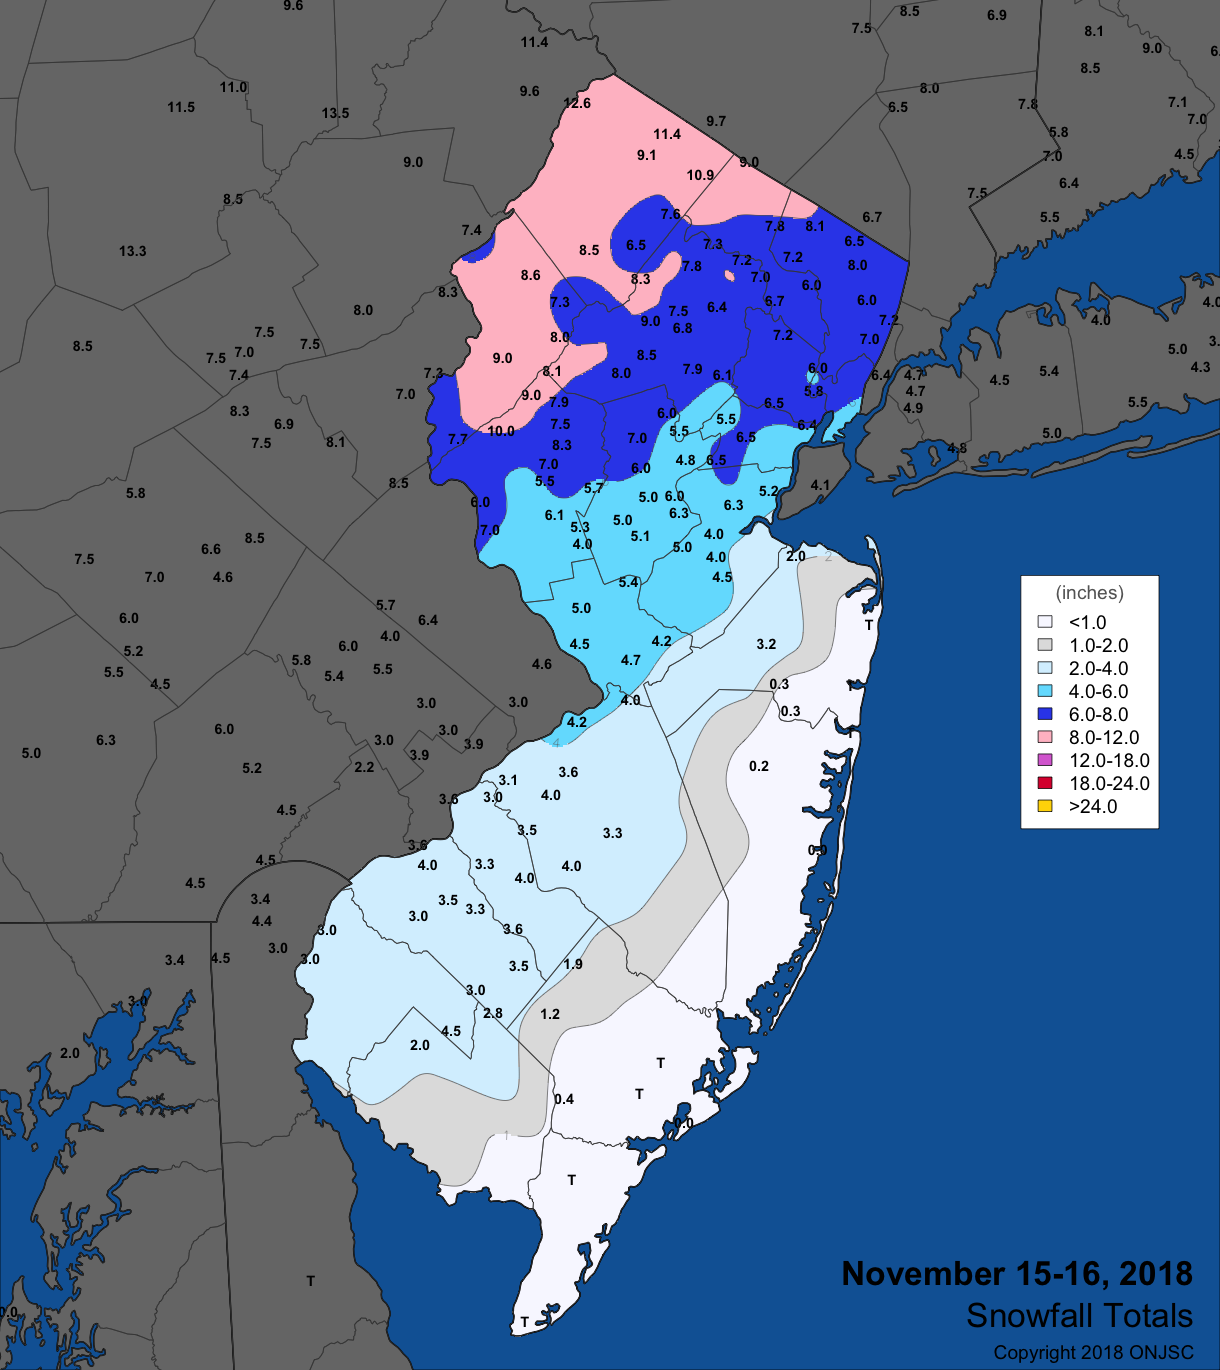
Figure 3. Snowfall totals for November 15th–16th.
| County | Location | Snowfall |
|---|---|---|
| Bergen | Ramsey | 8.1” |
| Burlington | Burlington & Florence | 4.2" |
| Camden | Merchantville | 4.5” |
| Essex | Cedar Grove | 7.2” |
| Gloucester | West Deptford | 4.0” |
| Hudson | Harrison | 5.8” |
| Hunterdon | Bethlehem | 10.0” |
| Mercer | Princeton | 5.4” |
| Middlesex | Edison | 6.3” |
| Morris | Kinnelon & Mine Hill | 9.0” |
| Passaic | Ringwood | 7.8” |
| Salem | Pittsgrove | 4.5” |
| Somerset | Peapack-Gladstone | 7.5” |
| Sussex | Montague | 12.6” |
| Union | Plainfield & Westfield | 6.5” |
| Warren | Oxford & White Township | 9.0” |
Table 2. Largest snowfall in the 16 NJ counties where totals on November 15th–16th equaled or exceeded 4.0”.
As the storm began to depart, winds began howling along the coast and, later, inland. Evening gusts on the 15th rose to 61 mph at Seaside Heights (Ocean), Fortescue 59 mph, Harvey Cedars (Ocean) 58 mph, and Sea Girt 55 mph. Gusts peaked from 40 mph–49 mph at 16 NJWxNet stations and 30 mph–39 mph at 18 other sites. On the 16th, gusts rose to 57 mph at Seaside Heights and Harvey Cedars, with Sea Girt up to 56 mph, Lower Alloways Creek Township (LACT; Salem) 51 mph, Point Pleasant (Ocean) 50 mph, and 40 mph–49 mph at 12 other stations. The early onshore winds resulted in an overnight high tide that just reached moderate flood stage at Sandy Hook (Monmouth) and minor stage at Atlantic City (Atlantic). On the windy backside of the storm a snow squall on the morning of the 16th in Randolph Township (Morris) was accompanied by lightning and thunder.
The wettest storm of the month followed closely on the heels of the short-lived Thanksgiving frigid spell. Just two days after the holiday, another powerful storm system moved into the state, depositing the heaviest rain from the evening of the 24th into the early hours of the 25th. Most every reporting station collected over an inch of rain, with 19 sites surpassing the 3.00” mark, 118 catching 2.00”–2.99”, and 62 from 1.00”–1.99” (Figure 4). An impressive 4.66” fell in Jackson Township, followed by Manchester Township (Ocean) 3.63”, Red Bank (Monmouth) 3.54”, and 3.52” in both Southampton (Burlington) and Freehold (Monmouth). Thunder briefly accompanied the rain in some central NJ locations. With the ground so saturated, it didn’t take much time to fill a number of streams and rivers, with resultant minor to localized moderate flooding.
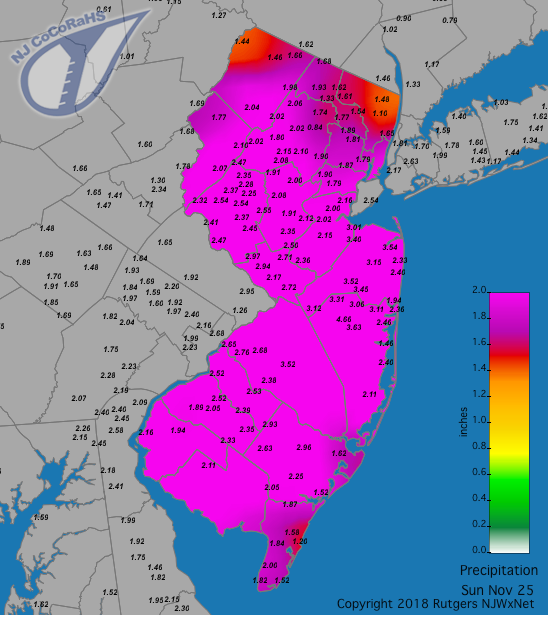
Figure 4. Rainfall from approximately 7 AM on the 24th to 7 AM on the 25th. Observations are from CoCoRaHS stations.
As the low pressure system deepened as it traveled up the Jersey coast, winds became quite strong. Late in the evening on the 24th, gusts reached 61 mph at Harvey Cedars, Seaside Heights 53 mph, Sea Girt 48 mph, and eight stations from 41 mph–46 mph. The peak gust early on the 25th was an extreme 71 mph at Harvey Cedars, with Seaside Heights up to 50 mph and five stations between 40 mph–47 mph.
There was little rest for the waterlogged weary, and for state water bodies, with the final storm of the month invading the south during the morning of the 26th and making it north by early evening. Yet again, there was a quite uniform distribution of rainfall across NJ, with 172 CoCoRaHS stations receiving from 0.75”–1.24” and 15 from 1.25”–1.81” (Figure 5). Only 29 sites caught less than 0.75”. This continued the earlier flooding in some locations. Top totals included 1.81” and 1.71” at two Long Branch (Monmouth) stations, two Brick Township (Ocean) sites with 1.66” and 1.63”, and Ocean Township (Monmouth) with 1.65”. Winds associated with the storm and its aftermath gusted to 41 mph at both HPM and Harvey Cedars on the 26th and to 47 mph at HPM, 42 mph at Logan Township (Gloucester), and 40 mph in LACT on the 27th. The strong gusts held on during the 28th, gusting to 47 mph at LACT, Seaside Heights and Fortescue each 47 mph, from 40 mph–45 mph at 14 stations, and 30 mph–39 mph at 26 sites. HPM managed a 49 mph gust on the 29th.
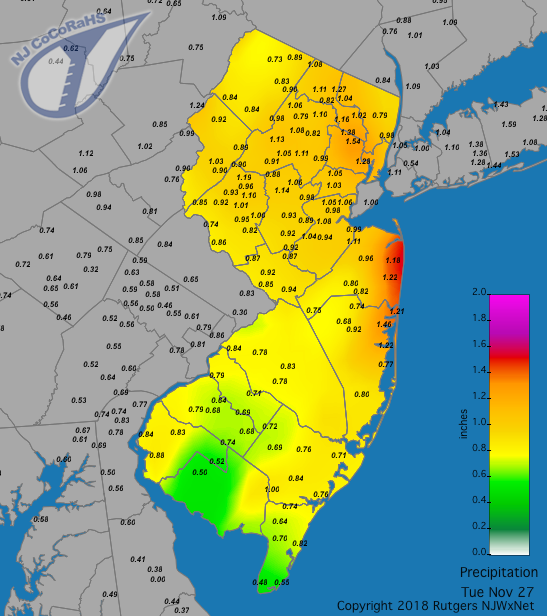
Figure 5. Rainfall from approximately 7 AM on the 26th to 7 AM on the 27th. Observations are from CoCoRaHS stations.
Two strong high pressure systems during the month saw barometers peak at 30.55”–30.65” on the 14th–15th and 22nd–23rd. Wedged between these occurrences was the low on the 16th that saw pressures down to near 29.30” along the coast and 29.50” in the northwest. Later, on the 26th, the pressure bottomed out at 29.30”–29.45”.
To exemplify the abundant November flow of streams and rivers across NJ, a time series of gage height at Griggstown on the Millstone River in southern Somerset County is shown in Figure 6. The seven November storms, along with the first one in December, can be seen. This includes a slight delay as the snow melted following the storm on the 15th and a double peak is seen in the significant flooding that occurred from the back-to-back storms later in the month. The Millstone crossing at this location is particularly susceptible to flooding and closure, which occurs when the river rises to near “alarm” stage (green line), something seen on multiple occasions in November. The Blackwells Mills (Somerset) gage several miles downstream from Griggstown recorded above normal streamflow on each day of the month, peaking at approximately 7000 cubic feet per second late on the 25th. This is well above the average November flow of 200 feet per second.
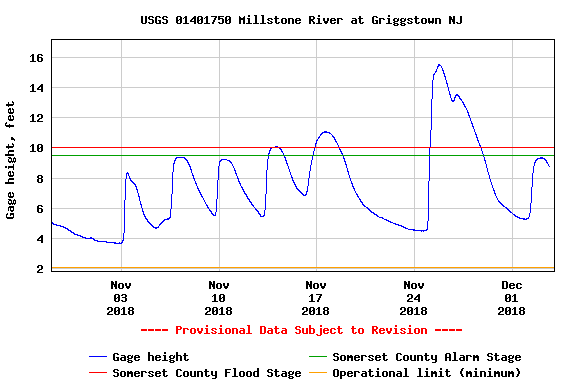
Figure 6. US Geological Survey stream gauge trace on the Millstone River at Griggstown from October 29th–December 3rd.
Temperature
While November began on the warm side of the ledger, following the first week of the month, the thermometer only rose above 60° on two other days. November 1st was a “scorcher”, with the afternoon temperature rising to 77° at Toms River (Ocean), 76° in Howell (Monmouth), 75° at 14 other NJWxNet stations, and 70°–74° at 36 others. Fortescue was coolest at 64°. It wasn’t quite a repeat performance on the 2nd, however West Deptford (Gloucester) hit 74°, 11 stations got to 73°, and 34 others were from 70°–72°. HPM only made it to 62°. Cooler air invaded NJ on the 3rd, but not before Cherry Hill (Camden), Moorestown (Burlington), and New Brunswick (Middlesex) each rose to 69°. Meanwhile, HPM only made it to 52°.
Warmth returned on the 6th, with Woodbine (Cape May) at 69° and Hammonton (Atlantic) and Oswego Lake (Burlington) each up to 68°. The 7th found Egg Harbor Township (Atlantic), Oswego Lake, and West Creek (Ocean) reaching 67°. Mild conditions briefly returned on the 13th along the coast, with Atlantic City Marina reaching 63°, and Cape May Court House (Cape May), Egg Harbor Township, and Woodbine all topping out at 62°.
Enough mild air invaded southern NJ on the 25th to raise the temperature to 61° at Mansfield (Burlington) and 60° in both Egg Harbor Township and Sewell (Gloucester).
Once cold air arrived on the 9th, it didn’t relinquish its grip through the 24th. During that 16-day interval, the minimum temperature fell to 25° or colder at one or more NJWxNet locations on 12 days. On the 9th, Walpack (Sussex) dropped to 25°, with that mark equaled at Berkeley Township (Ocean) on the 10th. Pequest (Warren) bottomed out at 21° and Berkeley and Walpack each 22° on the 11th, with only LACT and West Cape May, each 33°, failing to reach the freezing point among the 64 NJWxNet stations. These latter two stations fell to 32° and 30°, respectively, on the 12th, making them the last NJWxNet stations to reach the freezing mark this fall. The 12th also saw Walpack down to 19° and Berkeley Township 20°, however Atlantic City Marina (Atlantic) was a milder 38°. HPM fell to 21° and High Point (Sussex) to 22° on the 14th, with the high temperature at these elevated locations only 29° and 31°, respectively. This marked the first day of the season where an NJWxNet station failed to eclipse the freezing point. The 15th brought lows of 19° at HPM and 20° at High Point, along with five stations at either 24° or 25°. HPM and High Point fell to 24° on the 16th. Berkeley Township took low honors with 25° on the 18th.
A strong polar high pressure system charged into the region on the 21st, with lows before midnight falling to 15° at HPM, High Point 16°, and Charlotteburg (Passaic) 21°. Afternoon and evening gusts reached 53 mph at HPM and 40 mph in Moorestown (Burlington). Thanksgiving Day (22nd) also saw the coldest temperatures of the day late in the evening, with HPM dropping to 5°, High Point 7°, and Walpack 10°. Lows were between 12°–19° at 39 stations. This was the first day of the season where every station in the state had a subfreezing minimum, the “mildest” being 22° in LACT.
Minimum temperatures the morning of the 23rd ranged from 3° at HPM, High Point, and Walpack, to 19° at Atlantic City Marina (Figure 7). Pequest fell to 4° and 17 stations were from 6°–10°. This made for one of the coldest statewide mornings for so early in the season dating back more than a century. Add to that the misery of winds gusting as high as 50 mph at HPM and it was a frigid morning, even by mid-winter standards. The New Brunswick, Charlotteburg, and Atlantic City Marina NJWxNet stations are co-located with long-term National Weather Service Cooperative Observing Stations, thus permitting this cold to be placed in historic perspective. The 9° minimum in New Brunswick was 8° below the previous record low for November 23rd, and marked the earliest single-digit low of the season at this station, based on records back to 1912. Prior to the 23rd, a 13° low on November 18, 1924, was the coldest achieved. The only other single-digit November minimum at New Brunswick was 6° on November 26, 1938. Charlotteburg fell to 7°, surpassing the previous record of 11° in 1949. Records at this Highlands location date back to 1893. On November 15, 1905, the temperature fell to 6° at this location, thus the low on the 23rd marks the second coldest minimum for so early in the season. Atlantic City Marina records extend back to 1874, and it wasn’t much past that year that a record November 23rd minimum of 12° was achieved in 1880. This is well below the 19° this year on the 23rd. There have been four days earlier than the 23rd with lows below 19° at this coastal location, the earliest being 17° on November 16, 1933. The minimum in the state on the 24th was 16° at Hopewell Township (Mercer), with four stations down to 18°. Wet and somewhat milder conditions followed for the remainder of November, with lows not reaching 25° or lower.
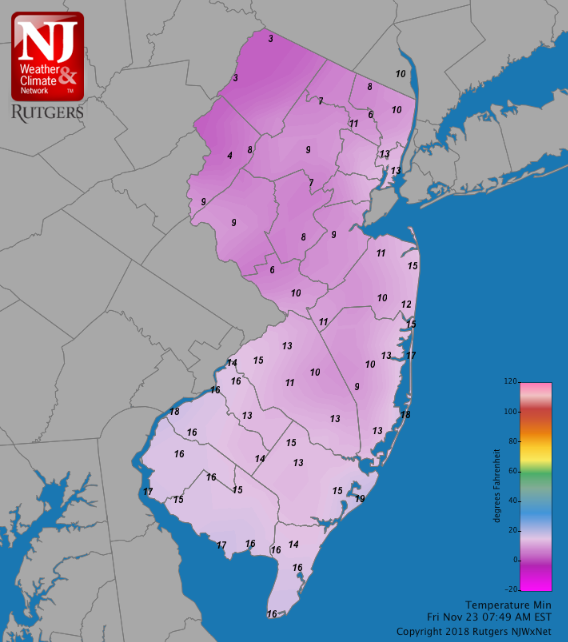
Figure 7. Minimum temperatures at NJWxNet locations on November 23rd.
Fall Recap
Laying claim to the 8th wettest September on record, slightly above average rainfall in October, and the 2nd wettest November, it should come as no surprise that fall 2018 will go into the record book as the wettest in 124 years of statewide observations. The 20.67” total is 9.12” above average and exceeds the previous 2006 record by an impressive 2.67” (Table 3).
| Rank | Year | Fall Avg. Prcp. |
|---|---|---|
| 1 | 2018 | 20.67" |
| 2 | 2006 | 18.00" |
| 3 | 1907 | 17.81" |
| 4 | 2005 | 17.10" |
| 5 | 1972 | 16.55" |
| 6 | 1935 | 16.48" |
| 7 | 1977 | 16.35" |
| 8 | 1995 | 16.15" |
| 9 | 1944 | 16.01" |
| 10 | 2002 | 15.79" |
Table 3. The ten wettest NJ Fall seasons (Sep.–Nov.) since 1895.
Everywhere in the state experienced well above-average precipitation, though the spread between wettest and driest locations exceeded 12.00”. Southampton took top honors with 29.51”, followed by Andover Township (Sussex) 27.26”, Stafford Township 27.24” and 25.68”, Ocean Township (Monmouth) 26.42”, and Brick Township 25.36”. A station in Franklin Township (Somerset) saw the least precipitation but still caught 17.32”, Lower Township came in at 17.34”, Florham Park (Morris) 17.85”, Madison 18.51”, and Winslow Township 18.64”.
Despite the recent November cold, with September the 3rd warmest and October above average, fall 2018 came in as the 15th warmest on record. The 56.5° mean was 1.3° above normal. However, it was the coolest autumn since 2014, as 2015, 2016, and 2017 ranked 2nd, 7th, and 6th warmest, respectively. Eight of the 15 warmest falls over the past 124 years have occurred since 2005.
For those seeking more detailed information on 5-minute, hourly, daily and monthly conditions, please visit the following Office of the NJ State Climatologist's websites:
Rutgers NJ Weather Network
NJ Community Collaborative Rain, Hail and Snow Network
NJ Snow Event Reports
Interested in receiving our monthly summaries at the end of each month? Send us your e-mail address here to join the mailing list.
Past News Stories

