True Fall Colors: October 2022 Recap
New Jersey State Climatologist
Center for Environmental Prediction, School of Environmental and Biological Sciences/NJAES
Rutgers University
November 7, 2022
Overview
There are years when many say that New Jersey didn’t experience “classic” fall weather. This October is not one of those years, as the month included rain, wind, and coastal flooding from the persistent remnants of a hurricane, many locations received their first frost and freezing temperatures to end the growing season, and there were days with a cloud-free deep-blue sky. October certainly showed its true fall colors.
October temperatures averaged 54.1° across NJ. This is 1.3° below the 1991–2020 normal and was the coolest October since 2009. It was the 57th coolest (tied with 4 other years) of the 128 since 1895. The average high was 64.5° which is 1.3° below normal and is the 48th coolest (tied with 3 years). The average low of 43.6° is 1.3° below normal and ranks 65th coolest (tied with 4 years). Northern NJ averaged 52.1° (-1.2°, 59th coolest [tied with 2 years]), southern 55.1° (-1.4°, 56th coolest [tied with 3 years]), and coastal 56.6° (-1.0°, 70th coolest [tied with 1 year]).
Rainfall was abundant, averaging 6.45” statewide. This is 2.26” above normal and ranks 10th wettest on record (Table 1). It was the wettest since the record October 2005. Ten different decades are found in the top 15 years. The north averaged 5.88” (+1.43”, 21st wettest), south 6.75” (+2.72”, 6th wettest), and coast 7.53” (+3.44”, 3rd wettest). Coastal Monmouth, Ocean, and Atlantic counties were wettest, coming in at two to three times normal totals. While coming in close to normal, the driest areas were in the north central, far southern, and southwest regions (Figure 1).
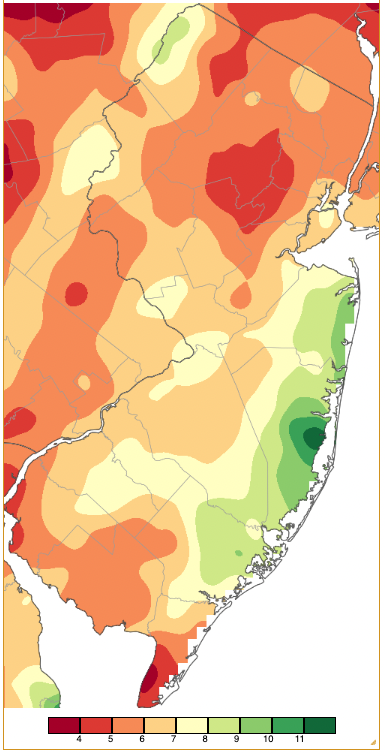
Figure 1. October 2022 precipitation across New Jersey based on a PRISM (Oregon State University) analysis generated using NWS Cooperative and CoCoRaHS observations from 8 AM on September 30th to 8 AM on October 31st. Note the scale in full inches at the bottom of the map. Totals range from 3.00–4.00” (dark red) to 12.00”–13.00” (dark green).
| Rank | Year | Oct. Avg. Precip. |
| 1 | 2005 | 11.99” |
| 2 | 1903 | 8.12” |
| 3 | 1927 | 7.25” |
| 4 | 1943 | 7.24” |
| 5 | 1955 | 7.02” |
| 6 | 1919 | 7.02” |
| 7 | 1913 | 6.94” |
| 8 | 1995 | 6.86” |
| 9 | 2002 | 6.74” |
| 10 | 2022 | 6.45” |
| 11 | 1996 | 6.34” |
| 12 | 2006 | 6.28” |
| 13 | 1976 | 6.21” |
| 14 | 1902 | 6.06” |
| 15 | 1932 | 5.92” |
Table 1. The 15 wettest Octobers across NJ since 1895.
Precipitation and Storms
Evidence of just how wet October was can be seen in monthly totals from NJ CoCoRaHS and Rutgers NJ Weather Network stations. Berkeley Township (Ocean County) topped the list with 12.45”, followed by Lacey Township (Ocean) with 12.43”, Wall Township (Monmouth) 11.22”, Ocean Township (Monmouth) 11.08”, Point Pleasant Beach (Ocean) 10.63”, Neptune (Monmouth) 10.58”, Oceanport (Monmouth) 10.56”, and Long Branch (Monmouth) 10.51”. Lowest monthly totals included Franklin (Sussex) at 3.46”, two Lower Township (Cape May) sites with 3.87” and 4.01”, West Cape May (Cape May) 4.09”, Chatham (Morris) 4.14”, two Bernards Township (Somerset) sites with 4.20” and 4.32”, Verona (Essex) 4.29”, Madison (Morris) 4.45”, Lyndhurst (Bergen) 4.51”, and Middlesex (Middlesex) 4.60”.
The first and most notable storm event of the month commenced late on September 30th as the remnants of Hurricane Ian moved into the Mid-Atlantic region. This proved to be a multi-day event as the system stalled and meandered over land and sea into October 5th. Copious rains fell over much of the state. Beginning in the south, the morning of the 1st saw heavy rain fall in much of this area, spreading to central locales in the PM hours. Heavy rain returned to the south overnight into the 3rd and then was on and off across most of NJ during the day and evening. The storm system drifted north on the 4th, with rain concentrated in northern and central regions. Thunder accompanied the rain that fell heavily into the early hours of the 5th. By the time the storm departed, as much as 9.60” fell in Lacey Township, Berkeley Township 9.57”, and Long Beach Township (Ocean) 8.72”. Nine CoCoRaHS stations caught 8.00”–9.60”, 36 saw from 6.00”–7.99”, 124 from 4.00”–5.99”, and 112 from 2.00”–3.99”. Westfield (Union) received the least at 2.27” flowed by Hackettstown (Warren) with 2.28”. Figure 2 shows rainfall totals throughout NJ and adjacent states based on reports from multiple networks.
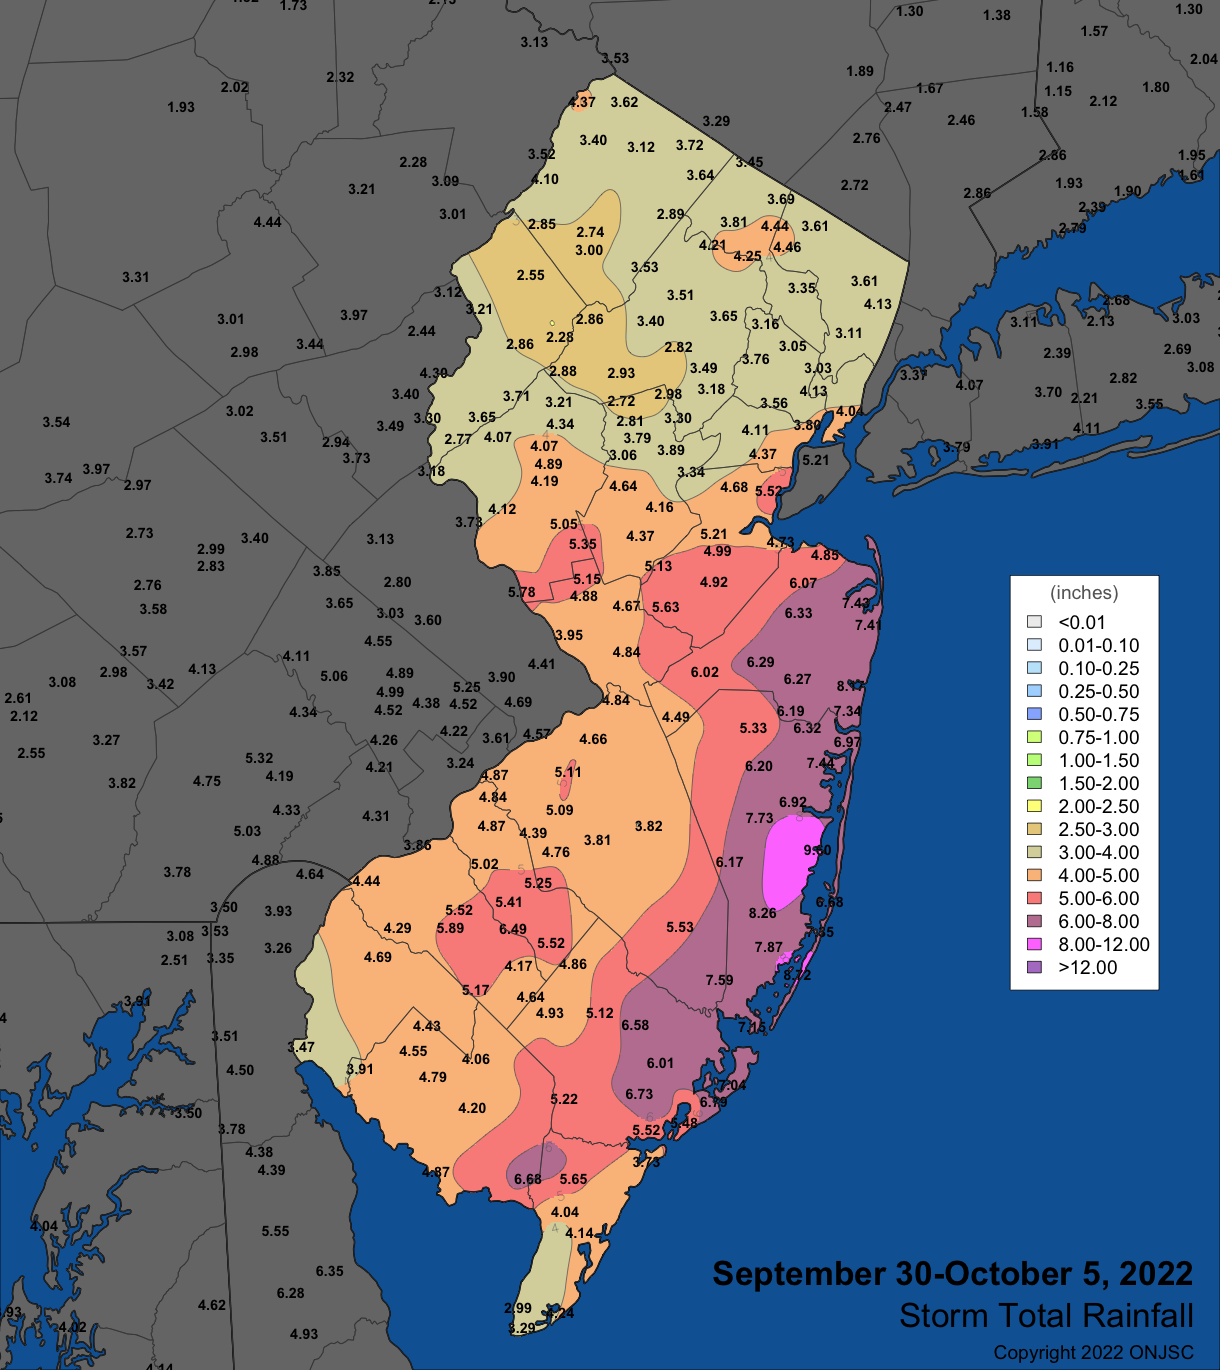
Figure 2. Precipitation across New Jersey from the evening of September 30th through morning of October 5th based on data from NWS Cooperative, CoCoRaHS, and Rutgers NJ Weather Network observations. Note the scale in inches on the map.
The storm was accompanied by persistent strong winds in coastal areas. Wind gusts on the 1st were as strong as 50 mph at Harvey Cedars (Ocean), Atlantic City Marina (Atlantic) 49 mph, Little Egg Harbor Township (Ocean) 44 mph, Sea Girt (Monmouth) and Seaside Heights (Ocean) each 43 mph, and Fortescue (Cumberland) 41 mph. These six stations gusted from 59 mph at Atlantic City Marina to 43 mph in Fortescue on the 2nd. Little Egg Harbor Township led the way at 58 mph on the 3rd, with Fortescue falling below 40 mph while the other four locations hit 49 mph to 45 mph. As winds slowly slackened, the 4th brought gusts to 45 mph in Harvey Cedars, 41 mph at Little Egg Harbor Township, and 40 mph at Sea Girt. The easterly nature of the winds pushed a considerable amount of water onto the beaches and into the back bays. Moderate to minor flooding occurred during multiple high tides from the 1st through the 4th as seen in Figure 3 and there was substantial beach erosion.
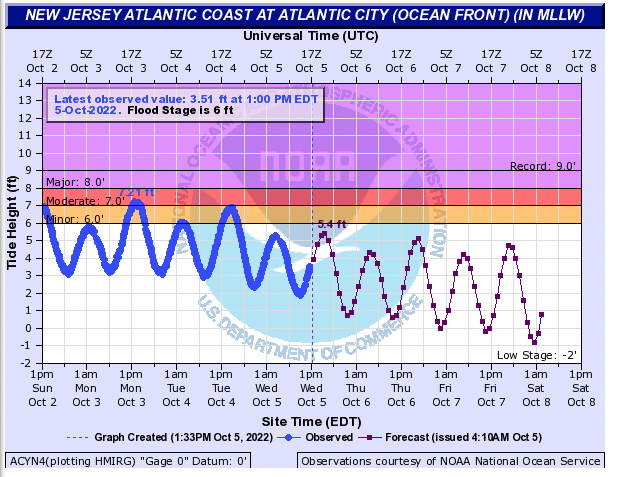
Figure 3. Tide height at the Atlantic City (Atlantic) gauge from 1 PM on October 2nd to 1 PM on October 5th (blue line) and projected heights onward to October 8th (red line). (NOAA National Ocean Service).
As the storm began to subside and started moving out to sea, a visible satellite image on the morning of the 5th shows the persistent cyclonic circulation of the storm (Figure 4). A close up of this image over NJ shows several breaks in the clouds (Figure 5), confirmed by the higher levels of solar radiation reaching the surface in the northeast and far south (Figure 6). This was a welcome end to what was a tumultuous start to the month. Adding insult to injury, high temperatures were upwards of 20° below normal due to the onshore winds and dense clouds.
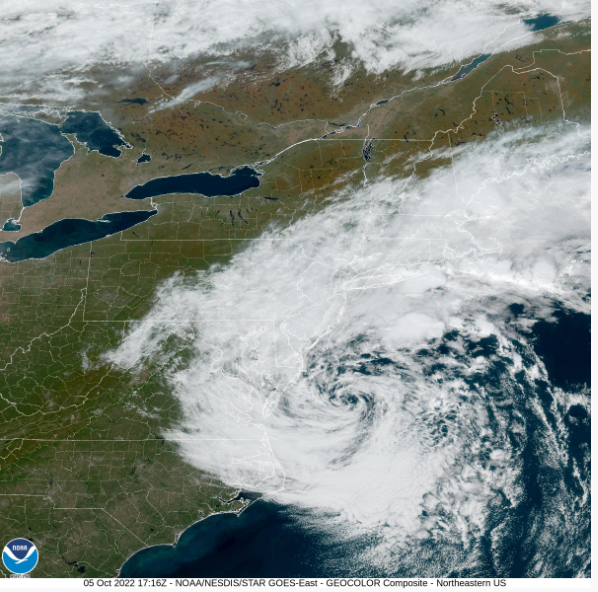
Figure 4. Visible satellite image over eastern North America at 1:16 PM EST on October 5th (NOAA/NESDIS).
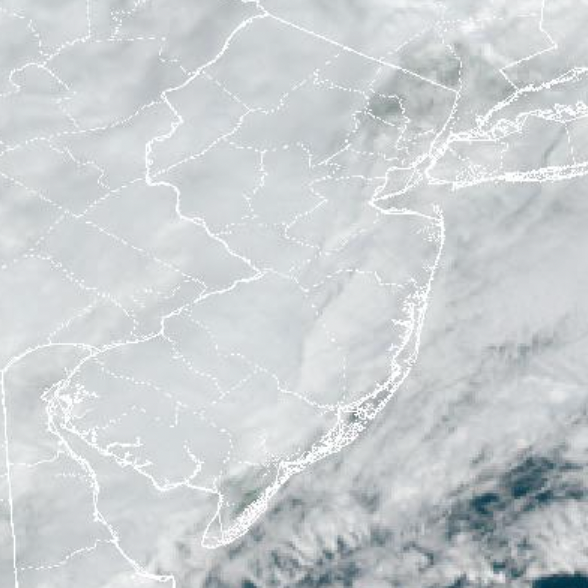
Figure 5. Visible satellite image over New Jersey at 1:16 PM EST on October 5th (NOAA/NESDIS).
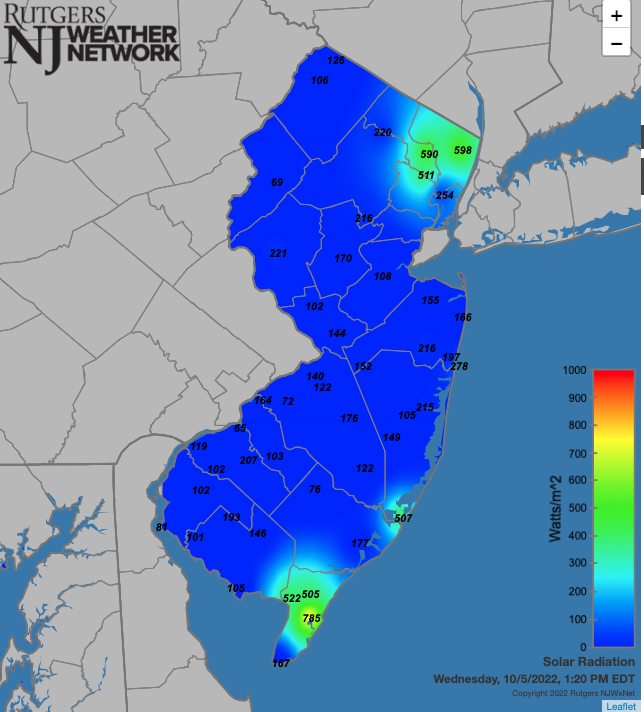
Figure 6. Solar radiation at NJWxNet stations at 1:20 PM EST on October 5th.
Dry conditions prevailed for the next week before another system moved into the state. This time, it was the northwest that received the most rain and the south the least (Figure 7). The bulk of the rain fell during the late afternoon and evening of the 13th, with Knowlton Township (Warren) topping the list with 3.24”, Montague (Sussex) 3.13”, Newton (Sussex) 3.00”, and Blairstown (Warren) 2.93”. Of 275 CoCoRaHS reports, 17 were from 2.00”–3.24” and 60 from 1.00”–1.99”, certainly a much less widespread event than the early-month storm.
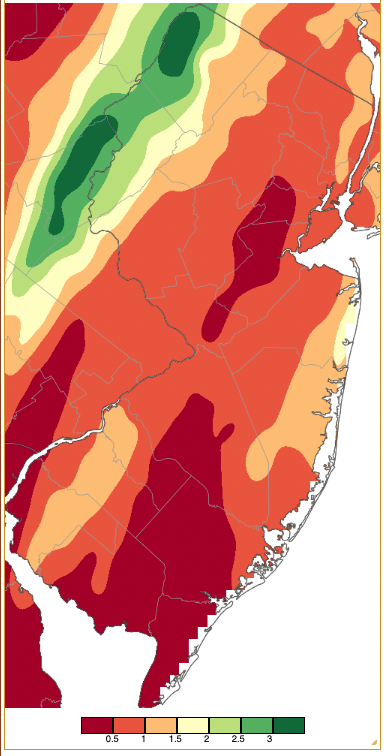
Figure 7. Precipitation across New Jersey from 8 AM on October 12th through 8 AM October 14th based on a PRISM (Oregon State University) analysis generated using generated using NWS Cooperative and CoCoRaHS observations. Note the scale in inches beneath the map.
A modest event preceded and accompanied a late afternoon to evening cold front passage on the 17th. Riverside (Burlington) caught 0.87”, Mansfield (Burlington) 0.77”, and Collingswood (Camden) 0.75”. Cold, dry air followed the front, with the next rain event not occurring until the 23rd. First the south received light daytime and heavy night rain into the early 24th. Later on the 24th more widespread rain brought light to moderate totals to much of NJ. Event totals were as large as 2.81” in Southampton Township (Burlington), Egg Harbor City (Atlantic) 2.37”, Egg Harbor Township (Atlantic) 2.21”, and Sea Isle City (Cape May) 2.18”. 87 stations received 1.00”–2.81” (Figure 8).
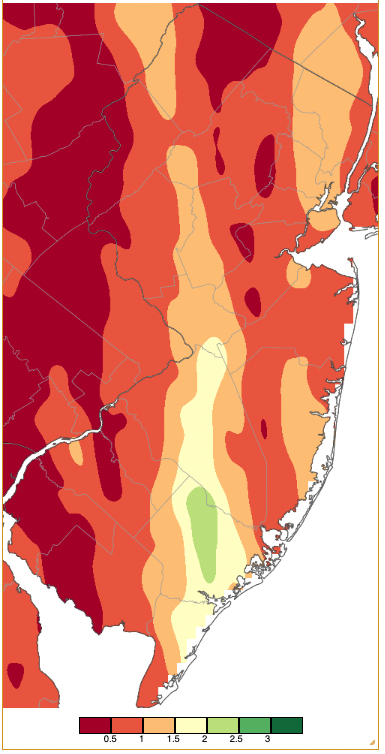
Figure 8. Precipitation across New Jersey from 8 AM on October 23rd through 8 AM October 26th based on a PRISM (Oregon State University) analysis generated using generated using NWS Cooperative and CoCoRaHS observations. Note the scale in inches beneath the map.
The month ended with a little to no rain falling, though fog occurred on multiple mornings, particularly on the 31st when visibility was greatly diminished over scattered areas, particularly in central NJ.
The only day outside of the 1st to 4th where an NJWxNet station had a wind gust exceeding 40 mph was a 45-mph gust at High Point Monument (Sussex) on the 27th. The lowest barometric pressures of the month were not associated with the remnants of Ian. Rather they were from the system that brought a cold front and modest rain through the state on the 17th into early on the 18th. Pressures were in the 29.55”–29.65” range during this event. Highest pressures for the month occurred on the 28th, ranging from 30.45”–30.60” on the 28th.
The wet month put a major dent into drought conditions across the state. The end of September found the National Drought Monitor classifying almost all of the state as being Abnormally Dry (D0), in Moderate Drought (D1), or in Severe Drought (D2; see map in the September report). By the end of October, only the Highlands and the Cape May peninsula were in D1, with surrounding areas and a lingering section of Middlesex and Monmouth counties in D0 (Figure 9). Along with the rainfall, soil moisture and groundwater levels began to rise, as did streamflow and reservoir levels. Still, the NJ Department of Environmental Protection maintained a Drought Watch across all of the state, waiting to be convinced that the extended dry period over the summer and early fall was indeed a thing of the past.
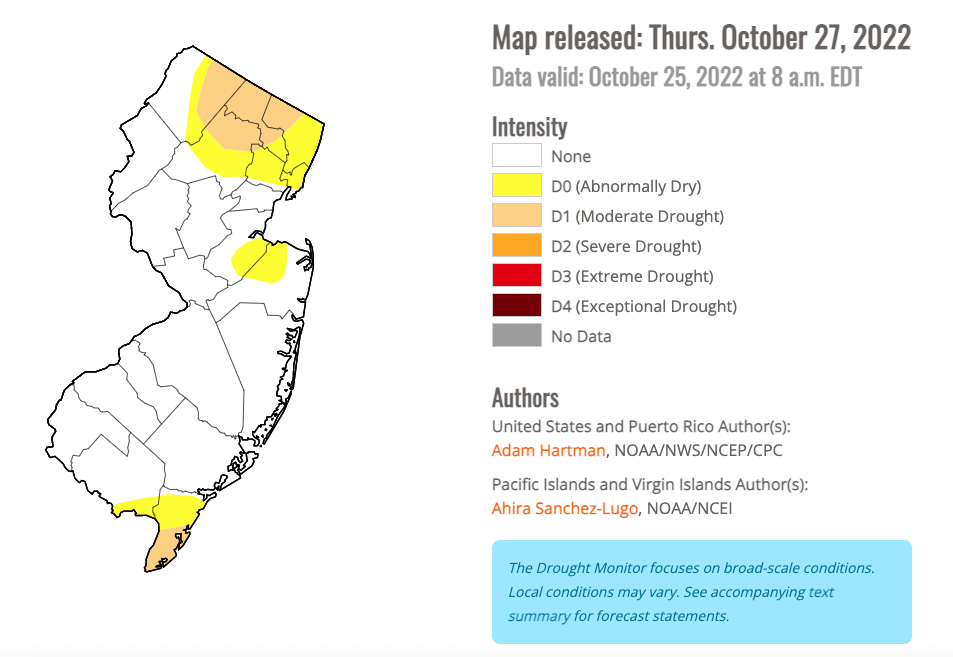
Figure 9. New Jersey portion of the U.S. Drought Monitor map for October 25th.
Temperature
Despite being a somewhat cooler-than-normal month, 14 October days saw daytime highs equal or exceed 70° at one or more NJWxNet station. The first of these was the 6th when 16 stations reached 77° and 45 of the 66 WxNet stations topped out from 70°–76°. The 7th was the warmest day of the month (Figure 10). Moorestown (Burlington) and Point Pleasant (Ocean) rose to 80°, 53 stations were from 75°–79°, and nine from 70°–74°. The coolest location was High Point Monument at 68°. Lower Alloways Creek Township (Salem) and Point Pleasant hit 71° on the 10th. Three stations reached 76° and 53 from 70°–75° on the 11th. Hamilton (Mercer) was 74° and 44 stations from 70°–73° on the 12th. Cream Ridge (Monmouth), Mannington (Salem), and Mansfield got to 72° on the 13th. Continuing the streak of eight straight days of 70° weather, the 14th found 15 locations from 70°–72°, 44 stations were from 70°–74° on the 15th, Lower Alloways Creek Township hit 72° on the 16th, and Moorestown rose to 71° on the 17th.
Next up, the 22nd saw 19 stations hit 70°–71°. The 25th found Howell (Monmouth) at 75° and 24 sites from 70°–73°, the 26th Howell was up to 75° again with 27 locations from 70°–74°, and Howell rose to 70° on the 31st.
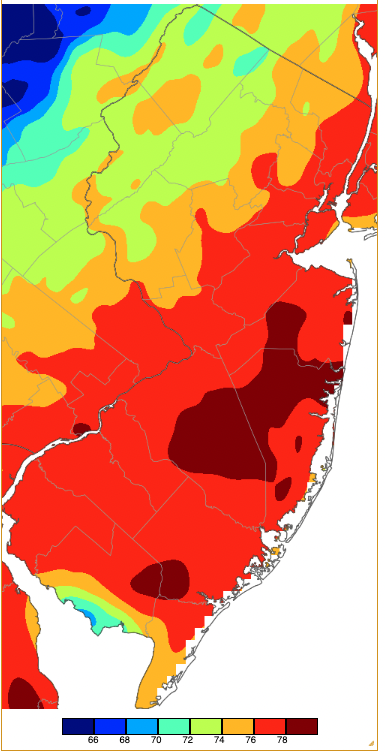
Figure 10. Maximum temperatures on October 7th based on a PRISM (Oregon State University) analysis generated using NWS, NJWxNet, and other professional weather stations. Note the 2-degree increment scale beneath the map.
The first freezing temperatures of the season at NJWxNet locations occurred on the 8th when Walpack (Sussex) and Sandyston (Sussex) each fell to 31° shortly before midnight. The next morning found Sandyston and Pequest (Warren) each bottoming out at 28°, Walpack 29°, and 11 locations from 30°–32°. Meanwhile, West Cape May only fell to 52°. Oswego Lake (Burlington) and Hopewell Township (Mercer) were each 32° on the 10th.
The longest stretch of sub-freezing minimums ran from the 18th to 23rd. The first day saw Walpack reach 29° and seven stations from 30°–32°. The 19th was, statewide, the coldest morning of the month, with Sandyston at 25° and 30 stations from 26°–32° (Figure 11). Fortescue only fell to 48°. Walpack took minimum honors from the 20th–23rd, lows there falling from 26° to 32°. From the 20th–22nd, on each day between 13 to 19 other stations also dipped below freezing.
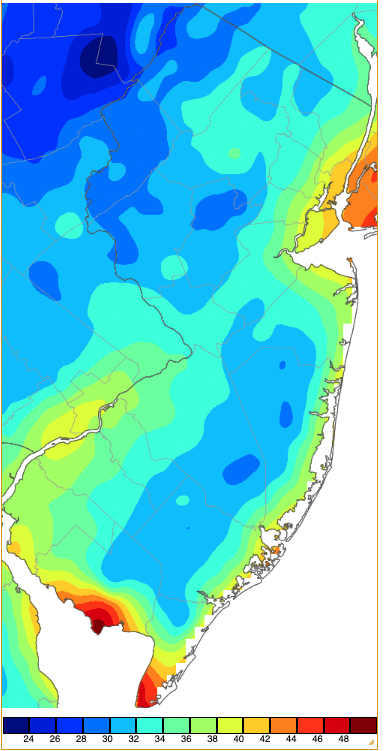
Figure 11. Minimum temperatures on October 19th based on a PRISM (Oregon State University) analysis generated using NWS, NJWxNet, and other professional weather stations. Note the 2-degree increment scale beneath the map.
Sandyston and Walpack were each down to 28° on the 28th, Sandyston 25°, and eight stations from 26°–32° on the 29th. The 30th found the month’s largest difference between minimums when Walpack dipped to 20° while Cape May Court House (Cape May) only fell to 49°. Other subfreezing locations included 22° in Sandyston, Basking Ridge (Somerset) and Pequest 23°, Kingwood (Hunterdon) 25°, and 17 sites from 26°–32°. The 30th saw impressive diurnal ranges of 47° at Walpack (67°/20°), 45° in Basking Ridge (68°/23°), and 45° at Sandyston (68°/23°). The 31st found Walpack at 30° and Basking Ridge and Sandyston each at 32°.
By the end of October, 41 NJWxNet stations had experienced a freeze this fall. Seventeen stations had fallen into the 33°–39° range, while eight coastal locations had the adjacent waters of the Atlantic and Delaware Bay helping keep minimums no lower than the low-to-mid 40°s. Down the coast and into the Bay they include Point Pleasant, Seaside Heights, Harvey Cedars, Little Egg Harbor Township, Atlantic City Marina, West Cape May, Fortescue, and Lower Alloways Creek Township. Of interest inland, the two highest elevation stations in the network, High Point Monument only fell as low as 32° on one day and Vernon Township never dropped below 34°. Also, Parsippany (Morris), near a hilltop in Morris County, only fell to 35°. This is indicative of calm clear nights with cold dense air sliding off the higher elevations and settling into valleys.
For those seeking more detailed information on 5-minute, hourly, daily, and monthly conditions, please visit the following Office of the NJ State Climatologist's websites:
Rutgers NJ Weather Network
NJ Community Collaborative Rain, Hail and Snow Network
NJ Snow Event Reports
Interested in receiving our monthly summaries at the end of each month? Send us your e-mail address here to join the mailing list.
Past News Stories

