Normally Abnormal: February 2023 & Winter 2022/2023 Recaps
New Jersey State Climatologist
Center for Environmental Prediction, School of Environmental and Biological Sciences/NJAES
Rutgers University
March 7, 2023
February Overview
Abnormal conditions were seemingly the norm cross the Garden State during the second month of 2023 and, for that matter, during much of the winter (December–February). More on winter later in this report. First, focusing on February, milder-than-normal temperatures and limited snowfall were the rule, a short-lived frigid blast was followed by 70° warmth, and the most notable February tornado of at least the past 74 years touched down.
The statewide average temperature of 38.9° was 5.0° above the 1991–2020 normal and ranked as the 5th mildest February since 1895 (tied with 2012; Table 1). Five of the six mildest Februarys have occurred in the last 11 years. Exemplifying the warmth, the New Brunswick (Middlesex County) Cooperative station experienced 23 days with above-average temperatures and just five below average. The same was true at both Sussex (Sussex) and Newark Airport (Union). Atlantic City Airport in Pomona (Atlantic) had 18 above and ten below normal, and Cape May (Cape May) reported 21 above and seven below.
The average February maximum was 49.3°, which is 6.2° above normal and ranks 3rd mildest, while the average minimum of 28.5° was 3.9° above normal, ranking 7th mildest. Temperatures in the northern climate division averaged 36.0° (+4.7°, 7th mildest), southern 40.6° (+5.1°, 4th mildest), and coastal 41.1° (+5.1°, 3rd mildest).
| Rank | Year | February Avg. Tmp. |
| 1 | 2017 | 40.4° |
| 2 | 2018 | 39.4° |
| 3 | 2020 | 39.1° |
| 3 | 1998 | 39.1° |
| 5 | 2023 | 38.9° |
| 5 | 2012 | 38.9° |
| 7 | 2002 | 38.4° |
| 8 | 1990 | 38.3° |
| 9 | 1997 | 38.0° |
| 10 | 1976 | 37.7° |
| 10 | 1954 | 37.7° |
Table 1. The 11 mildest Februarys across NJ since 1895.
February precipitation (rain and melted snow/sleet) averaged 1.55” across NJ. This was 1.31” below normal and ranks as the 11th driest February of the past 129 years. The northern division was driest at 1.30” (-1.49”, 9th driest), the southern division averaged 1.70” (-1.19”, 16th driest), and the coastal division averaged 1.64” (-1.43”, 16th driest; Figure 1).
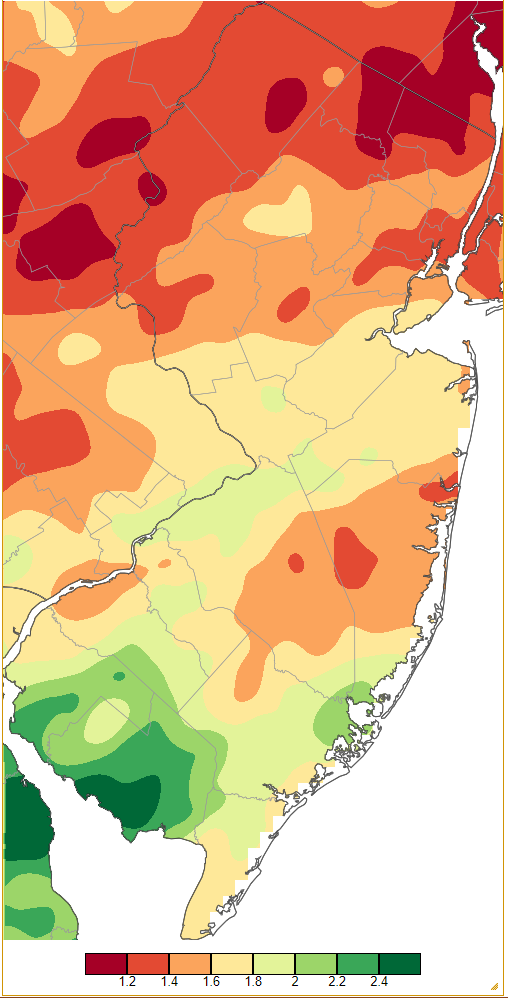
Figure 1. February 2023 precipitation across New Jersey based on a PRISM (Oregon State University) analysis generated using NWS Cooperative and CoCoRaHS observations from 7 AM on January 31st to 7 AM on February 28th. Note the scale in inches at the bottom of the map. Totals range from 1.00”–1.19” (dark red) to 2.40”–2.59” (dark green).
February statewide average snowfall was 1.8”. This was 6.4” below normal and ranks as the 22nd least snowy. The north saw the most snow, averaging 4.5”, which is 5.8” below normal and ranks 37th least snowy. Less fell in central areas where the average of 1.6” was 7.5” below normal and ranks 24th least snowy. The south averaged just 0.4”, which is 6.2” below normal, ranking 18th least snowy.
Temperature
On every day in February, one or more of the 66 Rutgers NJ Weather Network (NJWxNet) stations had a maximum temperature above freezing. While February averaged colder than this past January, there were 10 days when more than one NJWxNet station reached a high of 60° or greater compared to seven in January. Not that both aren’t impressive marks. After a cold start, the first mild day was the 8th with Woodbine (Cape May) up to 62° and six other stations either 60° or 61°. The 9th saw five stations at 63° and on the 10th Mannington (Salem) topped out at 65° and 42 stations were from 60°–64°. You had to turn to the northwest to find the mildest location on the 13th with Walpack (Sussex) up to 62° in the afternoon. This followed a state morning low of 22° at this valley location.
There was considerable uniformity on the 15th, with 11 NJWxNet stations warmest at 69°, closely followed by 18 at 68°. Another 29 locations reached 60°–67°, while coastal Harvey Cedars (Ocean) was coolest at 54°. February’s warmest day was the 16th when Howell (Monmouth) and Oceanport (Monmouth) made it to 71°. Three stations followed at 70°, 32 from 65°–69°, and 24 from 60°–64° (Figure 2). The state’s southernmost station at West Cape May (Cape May) was coolest at 57°. The 17th found Woodbine above the pack at 66°, with 42 sites from 60°–63°. The state’s northernmost station at High Point Monument (HPM; Sussex) was coolest at 53°.
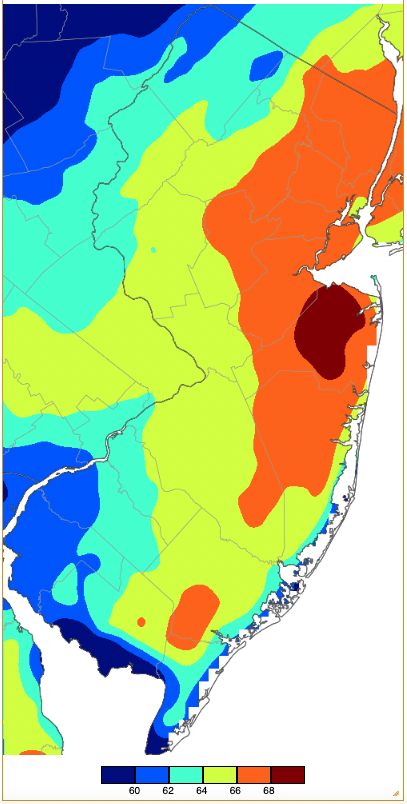
Figure 2. Maximum temperatures on February 16th based on a PRISM (Oregon State University) analysis generated using NWS, NJWxNet, and other professional weather stations. Note the 2-degree scale beneath the map.
On another day with tightly-bunched maximums, the 20th found Hamilton (Mercer) at 65° with 44 stations at 60°–64°. Hammonton (Atlantic) and Piney Hollow (Gloucester) reached 60° on the 21st. The 23rd saw a wide range of maximums across NJ. In the southwest, Mannington reached 72°, and in Cumberland county Greenwich made it to 71°, with Upper Deerfield and Vineland 70°. Meanwhile in the north, High Point (Sussex) and Parsippany (Morris) topped out at 38°. This range is illustrated in Figure 3, with late-afternoon NJ temperatures ranging from the upper 30°s to 70°. This range is more dramatic when looking at the near 80° temperatures at this time in the Virginia Tidewater and the teens in northern New York (Figure 4).
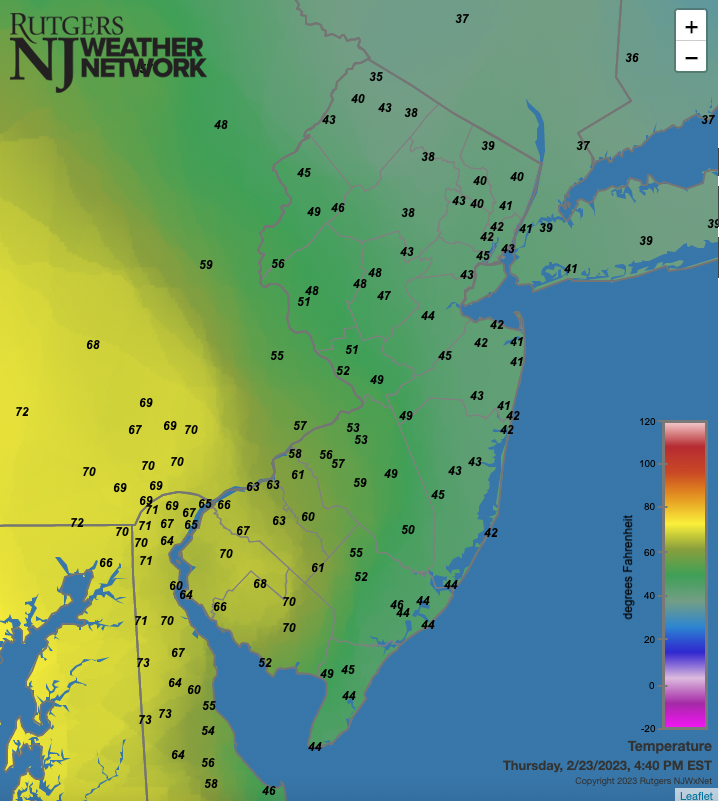
Figure 3. Temperatures across NJ and nearby states at 4:40 PM on February 23rd.
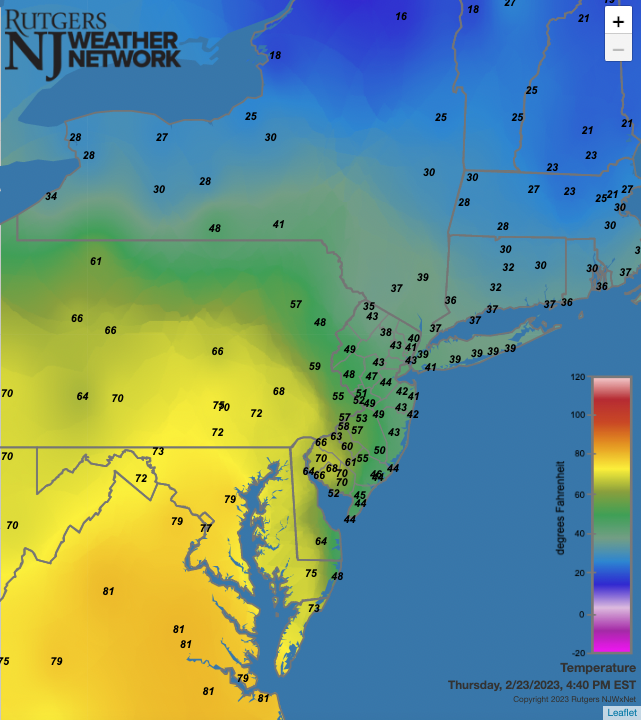
Figure 4. Temperatures across the Northeast and Mid-Atlantic at 4:40 PM on February 23rd.
February was not devoid of cold conditions. The coldest air of the season began to arrive on the 2nd with the first of nine days with lows of 15° or colder at one or more NJWxNet station. On the 2nd, Walpack dropped to 11°, Sandyston (Sussex) 12°, and Pequest (Warren) 14°. An Arctic blast arrived early on the 3rd, and by day’s end, HPM was down to -1°, four stations ranged from 1°–5°, and 13 from 6°–10°. The morning of the 4th was the coldest of the season, with HPM -10°, High Point -8°, Vernon Township (Sussex) -7°, Wantage (Sussex) -6°, seven stations from -5°–0°, and 32 locations 1°–10° (Figure 5). Southern coastal stations at Fortescue (Cumberland), West Cape May, and Lower Alloways Creek Township (Salem) were all mildest at 16°. Winds howled on the 3rd and 4th (see below for more), leading to dangerous wind chills throughout NJ. Nowhere were conditions worse than at HPM where a wind chill of -43° was achieved at 3:20AM on the 4th. Not surprisingly, the cold air was quite dry, with dew points hovering near 0° in the far south to the teens below zero in the north on the morning of the 4th (Figure 6).
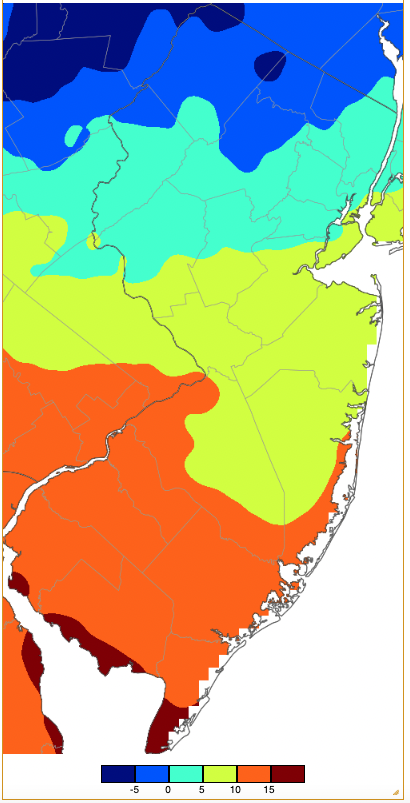
Figure 5. Minimum temperatures on February 4th based on a PRISM (Oregon State University) analysis generated using NWS, NJWxNet, and other professional weather stations. Note the 5-degree scale beneath the map.
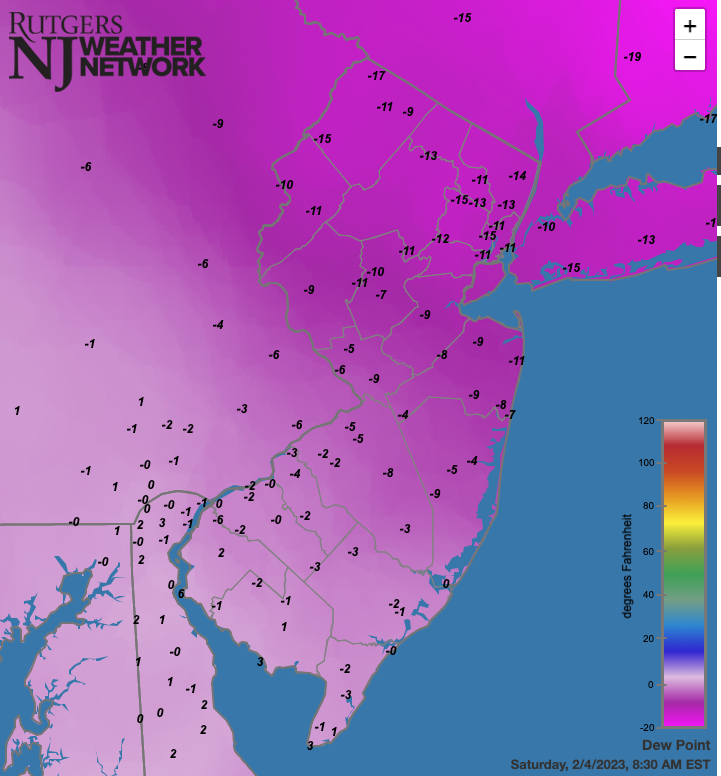
Figure 6. Dew point temperatures across NJ and nearby states at 8:30AM on February 4th.
The extreme cold left the state almost as quickly as it arrived, however, lows on the 5th fell to 14° at Hillsborough-Duke (Somerset) and 15° at High Point. HPM and High Point reached 14° and 15°, respectively, on the 7th. Walpack dropped to 15° on the 12th, and 12 days later HPM hit 14°. HPM and Walpack were each down to 13° on the 25th with five other locations 14°–15°. Thanks in part to snow cover in the north, a wide range of minimums on the 26th found Walpack at 9°, Sandyston 11°, Pequest 12°, and six stations 15°, while Fortescue, in the snow-free south, only made it down to 34°.
Precipitation and Storms
As mentioned previously, the month was dry and relatively storm and snow free. The wettest CoCoRaHS stations only cracked the 2.00” mark with 2.32” in Deerfield Township (Cumberland), Maurice River Township (Cumberland) 2.22”, Port Republic (Atlantic) 2.21”, Millville (Cumberland) 2.20”, Galloway Township (Atlantic) and Burlington (Burlington) each 2.17”, and Pitman (Gloucester) 2.16”. Half those amounts of rain and melted snow comprised the low end of monthly station totals. This included Oxford Township (Warren) with 1.10”, Far Hills (Somerset) 1.12”, Oakland (Bergen) and Maplewood (Essex) each 1.15”, and both Ringwood (Passaic) and Franklin (Sussex) 1.16”.
In the north, monthly snowfall was as plentiful as 7.4” in Montague (Sussex), Vernon Township 6.9”, Wantage 6.5”, Oakland 6.2”, Hardyston (Sussex) 6.1”, and Stillwater (Sussex) 6.0”.
Monthly reports most often only cover storms that deposit at least an inch or more of rain or melted snow at one or more NJ locations. That won’t be the case this month, as just one station in the last storm of the month barely made it above an inch. First, to start off this month, an innocuous event early on the 1st brought the first measurable snow of the season to many central and south Jersey locations. Lower Township (Cape May) received the most with just 1.0” accumulating, followed by Upper Deerfield and Wenonah (Gloucester) each with 0.7”. At New Brunswick the 0.2” total established a new record for the latest date of first measurable snow, exceeding the previous record of January 31, 1921 (records back to 1893).
Dry conditions prevailed from the 2nd–11th, with just some locations collecting less than 0.10” early on the 8th. Rain during the day of the 12th into early on the 13th brought 0.88” to Deerfield Township, Millville 0.85”, and Vineland 0.80”. Just 12 of the 230 CoCoRaHS station reports were as high as 0.50”–0.88”, with most less than 0.20”. It was again dry until a similar event to the last occurring from the 16th into early 17th brought as much as 0.50”–0.81” to 10 stations, with again most of over 200 CoCoRaHS reports under 0.20”. Mount Ephraim (Camden) had 0.81”, with Millstone Township (Monmouth) at 0.75”, and Moorestown (Burlington) 0.73”.
A sharp daytime cold front on the 17th delivered somewhat more widespread moderate rain totals. Still, just 28 of 222 CoCoRaHS reports exceeded 0.50”, led by 0.91” in Burlington, Mansfield (Burlington) 0.85”, Upper Freehold Township (Monmouth) 0.82”, and Riverton (Burlington) 0.81”.
Light rain fell around the state with 0.5” of snow at High Point early on the 21st. Morris Township (Morris) caught 0.38” and Maywood (Bergen) 0.32”. However, it was a squall line that raced through central and northern areas during the afternoon of the 21st that was a headline maker. Precipitation totals were minor, at most 0.26” in Maywood and Randolph Township (Morris), and 0.25” in Hanover Township (Morris). However, a strong thunderstorm cell for any time of the year crossed from Mercer east to Monmouth from 3 to 5 PM. Hail covered the ground in some locations and a waterspout was spotted off the coast near Sea Girt (Monmouth). The main event was a tornado that covered a 5.8-mile path through a portion of Mercer County (Figure 7). According to the National Weather Service, it touched down at 3:35 PM in Lawrence Township and lifted in West Windsor Township at 3:41 PM. It reached a maximum rating of EF2 on the Enhanced Fujita scale, with maximum wind speeds estimated to be 115 mph. The path width was a maximum of 200 yards. No deaths or injuries occurred, however, damage to roofs and walls of buildings from the wind and downed trees temporarily left as many as 100 residents needing shelter away from their homes. Cars were damaged and wires downed from falling trees.
This was just the fifth February tornado to be reported in NJ since 1950 and, for that matter, the fifth for any winter season (Dec.–Feb.). Previously, there were three tornados on February 2, 1973, all close together in Hunterdon County, one an F2, two F1s, and none with a path longer than 0.3 miles (the Fujita scale was replaced by the Enhanced scale in 2007 with little change in estimated strength of storms rated 0 to 2). An F1 occurred in Camden County on February 12, 1999, with a 0.5-mile path. Thus, this year’s tornado was by far the most noteworthy winter tornado on record in NJ.
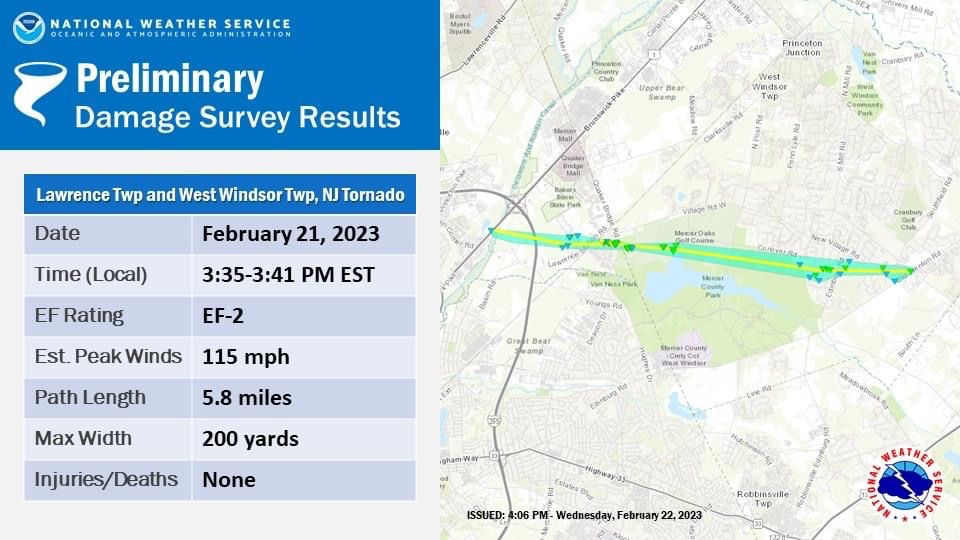
Figure 7. Preliminary National Weather Service tornado report for the February 21st event in Lawrence and West Windsor Townships.
The day following the tornado brought light rain to the south and a mix of rain and snow up north. Secaucus (Hudson) picked up 0.31” of rain and Liberty Township (Warren) 0.30” of rain and melted snow. Sparta (Sussex) and Wantage saw 0.5” of snow. Flurries and light snow in the north during the morning of the 25th delivered 1.0” to Ramsey (Bergen), Montague (Sussex) 0.7”, and Hardyston 0.6”.
The wettest and snowiest system of the month began as southern rain during the daytime hours of the 27th. The precipitation shield spread north later in the day and evening as a mix of snow, sleet, and rain in central areas and mainly snow with some sleet in the north. By daybreak on the 28th only drizzle and flurries continued to fall. Rain and melted snow amounted to as much as 1.03” in Vernon Township, with other liquid totals of 0.89” at Mine Hill (Morris), Galloway Township, and Verona (Essex) each 0.87”, and both Absecon (Atlantic) and Wantage with 0.85” (Figure 8). Of the 246 CoCoRaHS reports, 181 were from 0.50”–1.03”, with the remainder between 0.22” at two Ewing Township (Mercer) stations and 0.49”.
Snowfall from the 27th–28th storm was greatest in Sussex County where Highland Lakes reported 7.0”, Vernon Township 6.9”, Montague 6.6”, and Wantage 6.2”. Sussex was one of 13 counties that received measurable snow, with 10 of them seeing locations with 2.0” or more (Figure 9, Table 2).
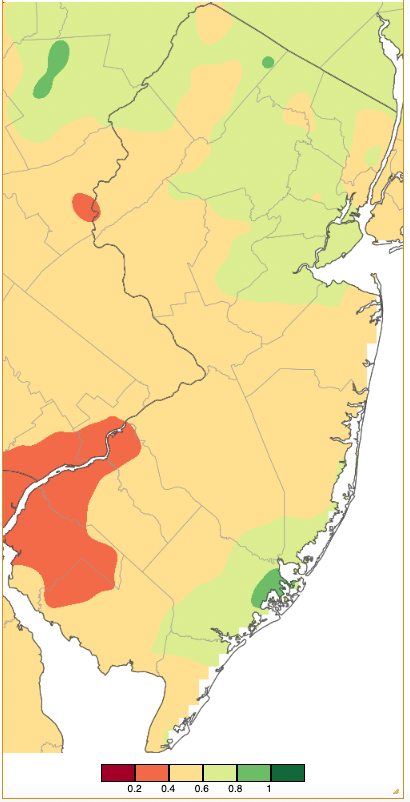
Figure 8. Precipitation across New Jersey from 7 AM on February 27th through 7 AM February 28th based on a PRISM (Oregon State University) analysis generated using NWS Cooperative and CoCoRaHS observations. Note the scale in inches beneath the map.
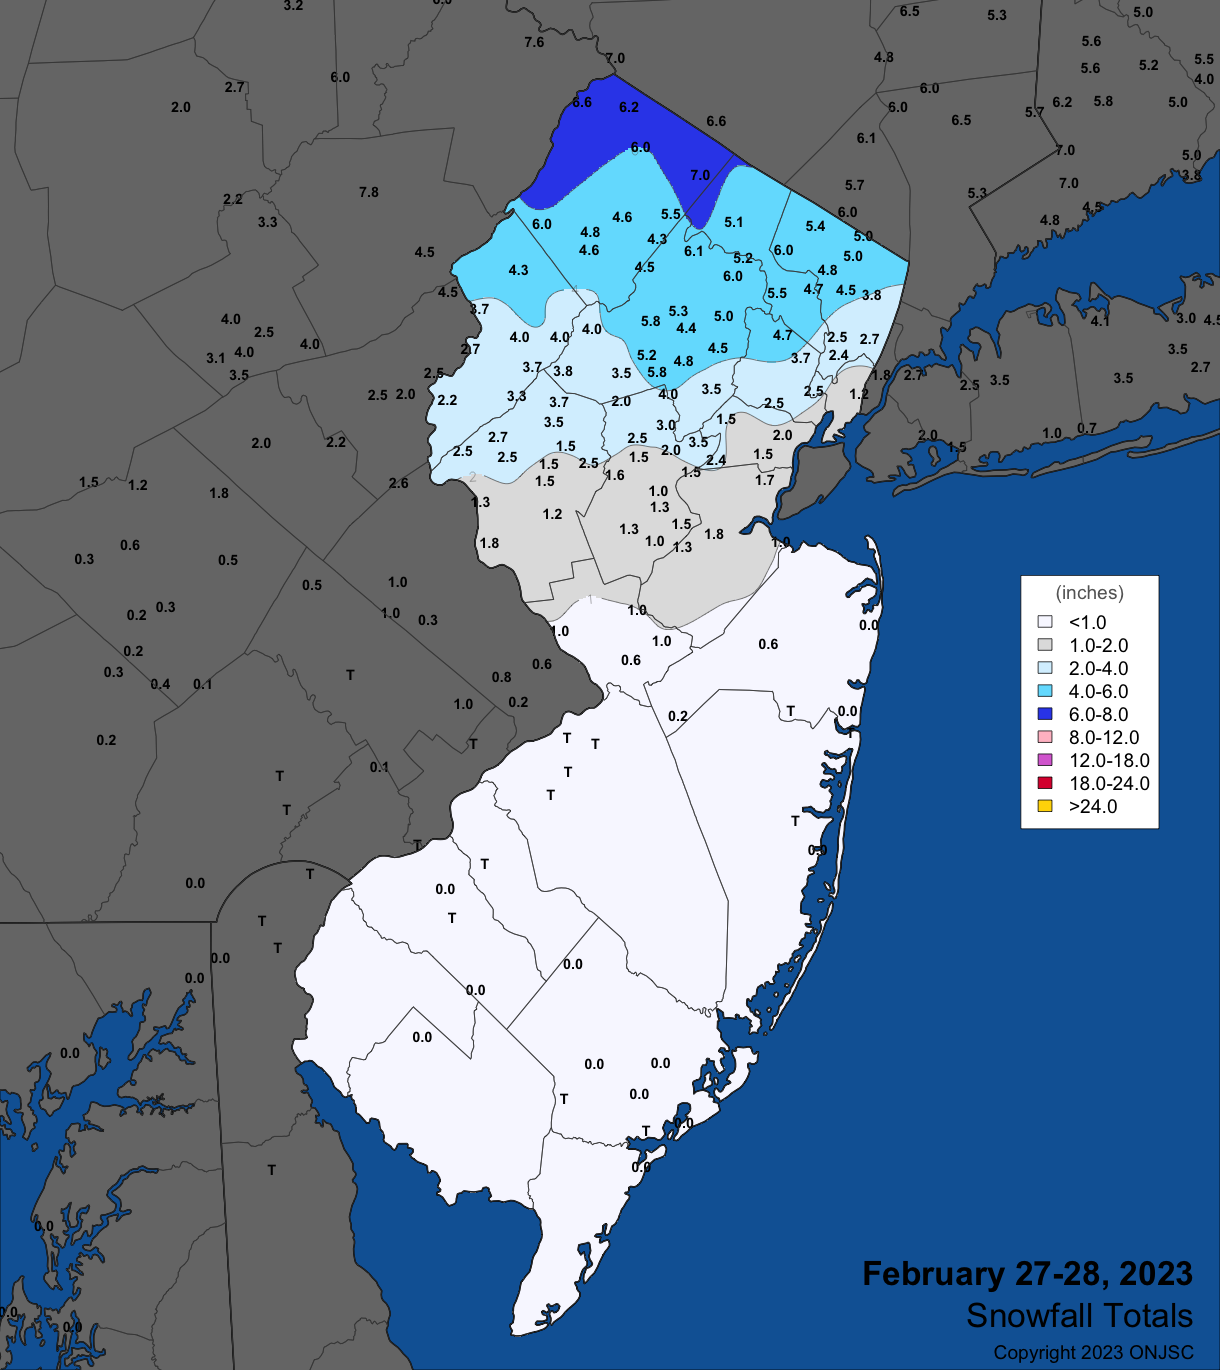
Figure 9. Snowfall on February 27th–28th. Observations are from CoCoRaHS, NWS Cooperative Observer, NWS Trained Spotter, and reports from the North Jersey Weather Observers.
| County | Location | Snowfall |
| Bergen | Oakland | 6.0" |
| Essex | West Caldwell | 5.1" |
| Hudson | Harrison | 2.5" |
| Hunterdon | Califon | 3.7" |
| Morris | Green Pond | 6.1" |
| Passaic | Wayne | 5.5" |
| Somerset | Watchung | 3.5" |
| Sussex | Highland Lakes | 7.0" |
| Union | Plainfield | 2.4" |
| Warren | Blairstown | 4.3" |
Table 2. Maximum snowfall for the 27th–28th storm in all NJ counties where at least one location reported 2.0” or more. Observations are from CoCoRaHS, NWS Cooperative Observer, NWS Trained Spotter, and reports from the North Jersey Weather Observers.
The lowest barometric pressures of the month occurred on the 13th, 17th, and 28th, ranging from 29.45”–29.60”. The highest pressures were on the 4th at 30.60”–30.70”. Fluctuating pressures during the month often resulted in windy conditions, with gusts of at least 40 mph at one or more NJWxNet station on 15 days. HPM was in the mix on 10 of the days, with the Vernon Township station located at the top of Mountain Creek’s highest ski lift and coastal stations also key locations for the strongest gusts. HPM topped out at 59 mph as Arctic air advected into NJ on the 3rd, followed by Vernon Township at 56 mph, Lower Alloways Creek Township 52 mph, and 14 sites from 40–47 mph. HPM reached 48 mph and Vernon Township 43 mph on the 4th. Vernon Township peaked at 43 mph on the 9th and also on the 10th when HPM hit 46 mph. HPM hit 49 mph, Vernon Township 44 mph, and Wantage 41 mph on the 11th.
The scene turned to the coast on the 12th with Atlantic City Marina (Atlantic) up to 40 mph, and on the 13th, Harvey Cedars topped out at 42 mph with three sites 40–41 mph. It was back to the hilltops on the 14th with HPM up to 47 mph and Vernon Township at 40 mph on the 15th. HPM reached 57 mph on the 17th and nine NJWxNet stations 40–47 mph. The two 40 mph plus gusts on the 18th included a monthly maximum 60 mph at HPM and a 45-mph gust at Harvey Cedars. The tornado day of the 21st found HPM gusting to 51 mph, Logan Township (Gloucester) 48 mph, Upper Deerfield 47 mph, and Lower Alloways Creek Township 43 mph. A windy 24th resulted in a 59-mph gust at HPM, 53 mph in Vernon Township, and four stations from 40–46 mph. Little Egg Harbor Township (Ocean) peaked at 45 mph during the storm on the 27th, followed by 43 mph gusts at both Atlantic City Marina and Harvey Cedars. The Marina hit 40 mph on the 28th.
Winter OverviewThe winter of 2022/2023 began with wildly fluctuating temperatures in a December that ultimately averaged 35.6° or 1.0° below the 1991–2020 normal. Little would it be imagined then that this would be the coldest month of winter, with January averaging a record mild 41.1° (+9.4°, tied with 1932), and February 38.9° (+5.0°). This was just the fifth winter since records commenced in 1895/1896 that December was colder than February and February colder than January. The other such winters include 1910/1911, 1943/1944, 1963/1964, and 2005/2006.
Statewide, temperatures for the winter of 2022/2023 averaged 38.5°. This is 4.5° above normal and ranks as the 2nd mildest of the past 128 winters (tied with 2015/2016; Table 3). Six of the mildest 10 have occurred since the winter of 2001/2002, with four in the past eight years. Putting aside December, the January–February period averaged 40.0°, which easily surpasses all other such starts to the year. The next closest two-month average is 39.0° in 1998.
| Rank | Year | Winter Avg. Tmp. |
| 1 | 2001/02 | 38.8° |
| 2 | 2022/23 | 38.5° |
| 2 | 2015/16 | 38.5° |
| 4 | 2011/12 | 38.3° |
| 5 | 1997/98 | 38.0° |
| 6 | 1931/32 | 37.9° |
| 7 | 2019/20 | 37.7° |
| 8 | 2016/17 | 37.6° |
| 9 | 1998/99 | 36.2° |
| 10 | 1990/91 | 36.1° |
Table 3. The 10 mildest winters across NJ since 1895/1896.
Winter precipitation (rain and melted snow/sleet) averaged 10.13”. This is 0.49” below the 1991–2020 normal and ranks as the 63rd wettest/66th driest on record. Northern NJ (except the far northwest) fared better than the south, with Mine Hill (Morris) leading the way in NJ with 14.89” (Figure 10). This was followed by Randolph Township (Morris) at 14.50”, Little Falls (Passaic) 14.06”, Montclair (Essex) 13.78”, Mount Arlington (Morris) 13.64”, and Denville (Morris) 13.63”. The driest locations in the south included Lower Township (Cape May) at 7.75” and 8.50” (two stations), Upper Deerfield Township (Cumberland) 8.25”, Sea Isle City (Cape May) 8.33”, Wildwood Crest (Cape May) 8.39”, and Winslow Township (Camden) 8.34”.
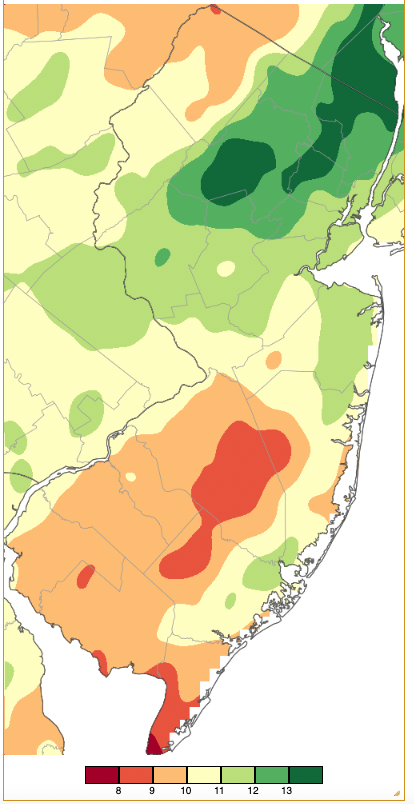
Figure 10. Winter 2022/2023 precipitation across New Jersey based on a PRISM (Oregon State University) analysis generated using NWS Cooperative and CoCoRaHS observations. Note the scale in full inches at the bottom of the map. Totals range from 7.00”–7.99” (dark red) to 13.00”–13.99” (dark green).
Looking at the snow season through the end of winter, mindful that no snow fell in October and November, the statewide season to date total stands at 3.0”. This is 17.2” below normal and is the second lowest on record for the season to date (behind the 2.7” from October 1918–February 1919). Should no additional snow fall this season it would be the lowest on record. The northern division (Warren, Morris and Essex county and counties to the north) is at 8.4” for the season to date, which is 18.6” below normal. It is the 6th lowest on record through February and would be the second least snowy season on record if no further snow falls. The central division (Hunterdon, Somerset, Union, Middlesex, Monmouth, and Mercer) has averaged 2.4” for the season to date. This is 20.0” below normal, is the second least snowy season to date through February and would be the least snowy season should no additional snow occur. The southern division (Burlington and Ocean southward) has thus far averaged 0.4” for the season. This is 15.0” below normal and is the least snowy on record to date and would be the least snowy for the entire season should no additional snow accumulate.
There have been six CoCoRaHS stations where through February more than a foot of snow has fallen this season. They include Vernon Township (Sussex) with 25.3”, Wantage (Sussex) 16.4”, Sparta (Sussex) 16.3”, Hardyston (Sussex) 14.3”, Jefferson Township (Morris) 13.0”, and Frelinghuysen Township (Warren) 12.1”.
For those seeking more detailed information on 5-minute, hourly, daily, and monthly conditions, please visit the following Office of the NJ State Climatologist's websites:
Rutgers NJ Weather Network
NJ Community Collaborative Rain, Hail and Snow Network
NJ Snow Event Reports
Interested in receiving our monthly summaries at the end of each month? Send us your e-mail address here to join the mailing list.
Past News Stories

