The Wind Doth Blow: March 2021 Recap
New Jersey State Climatologist
Center for Environmental Prediction, School of Environmental and Biological Sciences/NJAES, Rutgers University
April 8, 2021
Overview
With March being a transitional weather and climate month, there are often pronounced differences in conditions from one day or week to the next. The third month of 2021 did not disappoint in several such respects. Swings in barometric pressure as storms and high pressure systems swung through the Northeast led to 16 days with one or more Rutgers NJ Weather Network stations gusting to 40 mph or higher, with 11 of those days exceeding 50 mph. Maximum temperatures exceeded 65° on 12 days (two days had record highs in some locations), while minimum temperatures fell below 19° on 13 days. Walpack, situated in a Sussex County valley, recorded the state’s lowest (21°) and highest (67°) temperatures on a single day (22nd) and just missed this again on the 30th. There was a two-week interval with virtually no precipitation, culminating in several wildfires on the 14th, yet five events occurred where rain accumulated to 0.98” in one or more locations. Finally, a record of sorts was tied as the statewide average snowfall totaled 0.0”, something observed eight other Marches in the past 127 years. The past two Marches are the only ones with back-to-back zero totals.
Statewide precipitation averaged 4.03”, which is 0.18” below the 1991–2020 average*. This made for the 58th wettest (70th driest) since 1895. Northern NJ was driest, coming in at 3.28” (-0.73, 48th driest), the south averaged 4.47” (+0.15”, 42nd wettest), and the coast 4.68” (+0.26”, 38th wettest). The southeast saw the most rain and northeast and central regions the least (Figure 1).
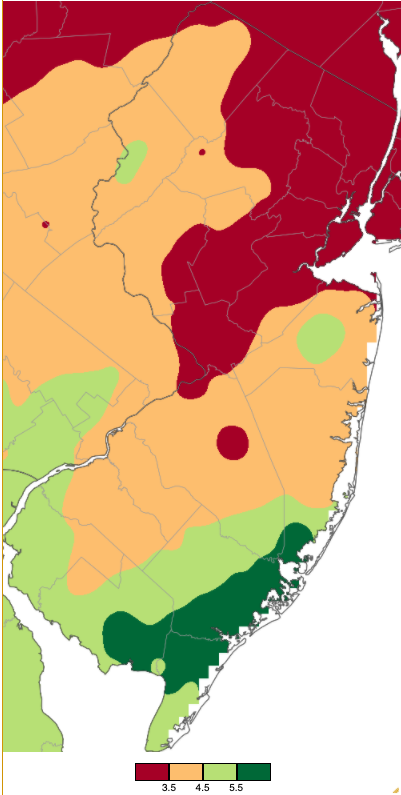
Figure 1. March 2021 precipitation across New Jersey based on a PRISM (Oregon State University) analysis generated using NWS Cooperative and CoCoRaHS observations from 7 AM on February 28th to 7 AM on March 31st. Totals range from 2.50”–3.49” (red) to 5.50”–6.49” (dark green).
March temperature average 43.9°, which is 2.9° above the 1991–2020 average and the 14th mildest on record. The average high was 54.7° (+3.8°, 13th mildest) and average low was 33.0° (+1.8°, 19th mildest). The north averaged 41.2° (+2.4°, 19th mildest), south 45.6° (+3.2°, 13th mildest), and the coast 45.1° (+2.9°, 13th mildest).
*NOAA’s National Centers for Environmental Information (NCEI) has released 1991–2020 averages for NJ monthly temperature and precipitation. In this report, we are using these values for the first time when discussing departures from normal. For the past decade we have used 1981–2010 normals, thus the difference with the new normal compared to what we’ve used previously is the addition of the past decade and the removal of 1981–1990. More will be reported on changes in a forthcoming note from our office, but a quick look shows that, overall, temperature normals have warmed in eleven months and annually (November cooled slightly). Precipitation increased in nine months and annually (April, May, and November became drier).
Precipitation and Storms
Monthly precipitation at NJ CoCoRaHS stations across the state was greatest in Atlantic County, where Linwood caught 6.44”, Somers Point 6.18”, Ventnor 6.15”, and Absecon 6.04”. Nearby Sea Isle City (Cape May) totaled 6.10”, and Middle Township (Cape May) 6.00”. In the northeastern corner of the state, Rockaway (Morris) saw as little as 2.45”, with Palisades Park (Bergen) 2.63”, Bergenfield (Bergen) 2.72”, and Pompton Lakes (Passaic) 2.75” also well below normal.
The first event of March was officially recorded on the 1st, yet began during the afternoon of February 28th. The storm produced as much as 1.91” at Linwood, Woodbine (Cape May) 1.83”, Estell Manor (Atlantic) 1.78”, and both Egg Harbor Township (Atlantic) and Millville (Cumberland) 1.73”. Some 59 CoCoRaHS stations in the south caught 1.00”–1.71”, and in the north the least fell in Palisades Park with 0.32” (Figure 2).
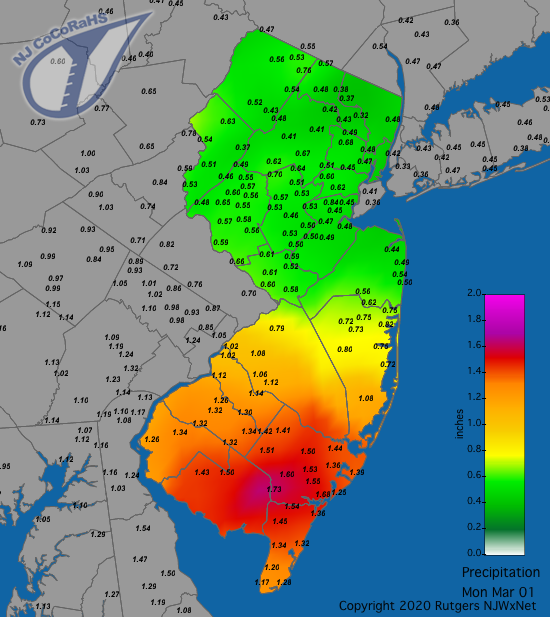
Figure 2. Rainfall from approximately 7 AM on February 28th to 7 AM on March 1st. Reports are from CoCoRaHS observers.
A few snow showers on the 6th whitened the ground with 0.1” measured at both Jefferson Township (Morris) and Sparta (Sussex). The same total in the form of sleet was observed at Bridgewater (Somerset) and Hillsborough (Somerset) on the 16th. These four locations were the only ones reporting measurable frozen precipitation during the month.
Little to no precipitation fell from the 2nd to the 15th, with the resultant dry conditions along with strong winds contributing to the spread of several wildfires on the afternoon of the 14th in Salem and Ocean counties. The latter fire in Brick and Lakewood burned approximately 167 acres, destroyed several commercial buildings, damaged several dozen homes, and led to the closure of a section of the Garden State Parkway. One firefighter suffered cardiac arrest but fortunately survived.
A bit of rain damped the fire danger on the 16th, though no location did better than the 0.25” that fell in Point Pleasant Beach (Ocean). Conditions turned wetter on the 18th with morning rain moving northward through the state, continuing through the afternoon and ending on the heavy side in the south during the evening. Absecon took top honors with 2.00”, followed by Egg Harbor Township’s 1.88”, Linwood 1.85”, Brigantine (Atlantic) 1.75”, and Galloway Township (Atlantic) 1.74”. Of 236 other CoCoRaHS reports, 112 came in at 1.00”–1.65”, with Kearny (Hudson) least at 0.61” (Figure 3).
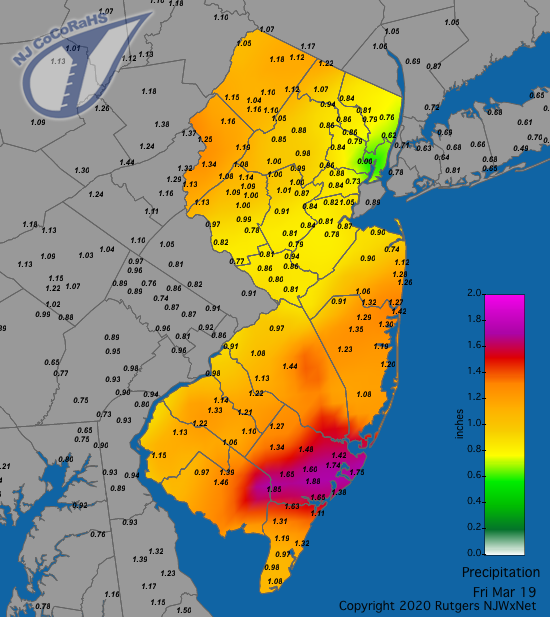
Figure 3. Rainfall from approximately 7 AM on March 18th to 7 AM on March 19th. Reports are from CoCoRaHS observers.
There was enough atmospheric moisture across coastal and portions of inland southern NJ on the 23rd to result in a persistent low clouds and fog that slowly dissipated during the morning. At 9:40 AM, a considerable cover remained that greatly reduced the amount of solar radiation measured at a number of locations (Figure 4).
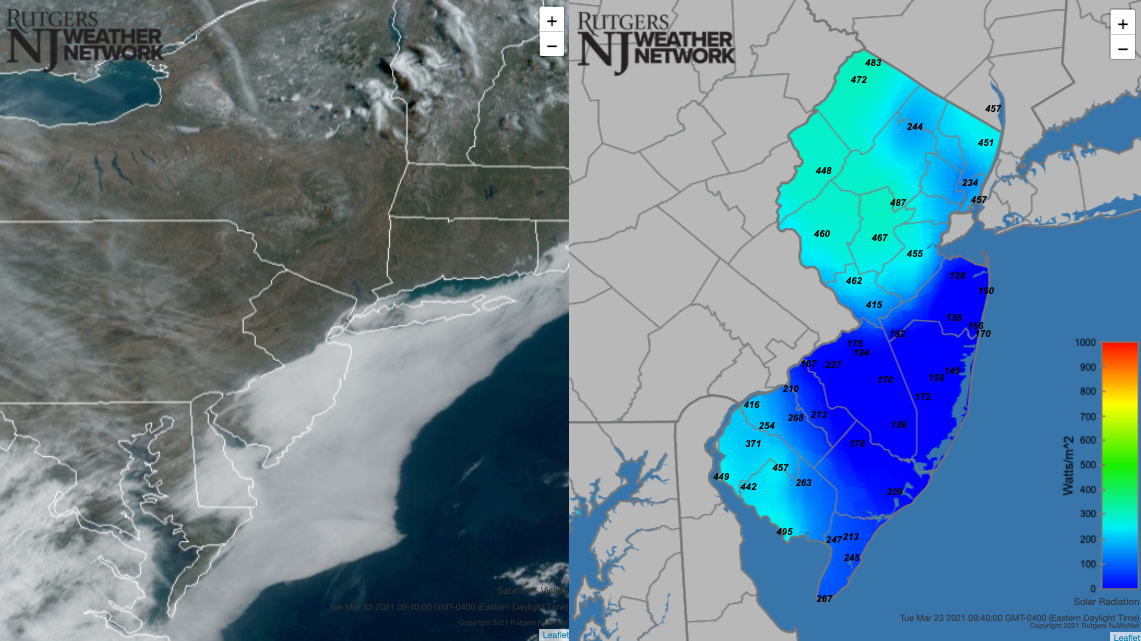
Figure 4. South Jersey fog at 9:40 AM on March 23rd as seen in a NOAA visible satellite image (left) and an NJWxNet solar radiation maps (right).
More rain arrived on the 24th, when a northward progression during the afternoon and evening gave all of the state a soaking (Figure 5). Again, the southeast saw the most with 2.77” in Sea Isle City, Ventnor 2.60”, two Middle Township stations with 2.55” and 2.39”, Ocean City (Cape May) 2.48”, and Dennis (Cape May) 2.43”. In addition, of 257 total CoCoRaHS reports, 14 ranged from 2.00”–2.39”, and 233 from 1.00”–1.99”.
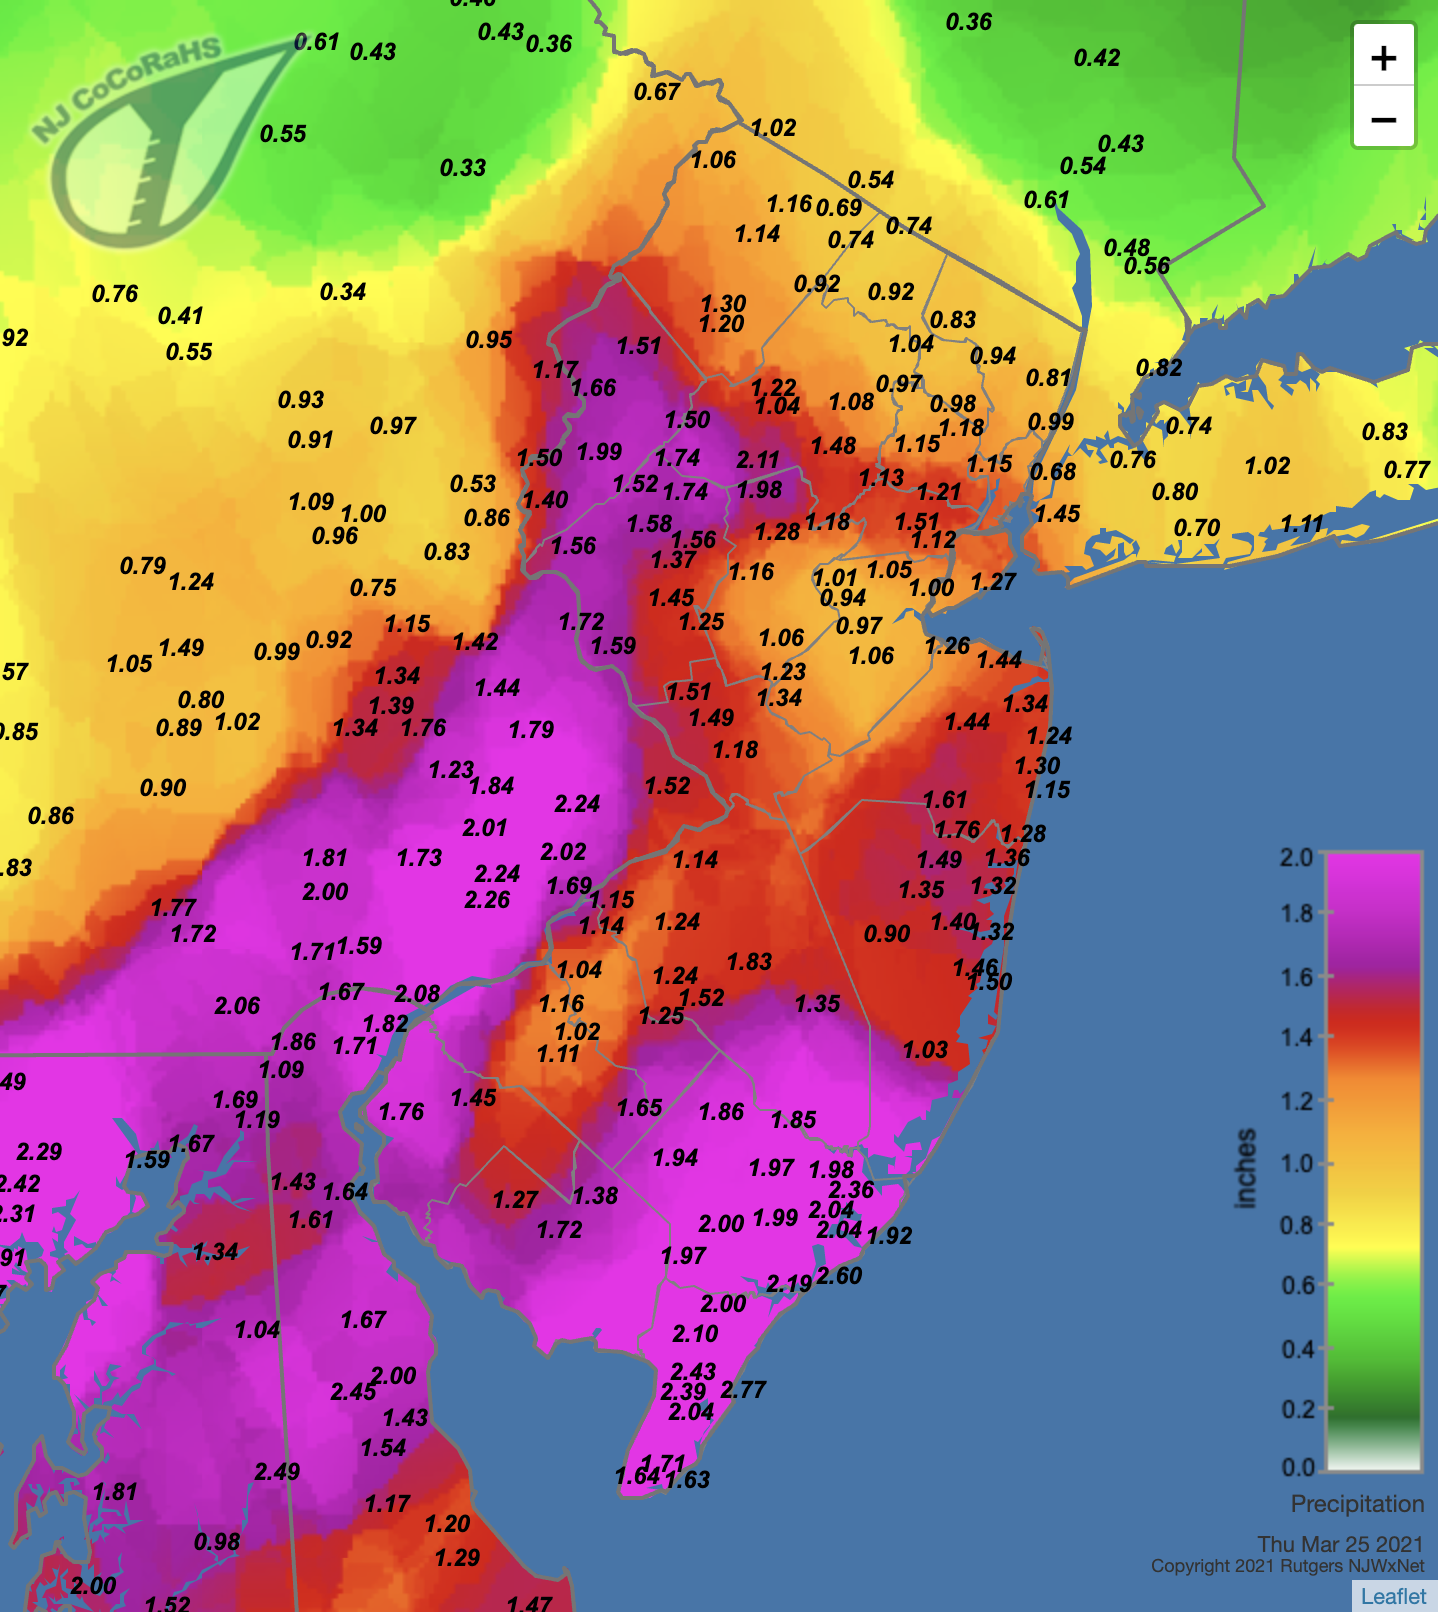
Figure 5. Rainfall from approximately 7 AM on March 24th to 7 AM on March 25th. Reports are from CoCoRaHS observers.
Next up was a two-part event on the 28th, with morning rain, an afternoon break, and then a squall line passing through in the evening. Stillwater (Sussex) almost made it to an inch with 0.98”, followed closely by Montague (Sussex) 0.94” and Wayne (Passaic) 0.93”. A tight grouping of 161 locations caught 0.50”–0.88”.
Finally, as has been the case on the last day of the previous four months, precipitation fell on the last day of March after the standard CoCoRaHS and most NWS Cooperative station morning observation times. Thus, the post-observation rain that fell, which continued into the morning of April 1st, counts toward April totals. More will be said about this event in the April report but for now suffice it to say that Medford Lakes and Southampton Township, each in Burlington County, caught the most rain, with 1.82” and 1.72”, respectively.
The highest monthly barometric pressures were observed on the 20th and 21st, running from 30.55”–30.60”. The pressure bottomed out at 29.40”–29.50” on the 28th. As mentioned earlier, a lot of air moved through the state in March. The 1st saw gusts reach 64 mph at High Point Monument (HPM; Sussex), 56 mph in Vernon Township (Sussex), and 12 NJWxNet stations gusted from 40–49 mph. Almost identical values occurred on the 2nd, with HPM again at 64 mph, Vernon Township 63 mph, and 12 stations from 40–47 mph. HPM reached 54 mph on the 4th, Vernon Township 47 mph, and Sea Girt (Monmouth) 41 mph. The 5th saw HPM at 56 mph, Wantage (Sussex) 47 mph, Vernon Township 42 mph, and Seaside Heights (Ocean) 40 mph. HPM had a 51 mph gust on the 6th.
After a five-day break, HPM reached 43 mph and both Vernon Township and Pennsauken (Camden) 42 mph on the 12th. Vernon Township took top honors with a 55 mph gust on the 13th, followed by HPM at 49 mph, and three stations from 40–43 mph. On the 14th, HPM caught a 59 mph gust, Vernon Township and Lower Alloways Creek Township (Salem) were at 54 mph, and 17 stations from 40–47 mph. These winds helped fan the flames of the aforementioned wildfires. The 15th found HPM up to 55 mph, Seaside Heights 44 mph, Hillsborough-Duke (Somerset) 43 mph, and Vernon Township 42 mph. Vernon Township gusted to 46 mph on the 18th and 49 mph on the 19th, the latter day also seeing six stations peak at 40–44 mph.
The final week of March began with HPM gusting to 59 mph, Lyndhurst (Bergen) 51 mph, Seaside Heights 50 mph, 13 stations from 45–49 mph, and 11 from 40–44 mph on the 26th (Figure 6). These “blow torch” southerly winds brought record breaking warmth to parts of NJ (see below for more). HPM reached 42 mph on the 27th. Cream Ridge (Monmouth) topped the list on the 28th, followed by Logan Township (Gloucester) 52 mph, Lower Alloways Creek Township 51 mph, and 15 stations from 40–49 mph. The winds on the 28th did the most damage of all during the month, with many trees and wires down in the central half of the state. A non-NJWxNet gust of 70 mph was observed at the joint MDL Base in Burlington County.
The wind continued to howl on the 29th, with HPM up to 58 mph, Pennsauken 53 mph, and 14 stations from 40–49 mph. HPM finished the month with a 40 mph gust on the 31st.
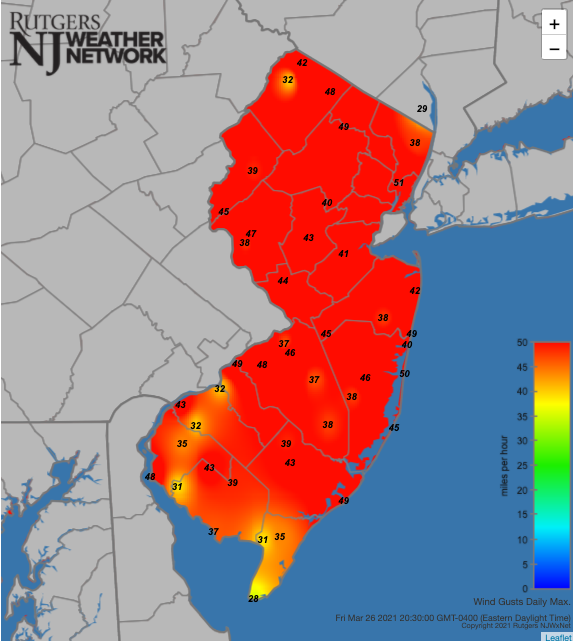
Figure 6. Maximum wind gusts on March 26th as recorded at Rutgers NJ Weather Network stations.
Temperature
As one might expect in March, the coldest weather was found in the first half and the warmest later in the month. The 1st saw HPM down to 18° and High Point (Sussex) 19°, these higher-elevation stations being coldest and indicative of cold air flowing into NJ. This continued on the 2nd, with HPM down to 10°, both High Point and Vernon Township 12°, and ten stations from 14°–19°. Calmer conditions and clear skies saw cold air fill the valleys on the 3rd, with Walpack down to 11° and both Sandyston (Sussex) and Pequest (Warren) 13°. In rushed more cold air on the 4th, with HPM at 16° and High Point 17°, and on the 5th HPM fell to 12°, High Point 13°, and Pequest 14°. HPM and High Point were each 18° on the 6th, with High Point 15° and ten stations from 16°–19° on the 7th. The 8th was the coldest day of the month, with Walpack at 8°, Sandyston 9°, and 22 stations from 12°–19°.
The state daily minimum of 33° at Sandyston on the 11th was the first one above freezing in March. But soon a last March shot of cold air arrived, with HPM down to 19° on the 14th. HPM dropped further to 12° on the 15th, with High Point and Vernon Township each at 14°, and five sites from 16°–19°. HPM was 17° on the 16th, and Walpack 17° on the 20th and 18° on the 21st to round out the sub-20° minimums for the month.
The morning of the 22nd provided an excellent example of a temperature inversion across NJ. As seen in Figure 7, the low-lying stations away from the coast were in the 20°s, and as low as 21° at Walpack. Meanwhile, higher elevations only cooled into the mid 30°s to low 40°s, including a 42° low atop Mountain Creek in Vernon Township. Also seen was the moderating influence of adjacent waters, with coastal stations in the upper 30s to low 40°s. Once the inversion broke, temperatures rose quickly, especially at Walpack where the afternoon maximum of 67° made it the warmest spot in the state.
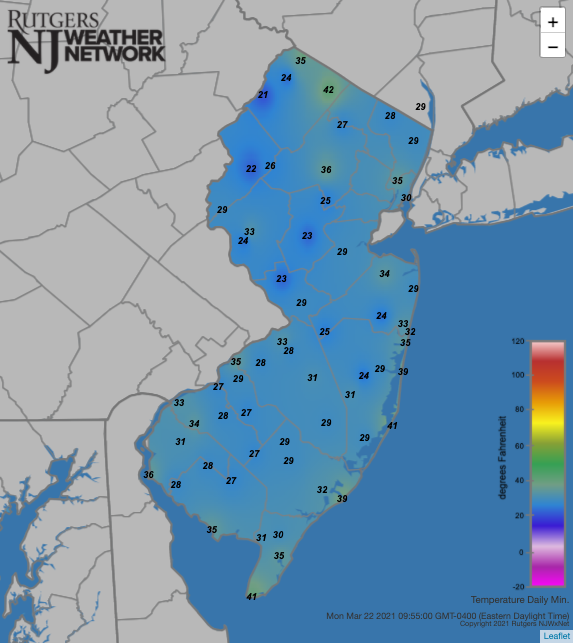
Figure 7. Minimum temperatures on March 22nd at NJWxNet stations.
A taste of 60° or milder air destined to arrive in earnest later in the month commenced on the 10th, with West Deptford (Gloucester) rising to 68° and Logan Township and Mannington (Salem) each at 67°. The 11th saw temperatures burst into the upper 70°s, with Sicklerville (Camden) tops at 77°, nine stations at 76°, and 34 of the 63 NJWxNet stations from 70°–75°. The cooler ocean kept the highs at both Harvey Cedars (Ocean) and Atlantic City Marina (Atlantic) down to 53°. Several records were set, including 75° at New Brunswick (Middlesex; previous record 70° in 1977) and Newark Airport (Union) 75° (71° in 1977). One more day of warmth on the 12th found Mansfield (Burlington) up to 73°, Moorestown (Burlington), Sicklerville, and West Deptford 72°, and 28 stations at 70°–71°.
Nine of the final eleven days of the month saw the thermometer exceed 60°. Stewartsville (Warren) reached 67° on the 21st. The aforementioned 67° state maximum and 46° diurnal range at Walpack came next on the 22nd. It is also interesting to note that this day only saw a 9° diurnal range at coastal Seaside Heights, with a 48° maximum and 39° minimum. West Deptford reached 70° on the 23rd with 36 stations from 65°–69°. The Highlands region Charlotteburg (Passaic) station was tops at 72° on the 25th.
A record-warm day throughout much of the Northeast on the 26th found Sicklerville soaring to 85° and 84° reached at Egg Harbor Township, Howell (Monmouth), West Deptford, and Berkeley Township (Ocean; Figure 8). 41 stations rose to between 80°–83°, and 16 from 70°–79°. As Figure 6 showed, this was a windy day, with the southerly flow off of Delaware Bay making Fortescue (Cumberland) the coolest location at a still respectable 69°. Some of the NJ records included 82° in New Brunswick (previous record 76° in 1949), 84° at Newark Airport (73° in 1986), 83° at the Atlantic City Airport in Pomona (Atlantic; 71° in 2003), and 81° at Atlantic City Marina (Atlantic; 72° in 1929).
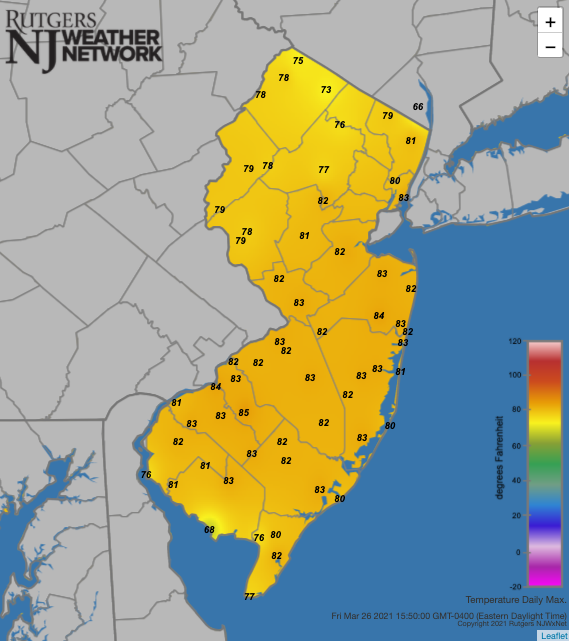
Figure 8. Maximum temperatures on March 26th at NJWxNet stations.
It cooled off a bit on the 27th, with 71° the top mark at Stewartsville, Cedar Bridge (Burlington), and Sicklerville. Vineland (Cumberland) led the way at 73° on the 28th, with 20 stations from 70°–72°. West Deptford, Basking Ridge (Somerset), and Hamilton (Mercer) hit 67° on the 30th. Walpack came within a degree of again having the state’s highest and lowest temperatures of the day with a high of 66° and state low of 23° on the 30th. The 31st brought a high of 72° to Sicklerville and West Deptford, with 35 sites from 65°–71°.
For those seeking more detailed information on 5-minute, hourly, daily, and monthly conditions, please visit the following Office of the NJ State Climatologist's websites:
Rutgers NJ Weather Network
NJ Community Collaborative Rain, Hail and Snow Network
NJ Snow Event Reports
Interested in receiving our monthly summaries at the end of each month? Send us your e-mail address here to join the mailing list.
Past News Stories

