Enigmas: June 2025 Recap, Plus First Half of 2025 Review
New Jersey State Climatologist
NJ Agricultural Experiment Station
Rutgers University
July 7, 2025
June Overview
Looking back at the past month, or the first half of this year for that matter, “mysterious,” “puzzling,” or “difficult to understand” may best describe what has transpired when it comes to New Jersey’s weather and climate behavior. In other words, enigmas. More on the previous six months toward the end of this report. First a look at June, which followed a drought-busting (and hopefully not just interrupting) 7th wettest May, but resumed an only twice-broken string of months with below-normal precipitation back to May 2024 (August 2024 and May 2025). Then there were cool days that had some wondering when summer would ever arrive. That was answered with a vengeance later in the month with one of the more torrid June heatwaves on record. The worst of it ended by an unseasonable backdoor cold front.
When all was said and done, the statewide average temperature of 71.9° was 1.6° above the 1991–2020 normal. This ties with 2011 as the 9th warmest June since records commenced in 1895 (Table 1). Eight of the fifteen warmest Junes of the past 131 have occurred since 2005. The average high of 81.5° was 0.5° above normal and ranks 32nd warmest. The average low of 62.2° was 2.6° above normal and ranks 3rd warmest (tied with 1973). The northern climate division averaged 70.1° (+1.5°, 10th warmest), the southern division 73.0° (+1.6°, 8th warmest), and the coastal division 72.3° (+1.8°, 7th warmest).
| Rank | Year | June Avg. Temp. |
| 1 | 2010 | 73.9° |
| 2 | 1943 | 73.6° |
| 3 | 2024 | 73.4° |
| 4 | 2008 | 73.0° |
| 4 | 1925 | 73.0° |
| 6 | 1994 | 72.2° |
| 7 | 2005 | 72.1° |
| 8 | 1957 | 72.0° |
| 9 | 2025 | 71.9° |
| 9 | 2011 | 71.9° |
| 11 | 2021 | 71.8° |
| 11 | 1934 | 71.8° |
| 13 | 2020 | 71.5° |
| 13 | 1973 | 71.5° |
| 15 | 1976 | 71.4° |
Table 1. The 15 mildest Junes across NJ since 1895.
Rainfall was quite sparse, especially in the south. Statewide, precipitation averaged 2.64” (Figure 1). This was 1.66” below normal and ranks as the 25th driest June on record. This was the fourth June this century to rank so dry. The north averaged 2.98” (-1.63”, 34th driest), the south 2.45” (-1.69”, 26th driest), and the coast 2.14” (-1.71”, 24th driest). While these low totals are concerning, especially in a hot summer month, the near-average rains of early spring and the wet May led the NJ Department of Environmental Protection to lift the statewide Drought Warning issued in November 2024, only retaining a Drought Watch in the Coastal South division. This retention was the result of continuing below-normal groundwater levels in this region with its sandy substrate.
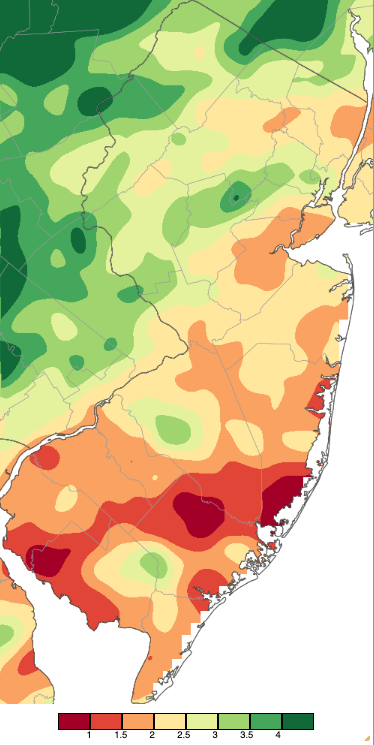
Figure 1. June 2025 precipitation across New Jersey based on a PRISM (Oregon State University) analysis generated using NWS Cooperative, CoCoRaHS, NJWxNet, and other professional weather station observations from 8 AM on May 31st to 8 AM on June 30th. Note the scale in inches at the bottom of the map. Totals range from 0.50”–0.99” (dark red) to 4.00”–4.49” (dark green).
Temperature
The first 18 days of June at the National Weather Service New Brunswick (Middlesex County) Cooperative station averaged 1.5° below the 1991–2020 normal while the last 12 averaged 5.4° above normal. So went a mid-month pattern flip. Looking at daily low temperatures during the month at the 69 Rutgers NJ Weather Network stations, there were 17 days with lows of 55° or cooler at one or more location. Of these, five found lows from 39°–49°. Walpack (Sussex) dipped to 40° on the 1st, with 51 stations from 41°–50°. Fortescue (Cumberland) was mildest at 56°. The 2nd was the coldest June day, with Hopewell Township (Mercer) at 39°, three stations at 40°, and 55 from 41°–50° (Figure 2). West Cape May (Cape May) was mildest at 57°. Sandyston (Sussex) and High Point Monument (Sussex) dipped to 40° on the 3rd, with 37 stations from 41°–50°. The 4th found Walpack at 44° and eleven locations from 47°–50°. Atlantic City Marina (Atlantic) only fell to 64°. Signifying the end to this cool start, later that afternoon, Walpack doubled its morning low with a maximum of 88°. The last 40° morning of the month was the 10th, when Sandyston reached 49°. From the 14th on, High Point Monument had lows from 52°–55° on seven days, while only three of these days saw from one to seven other stations at 53°–55°.

Figure 2. Minimum temperatures on June 2nd based on a PRISM (Oregon State University) analysis generated using NWS, NJWxNet, and other professional weather stations. Note the 2-degree scale beneath the map.
Fifteen June afternoons found the 90° mark equaled or bested at one or more NJWxNet station. Six of these included stations ≥ 95°, with three of these having locations ≥ 100°. Those days in the 90°–94° range included the 4th, 5th, 6th, 12th, 18th, 21st, 22nd, 28th, and 30th. On the 12th, 36 stations rose to 90°–93°, including the north coastal station at Sea Girt (Monmouth). As the top time series in Figure 3 shows, there was a consistent and gradual rise and fall of the thermometer at Sea Girt on this clear day. Such was not the case at two other coastal stations. The middle time series in Figure 3 shows the same approximate 15° morning rise at Harvey Cedars (Ocean) as found at Sea Girt. However, once a sea breeze arrived, the afternoon and evening found cooler and somewhat variable temperatures in the mid to upper 70°s. Only once was the breeze briefly interrupted with a land breeze showing a rise to the daily high of 87° at 5:35 PM. Farther south at West Cape May, a 20° rise from morning to early afternoon was accompanied by a notable decline in dew point temperature, something not seen at Sea Girt (there are no dew point observations at Harvey Cedars; bottom time series in Figure 3). Subsequently, sea breeze cooling saw the dew point rise and temperatures decline through the upper 70°s.
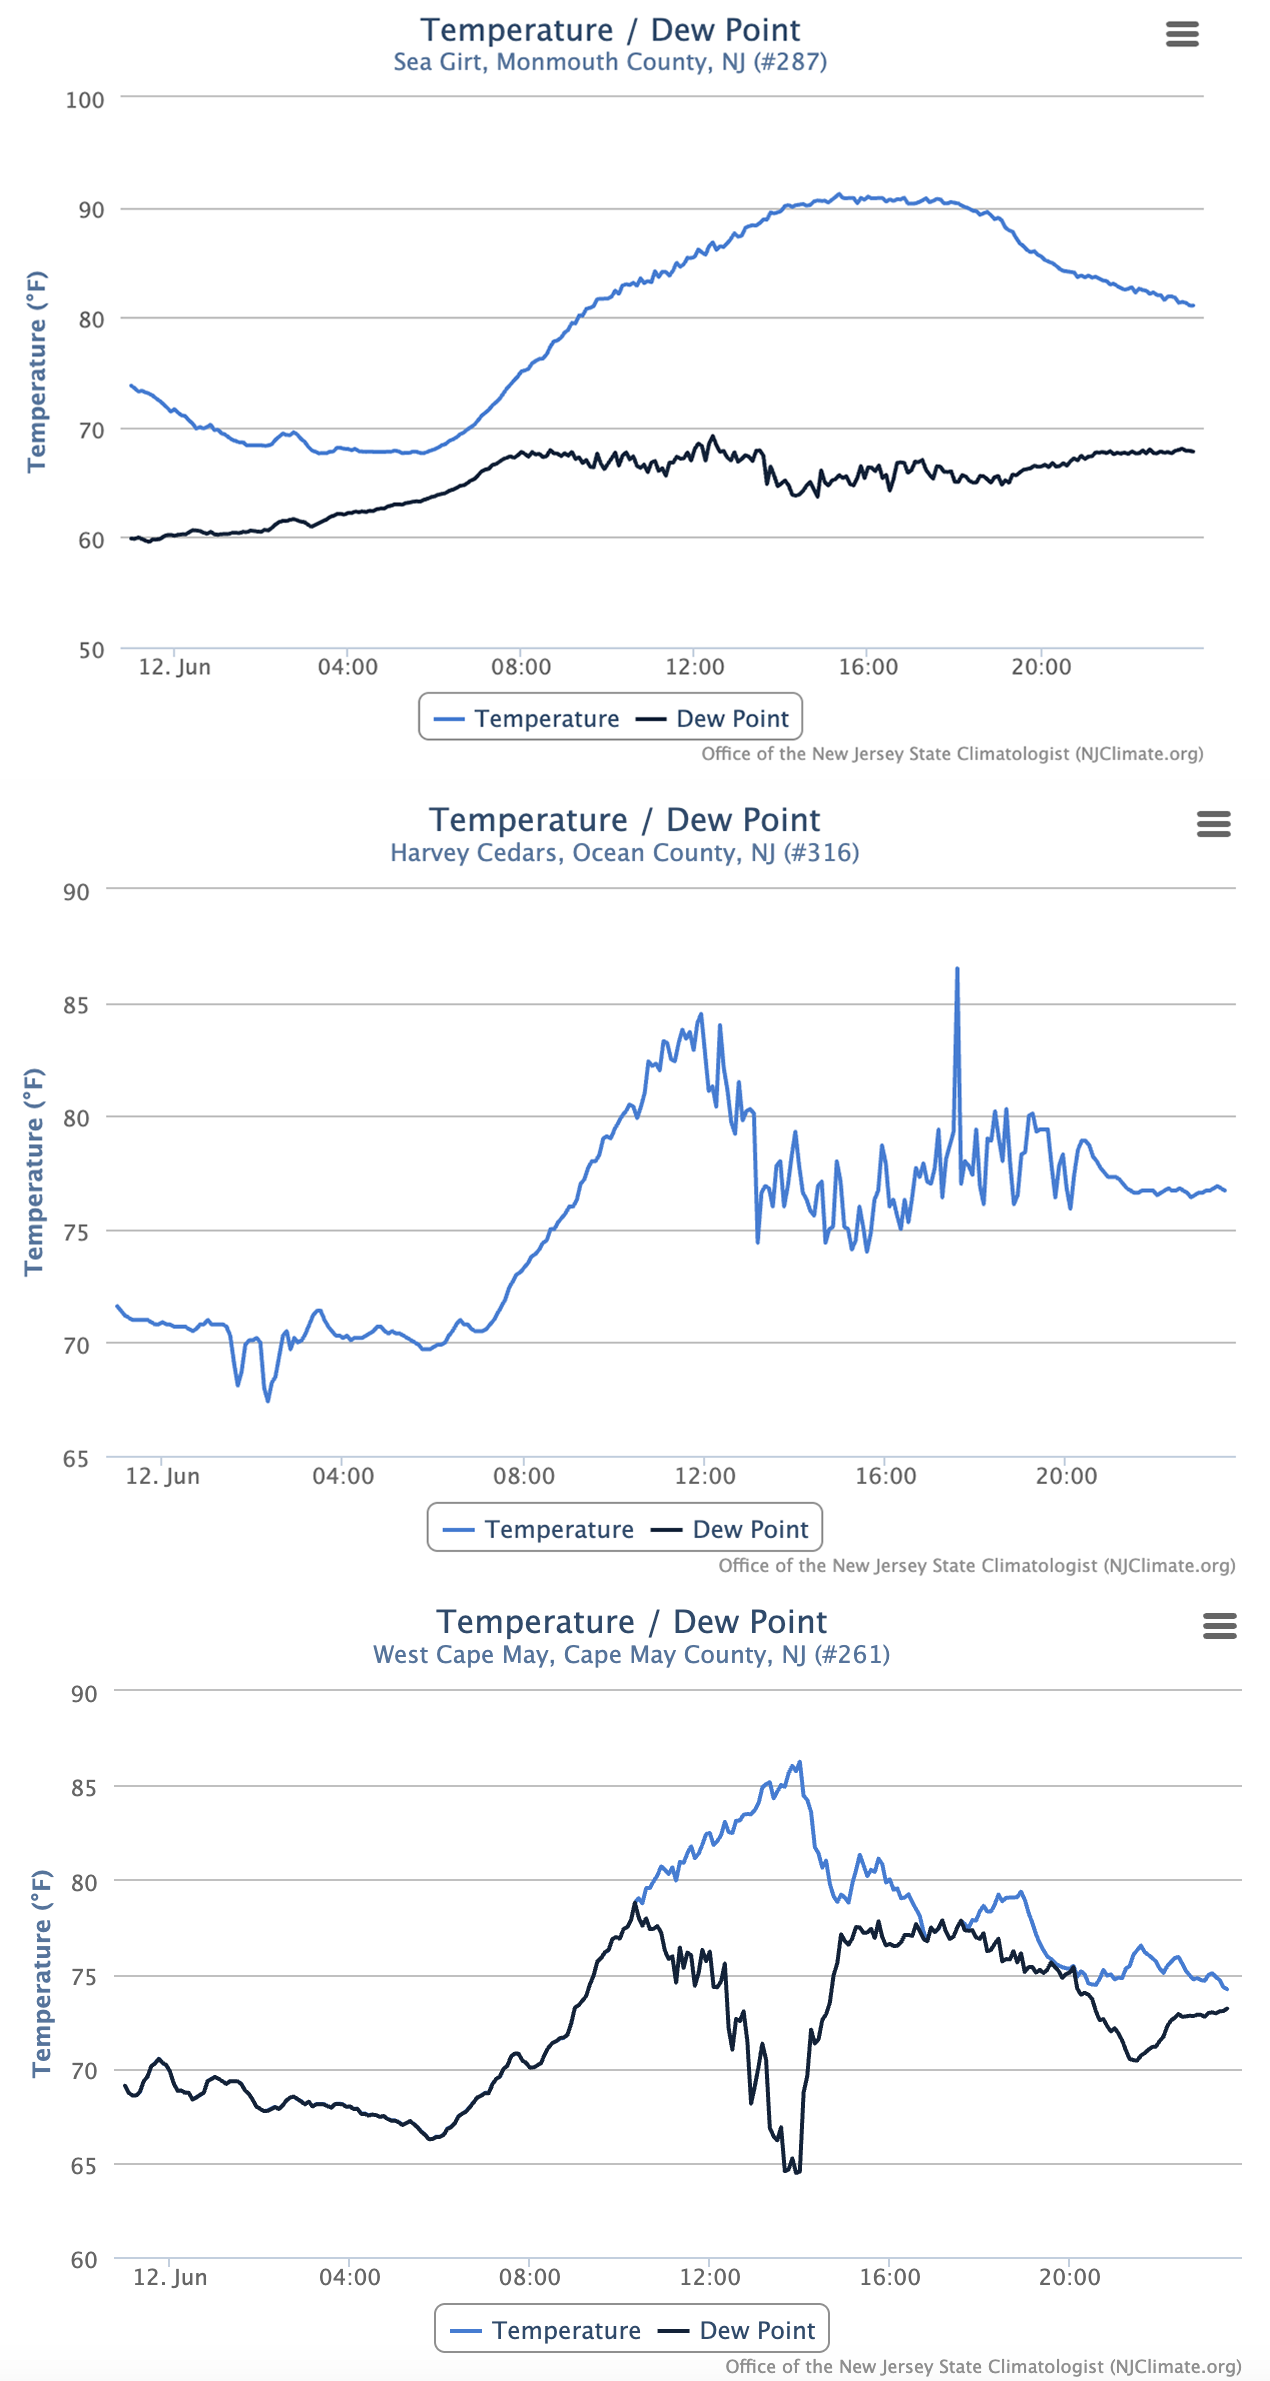
Figure 3. Time series of temperature and dew point at Sea Girt (top), temperature at Harvey Cedars (middle), and temperature and dew point at West Cape May NJWxNet stations from 11:35 PM on June 11th to 11:35 PM on June 12th.
Hotter days began with 95° reached at both Fort Dix (Burlington) and Howell (Monmouth) on the 19th, when 45 stations were from 90°–94°. Three consecutive days with stations ≥ 100° began on the 23rd, when five stations reached 101° and twelve hit 100°. The 95°–99° mark was reached at 46 locations, with Harvey Cedars and Sea Girt “coolest” at 89°. Exceedingly high dew point temperatures in the mid 70°s to low 80°s led to mid-afternoon heat index readings exceeding 110° at numerous locations (Figure 4). The New Brunswick Coop station (co-located with the NJWxNet station) reached 100° (recorded at the standard morning observation time for the past 24 hours on the 24th but achieved on the afternoon of the 23rd) for this station’s first June 100° reading dating back to its inception in 1896. June 2, 1901, had previously been the earliest 100° occurrence. Newark Airport (Union) at 101° and Atlantic City Airport in Pomona (Atlantic) at 98° also had record highs.
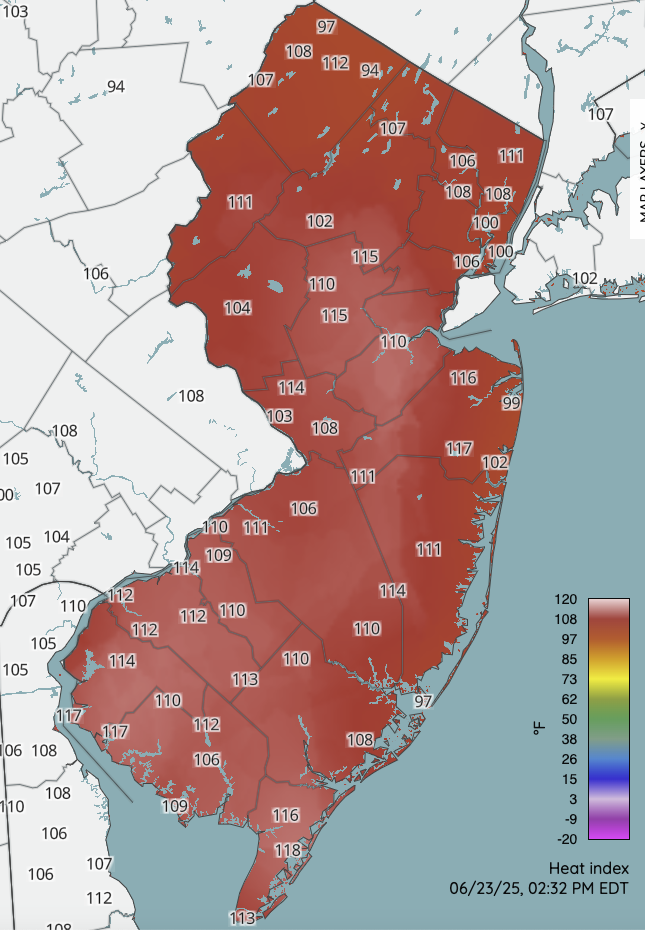
Figure 4. Heat index at 2:30 PM on June 23rd based on NJWxNet, NWS, and Delaware Environmental Observing System Network (DEOS) professional weather stations.
The 24th was the hottest day in several years. Hammonton (Atlantic), Toms River (Ocean), Woodland Township (Burlington), and Newark Airport baked at 103°, 34 stations hit 100°–102°, and 25 topped out at 95°–99° (Figure 5). The lowest maximum was 93° at Harvey Cedars, High Point Monument, and Vernon Township (Sussex), the frequently coolest shore station and the two highest elevation stations, respectively. The 103° at Newark Airport tied with June 30, 2021, as the hottest June day at this location (records 1931–present). The 102° at Atlantic City Airport was the second highest June reading on record and the sixth highest of any month. Four stations had morning lows between 65° (Sandyston) and 69°, four had lows of 80°–83°, while all other stations bottomed out in the 70°s. By late evening, non-urban stations in north Jersey had fallen into the mid-70°s to low 80°s, while urban and coastal stations were only down to the mid 80°s to low 90°s (Figure 6). Record high minimums were recorded at Atlantic City Airport 78°and Newark Airport 82°. The latter was a record for June and the 5th highest on record for any month.
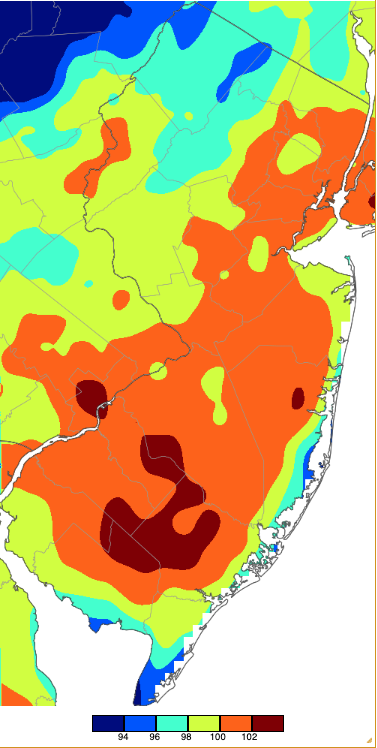
Figure 5. Maximum temperatures on June 24th based on a PRISM (Oregon State University) analysis generated using NWS, NJWxNet, and other professional weather stations.
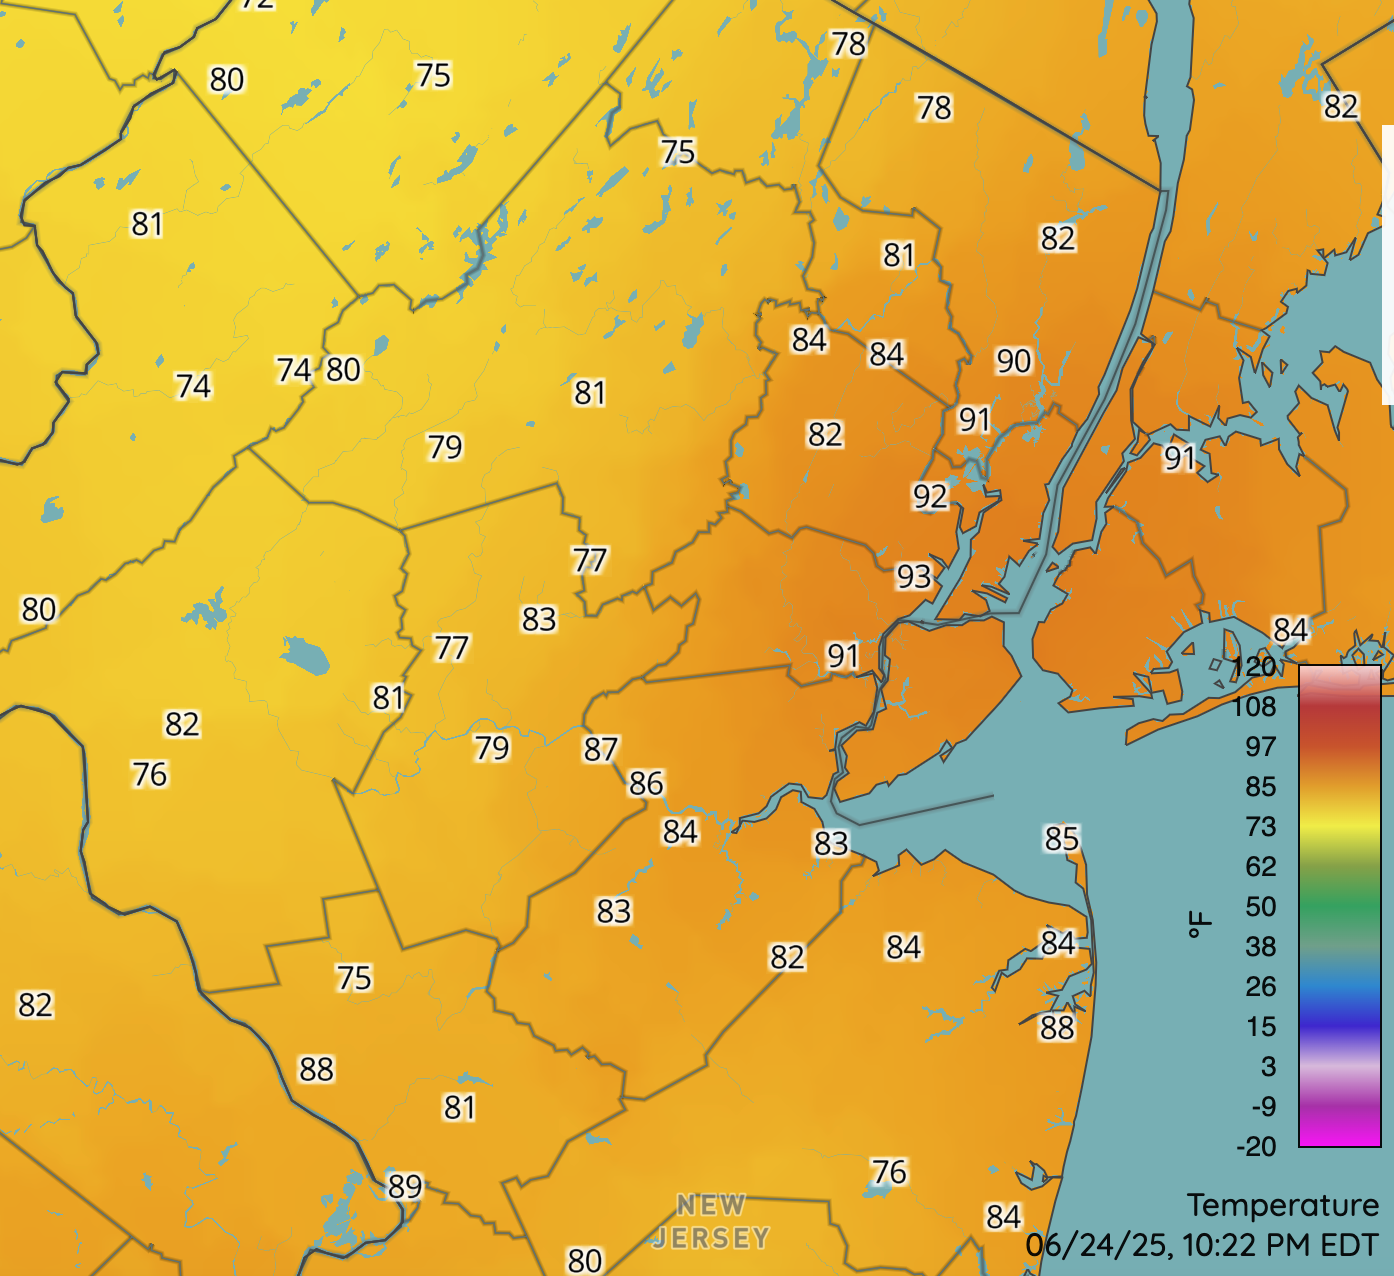
Figure 6. Temperatures at 10:20 PM on June 24th based on NJWxNet, NWS, Shrewsbury Weather Network, and DEOS professional weather stations.
The torrid conditions continued on the 25th with Hammonton up to 102°, eleven stations either 100° or 101°, and 46 from 95°–99°. Six stations only fell to 80°–82° for morning lows. A backdoor cool front began to invade NJ from the northeast the morning of the 26th. By midday, the northeast half of the state had temperatures near 70°, while the far southwest baked (Figure 7). Daily highs made it to 98° in Lower Alloways Creek Township (Salem) and Vineland (Cumberland), with 95°–96° at four locations. Time series show how differently temperatures fluctuated around NJ that day (Figure 8). High Point Monument (top) remained in the clouds all day, while gradually cooling. Hillsborough-Duke (Somerset; second from top) saw clouds roll in around midday following morning warming, only to see later sun bring temperatures back up a bit. Harvey Cedars (third down) saw rather stable morning temperatures until easterly winds arrived to consistently lower the afternoon temperatures. Lower Alloways Creek Township (bottom) had to wait until late in the afternoon to see the thermometer stop climbing and the dew point begin to decline, with later cooling in hours past the end of the time series shown in the figure.
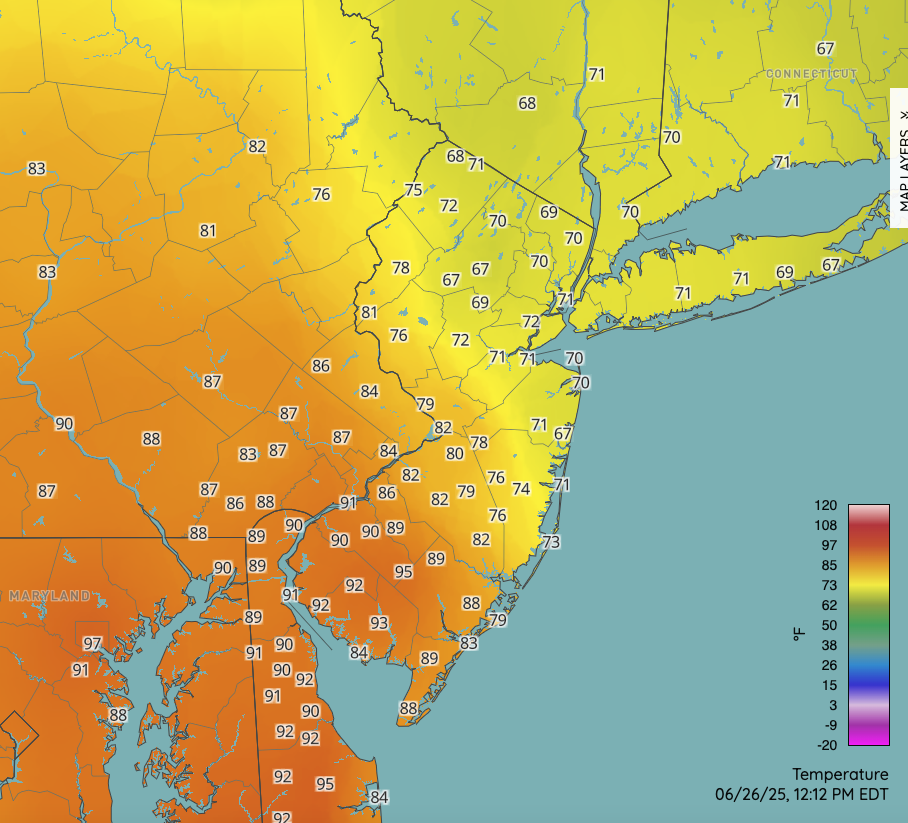
Figure 7. Temperatures at 12:10 PM on June 26th based on NJWxNet, NWS, Shrewsbury Weather Network, and DEOS professional weather stations.
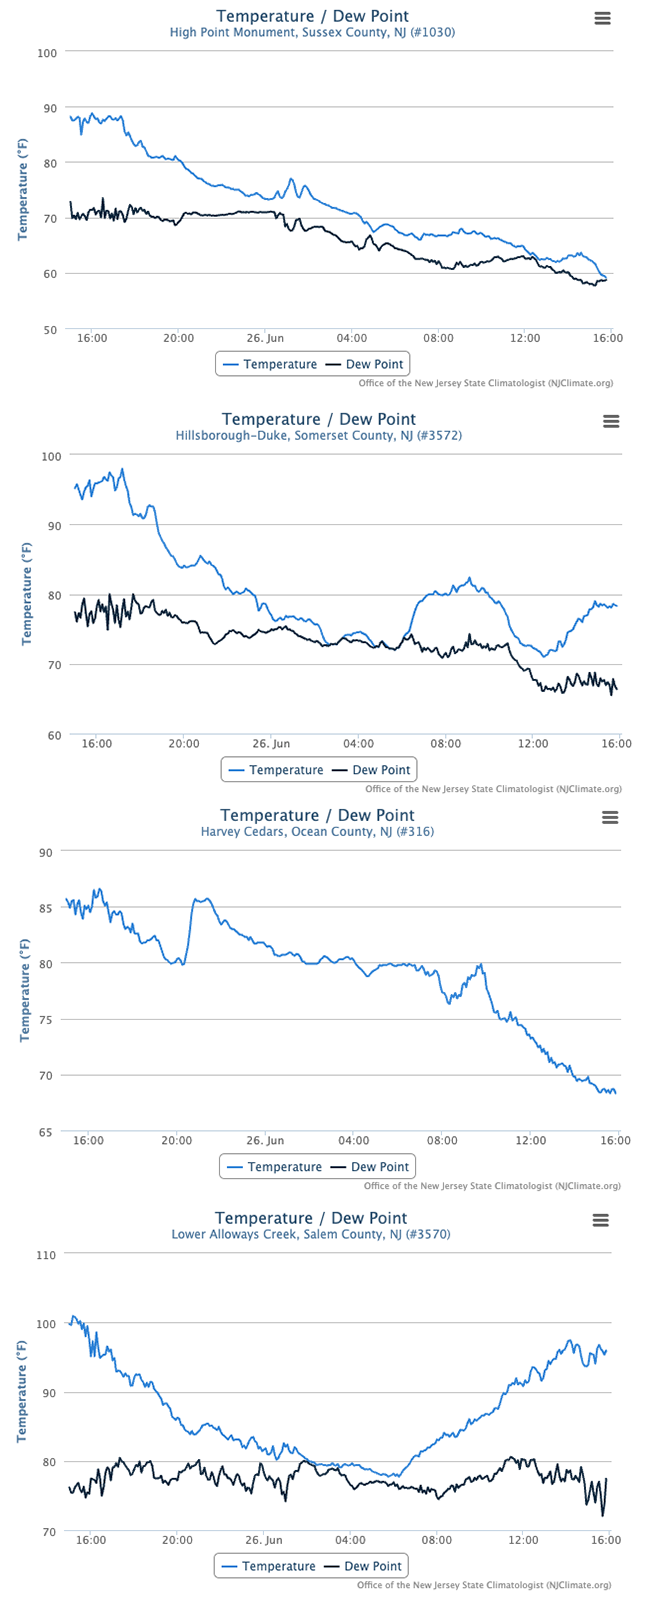
Figure 8. Time series of temperature and dew point at Hammonton (top), and Hillsborough/Duke (second), temperature at Harvey Cedars (third) and temperature and dew point at Lower Alloways Creek Township (bottom) NJWxNet stations from 3:50 PM on June 25th to 3:50 PM on June 26th.
Statewide, most of the 27th was spent in the 60°s. Warmth soon returned with nine stations making it into the low 90°s on the 28th. Hammonton and Woodland Township led the way with 97° highs on the 29th, with nine stations at 95° or 96°. Eight stations rose to 94° before storms arrived on the 30th.
Precipitation and Storms
As expected in a summer month with the precipitation theme being widely scattered showers, local June totals varied by over a factor of seven. Leading the pack was Vernon Township with 4.81”, followed by Long Hill Township (Morris) 4.71” and 4.09” (two stations), Medford Lakes (Burlington) 4.25”, Newton (Sussex) 4.21”, Medford (Burlington) 4.14”, and Ringwood (Passaic) 4.12”. On the dry side, Egg Harbor City (Atlantic) could only muster 0.63”, Hammonton 0.67”, Upper Deerfield (Cumberland) 0.72”, Mullica Township (Atlantic) 0.76”, Surf City (Ocean) 0.82”, and Little Egg Harbor Township (Ocean) 0.85”.
June began with five dry days that, at times, found cloudless skies a milky blue, the result of smoke passing through at 20,000 feet above the surface, originating from central Canadian wildfires. Attention next turned to widely scattered thunderstorms the afternoon and evening of the 6th, a common theme that unfolded throughout the remainder of the month. Storms produced rain that locally exceeded 0.50” but rarely covered much territory. In this case, Clinton Township (Hunterdon) picked up 0.65”, Lebanon (Hunterdon) and Flemington (Hunterdon) each with 0.60”, and down south 0.58” at Maurice River Township (Cumberland).
Late morning and afternoon showers on the 7th delivered 1.05” to Greenwich Township (Gloucester), Montague Township (Sussex) 0.94”, High Point Monument 0.79”, and Woodbridge Township (Middlesex) 0.67”. Afternoon showers on the 8th persisted into the predawn 9th dropping 1.10” in Wildwood Crest (Cape May), North Wildwood (Cape May) 0.98”, and West Cape May 0.61”. Showers resumed later the 9th, this time in the north where Long Hill Township caught 1.40”, Ringwood 1.13”, and Bernards Township (Somerset) 1.02”. More substantial rain fell during midday on the 10th in a band from central into northeast NJ (Figure 9). Long Hill Township again led the way with 1.50”, Basking Ridge (Somerset) 1.49”, Warren Township (Somerset) 1.43”, and Watchung (Somerset) 1.34”. Eighteen of 261 NJ CoCoRaHS stations picked up from 1.00”–1.50” and 37 from 0.50”–0.99”.
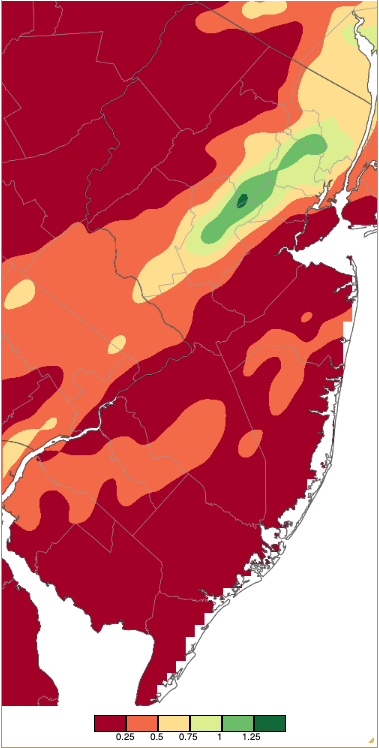
Figure 9. Precipitation across New Jersey from 8 AM on June 10th through 8 AM June 11th based on a PRISM (Oregon State University) analysis generated using NWS Cooperative, CoCoRaHS, NJWxNet, and other professional weather station observations.
Conditions were dry enough in the Pinelands for a wildfire to break out and quickly spread within Wharton State Forest situated in Shamong Township (Burlington) on the 14th. Named the Mines Spring Wildfire, most of the acreage was consumed during the first two days but the fire was not 90% contained until the 18th after scorching 6,400 acres. Smoke from the fire mainly traveled to the south, lowering visibility at times and bringing smoke that could be easily smelled at ground level.
The most widespread rain event of the month occurred during the morning and afternoon of the 14th (Figure 10). Larger totals included Hopewell Township 1.40”, Medford Township and Hopewell (Mercer) each with 1.38”, and Plainsboro (Middlesex) 1.37. Twenty of 255 CoCoRaHS station reports were from 1.00”–1.40” and 87 from 0.50”–0.99”.
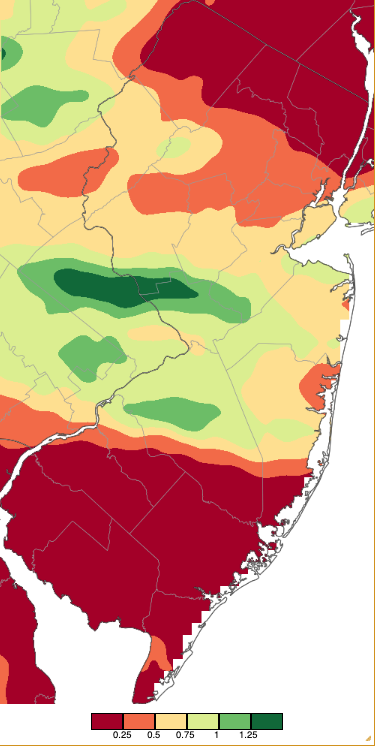
Figure 10. Precipitation across New Jersey from 8 AM on June 13th through 8 AM June 15th based on a PRISM (Oregon State University) analysis generated using NWS Cooperative, CoCoRaHS, NJWxNet, and other professional weather station observations.
Widely scattered afternoon and evening storms on the 18th delivered 2.17” and 1.42” to two Vernon Township gauges, Ramsey (Bergen) 1.73”, Walpack 1.52”, and Manasquan (Monmouth) 1.28”. However, only eleven of 236 CoCoRaHS reports exceeded 0.50”.
Windy storms moved through the state during the PM hours of the 19th. Again, Basking Ridge, Long Hill Township, and Watchung were targeted, receiving 1.14”, 1.05”, and 0.96”, respectively. Chatham (Morris) and Springfield Township (Union) each caught 0.93”, leading 38 CoCoRaHS stations (of 254) receiving from 0.50”–0.93”. Winds gusted to 61 mph at Lower Alloways Creek Township, Pennsauken (Camden) 57 mph, Logan Township (Gloucester) and Moorestown (Burlington) each at 50 mph, and eleven other NJWxNet stations 40–49 mph.
A line of fast-moving midday storms moved through NJ from northwest to southeast on the 22nd. They brought no more than 0.23” to Montague but generated a 48-mph gust at Lower Alloways Creek Township. Once again, there were widely scattered showers on the afternoon into the evening of the 25th. A storm parked over the Medford Lakes and Medford Township area deposited, respectively, 2.92” and 2.77”. Two Woodbine (Cape May) locations picked up 1.08” and 1.04”, though another station in town picked up just 0.21”. Other than these observations, only six of 221 CoCoRaHS stations picked up as much as 0.50”–0.93”. Afternoon and evening showers on the 26th brought 0.79” to Millville (Cumberland) and 0.34” at both Morris Township (Morris) and Peapack-Gladstone (Somerset). The pre-dawn hours of the 30th brought thunderstorms totaling 1.55” at Estell Manor (Atlantic), 1.41” to two Galloway (Atlantic) gauges, Millville 1.29”, two Brigantine (Atlantic) stations with 0.97” and 0.84”, and 0.50”–0.78” at ten of 193 CoCoRaHS sites.
Afternoon and evening storms on the 30th, in some areas continuing into the pre-dawn hours of July 1, deposited 3.65” and 3.16” in two Woodland Township gauges, West Windsor Township (Mercer) 2.34”, Princeton (Mercer) 2.14” and 1.95”, Pennington (Mercer) 1.77” and 1.52”, Cedar Bridge (Burlington) 1.66”, and Burlington (Burlington) 1.50”. Twenty-eight of 239 CoCoRaHS reports came in from 1.00”–1.50” and 66 from 0.50”–0.99”. As mentioned many times in previous reports, daytime and evening precipitation on the last day of a month falls after the common 6 AM–9 AM reporting interval for most Cooperative and CoCoRaHS observations. Therefore, this later precipitation is applied to first day of the next month, in this case, July 2025 totals. Still, it was worth mentioning this event here, rather than with a month delay.
The highest barometric pressures of the month ranged from 29.50”–29.65” on the 1st to 30.20”–30.30” on the 27th. The only 40 mph gusts were on the 19th and 22nd.
First Half of 2025 OverviewMuch as with this past June, the enigma moniker seems appropriate for the entire first half of 2025. The year began with the coldest month (January 2025, 28.1°) since February 2015 (22.3°) and the largest negative monthly departure (-3.6°) from normal since November 2019 (-3.8°). Yet matters transitioned to the 10th mildest March, 6th mildest spring, and 9th warmest June. A La Niña circulation pattern across North America meant that winter coastal storms were few, contributing to the 3rd driest January on record and a snow season that underperformed except in the far south, where several January storms headed directly out to sea from the lower Mid-Atlantic region. Monthly precipitation remained below normal through April, though enough fell in February through April to begin replenishing groundwater, streams, and reservoirs following the record dry fall and dry early winter. Then along came May, with several storms that the winter had not been able to produce contributing to a 7th wettest ranking. Finally, dry conditions returned in June, which went from cool to record warmth. To be sure, mysterious, puzzling, and at times difficult to understand!
The first six months averaged 49.2°, which was 0.9° above the 1991–2020 normal and ranks as the 16th warmest on record. Dating back 131 years (to 1895), 14 of the 20 warmest January–June periods have occurred since 2000.
| Rank | Year | Jan.–June Avg. Temp. |
| 1 | 2012 | 52.0° |
| 2 | 2024 | 51.3° |
| 3 | 1998 | 50.9° |
| 4 | 2023 | 50.9° |
| 5 | 2020 | 50.3° |
| 6 | 2010 | 50.3° |
| 7 | 2017 | 50.3° |
| 8 | 2002 | 50.2° |
| 9 | 1991 | 50.2° |
| 10 | 2006 | 49.9° |
| 11 | 1990 | 49.6° |
| 12 | 1921 | 49.4° |
| 13 | 1949 | 49.4° |
| 14 | 2016 | 49.3° |
| 15 | 2008 | 49.2° |
| 16 | 2025 | 49.2° |
| 16 | 2021 | 49.2° |
| 18 | 1953 | 49.0° |
| 19 | 2019 | 49.0° |
| 20 | 2008 | 48.8° |
Table 2. The 20 warmest January–June periods since 1895.
Statewide precipitation (rain and melted snow) for the first half of 2025 averaged 20.29”. This was 2.01” below normal and ranks as the 50th driest on record. It was 5.20” drier than the first half of 2024. Totals were greatest in the Highlands and driest in the east and parts of the south (Figure 11). Coming in with the most precipitation was West Milford Township (Passaic) with 27.77”, followed by Mine Hill Township (Morris) 26.85”, Ringwood (Passaic) 26.67”, Galloway Township (Atlantic) 26.08”, and Chatham (Morris) 25.97”. On the low end was Monroe Township (Middlesex) with 18.44”, followed by Long Branch (Monmouth) 18.88”, Eatontown (Monmouth) 18.90”, Hammonton (Atlantic) 18.92”, Franklin Township (Somerset) 19.28”, and Franklin Township (Gloucester) 19.36”.
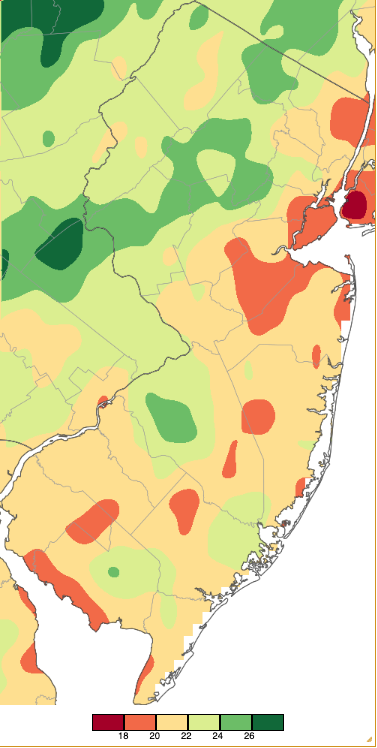
Figure 11. January–June 2025 precipitation across New Jersey based on a PRISM (Oregon State University) analysis generated using NWS Cooperative, CoCoRaHS, NJWxNet, and other professional weather station observations from 7 AM on December 31st to 8 AM on June 30th. Note the scale in full inches at the bottom of the map. Totals range from 16.00”–17.99” (dark red) to 26.00”–27.99” (dark green).
For those seeking more detailed information on 5-minute, hourly, daily, and monthly conditions, please visit the following Office of the NJ State Climatologist's websites:
Rutgers NJ Weather Network
NJ Community Collaborative Rain, Hail and Snow Network
NJ Snow Event Reports
Interested in receiving our monthly summaries at the end of each month? Send us your e-mail address here to join the mailing list.
Past News Stories

