It’s Been A While: November 2021
A Common Theme: Fall 2021 Recap
New Jersey State Climatologist
Center for Environmental Prediction, School of Environmental and Biological Sciences/NJAES, Rutgers University
December 7, 2021
November Overview
November was the first month since May 2020 with both averages of precipitation and temperature below 1991–2020 normals. The last drier-than-normal month was this past June while the last cooler-than-normal month was this past May. However, it’s been a while, 19 months, since the two anomalies teamed up. And dry it was, with the statewide average of 1.06” running 2.29” below normal. This ranks as the 7th driest November since records commenced in 1895 (Table 1). Only two other Novembers since 1936 fall in the top 10.
| Rank | Year | Nov. Avg. Precip. |
| 1 | 1917 | 0.54” |
| 2 | 1976 | 0.59” |
| 3 | 1922 | 0.82” |
| 4 | 1931 | 0.85” |
| 5 | 2001 | 1.00” |
| 6 | 1908 | 1.02” |
| 7 | 2021 | 1.07” |
| 8 | 1933 | 1.10” |
| 8 | 1936 | 1.10” |
| 10 | 1903 | 1.29” |
Table 1. The ten driest Novembers across NJ since 1895.
The lower and middle Delaware basin and some points to the east were driest and the northwest least dry (Figure 1). Overall, the north averaged 1.40” (-2.07”, 13th driest), the south 0.86” (-2.43”, 5th driest), and the coast 0.86” (-2.48”, 5th driest). Some locations picked up their first measurable snow of the season but on average the statewide and regional monthly totals were a trace. That is 1.1” below the 1894–2020 average and 0.5” below the 1991–2020 average.
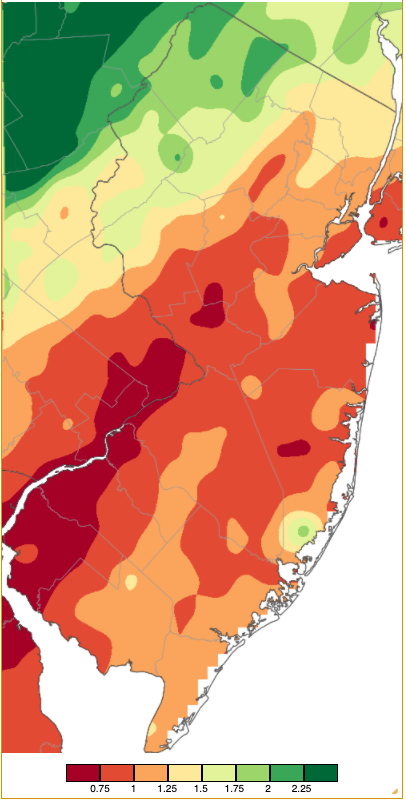
Figure 1. November 2021 precipitation across New Jersey based on a PRISM (Oregon State University) analysis generated using NWS Cooperative and CoCoRaHS observations from 7 AM on October 31st to 7 AM on November 30th. Note the scale in quarters of an inch at the bottom of the map. Totals range from 0.50”–0.75” (dark red) to greater than 2.25” (dark green).
The statewide average November temperature of 43.9° was 1.2° below the 1991–2020 normal and ranked as the 73rd coolest of the past 127 years. This was 17.2° cooler than the mild average of this past October. The normal difference between the months is 10.2°. The average maximum was 54.5° (-0.2°, 84th coolest) and the average minimum was 33.2° (-2.3°, 47th coolest). The north averaged 41.9° (-1.2°, 74th coolest), the south 44.9° (-1.4°, 68th coolest), and the coast 46.0° (-1.3°, 70th coolest). The first Rutgers NJWxNet or NWS Cooperative station to reach the freezing point this season was Pequest (Warren County), late on the 2nd. This was the latest first freeze in NJ since at least 1900 (based on Coop records). The last location to reach freezing was West Cape May (Cape May) on the 28th, on the late side but not unusually so.
Temperature
There were 11 November days when high temperatures at one or more NJWxNet station reached or exceeded 60°, with three of those days making it to 70°. The 1st found Cape May Court House (Cape May) up to 64°. Next came a stretch of seven days above 60°, starting with 60° at Walpack (Sussex) on the 7th and 69° at six locations on the 8th. Seven stations reached 73° on the 9th, with 42 of the 65 NJWxNet stations from 70°–72°. High Point Monument (HPM; Sussex) had the state’s coolest high of 62°. Cape May Court House and Woodbine (Cape May) reached 71° on the 10th. Three stations made it to 68° on the 11th and Mannington (Salem) to 69° on the 12th. Woodbine at 68°, Cape May Court House with 67°, and 51 stations from 60°–66° finished the run on the 13th.
Warmth returned on the 17th when West Deptford (Gloucester) hit 67°. The 18th edged out the 9th as the warmest day of the month with six stations topping out at 74° and 40 from 70°–73° (Figure 2). HPM was coolest at 60°. Cooler weather prevailed for the remainder of the month, although Oceanport (Monmouth), Hammonton (Atlantic), and Piney Hollow (Gloucester) each made it to 60° on the 25th.
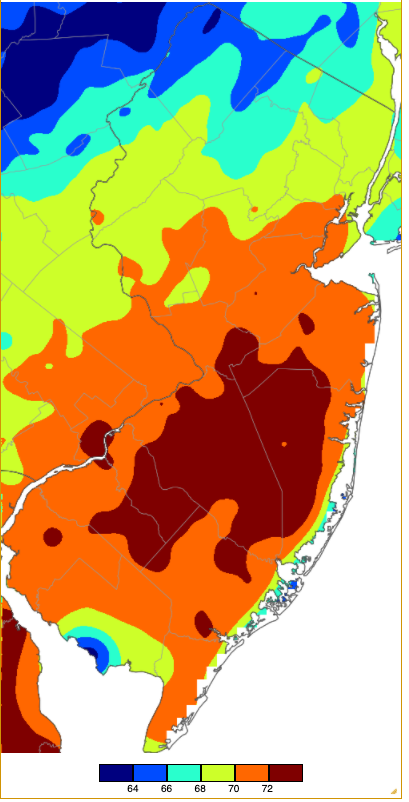
Figure 2. Maximum temperatures on November 18th based on a PRISM (Oregon State University) analysis generated using NWS, NJWxNet, and other professional weather stations. Note the 2 °F increment scale beneath the map.
Nineteen November days found one or more NJWxNet station dropping to 25°. The 4th found three at 23°, followed by Walpack and Sandyston (Sussex) at 21° on the 5th. Walpack fell to 20° and both Pequest and Sandyston 21° on the 6th, with Walpack 19° and the other two stations again 21° on the 7th. A combination of factors, including onshore flow, clouds in the south, and clear skies in the northwest resulted in Walpack having the coldest low and mildest high (60°) within the 65-station NJWxNet on the 7th. Walpack fell to 24° on the 8th, and while only reaching 27° on the 9th, it is worth noting the 44° rise to 71° that afternoon. Also of interest on the 9th was the 52° minimum at the top of the Mountain Creek ski area in Vernon Township (Sussex), indicative of a significant inversion (cold air sinking into valleys, milder air at higher elevations) in the northwest. This was the highest minimum in NJ on the 9th, tied with Atlantic City Marina (Atlantic) that sits right by what were still mild coastal waters.
Walpack was 25° on the 11th and Hopewell Township (Mercer) 24° on the 16th. Walpack dropped to 22° on the 17th and 25° on the 19th, with four stations at 21° on the 20th. As of the 20th, only the coastal locations of Seaside Heights (Ocean), Harvey Cedars (Ocean), Atlantic City Marina, and West Cape May had yet to fall to the freezing mark this fall.
Walpack was 22° on the 22nd and 19° on the 23rd. An indication of the colder air moving into the region on northwesterly winds is evident in the visible satellite image midday on the 23rd (Figure 3). Lake effect clouds are seen moving into northwest and marine clouds produced from the rush of cold air over the still mild waters is seen off the coast. Cloud “streamers” are quite prominent as they emerge from NY Harbor, Delaware Bay, and Chesapeake Bay southeast over the ocean.
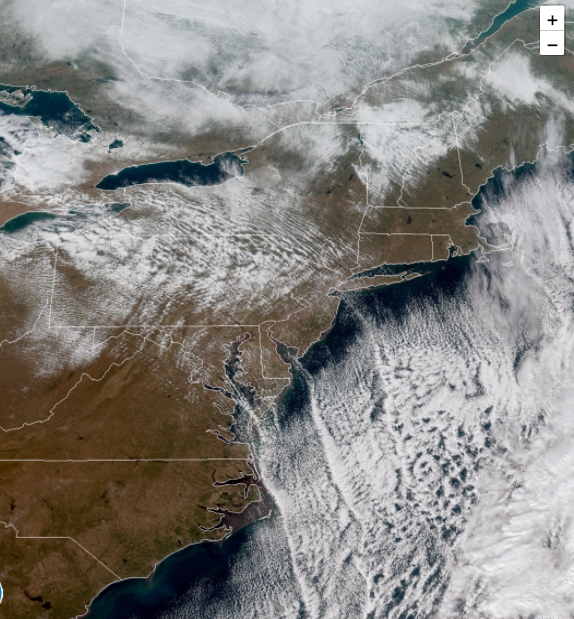
Figure 3. Visible satellite image of the Northeast and Mid-Atlantic at 12:21 PM on November 23rd (courtesy of NOAA).
On the 24th, Walpack bottomed out at 17°, Pequest 18°, Sandyston 19°, 24 stations from 20°–25°, and Atlantic City Marina dipped to 31°. Clouds to the north and clear skies to the south resulted in Vineland (Cumberland) and Hopewell Township being the coldest locations in the state at 22° on the 25th. Cold air continued to invade NJ on the 27th and 28th. The 27th brought lows of 24° to HPM and Wantage (Sussex), with the daily maximums at HPM (30°) and Vernon Township (31°), the first locations this season to remain below freezing throughout the day. HPM at 23°, High Point (Sussex) 24°, and Vernon Township 25° were coldest on the 28th, indicative of the ongoing advection of cold air into NJ, which often brings the greatest cold to higher elevations. Those winds also pushed cold inland air into West Cape May, giving them their first freeze. The advection diminished on the 29th, and with clear skies, inversions dominated the thermal landscape by late in the evening when Walpack, Pequest, Sandyston, and Hopewell Township all reached 19°. By the morning of the 30th, Walpack hit 16°, nine stations from 17°–20°, and 39 from 21°–25° (Figure 4). West Cape May was mildest at 38°, with the Delaware Bay coastal stations of Lower Alloways Creek Township (Salem) and Fortescue (Cumberland) also above freezing at 36° and 33°, respectively.
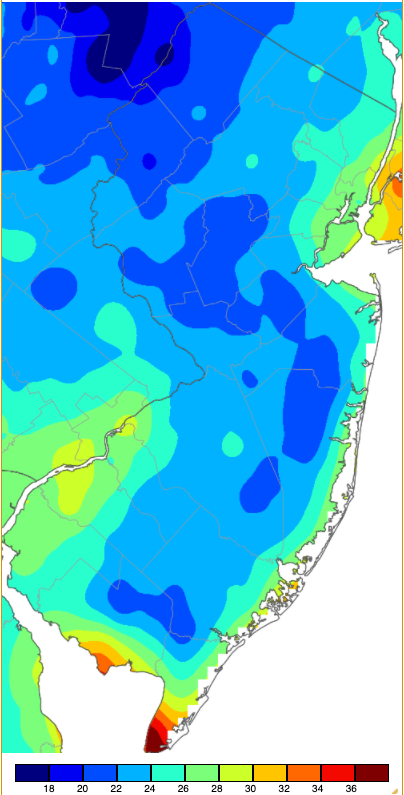
Figure 4. Minimum temperatures on November 30th based on a PRISM (Oregon State University) analysis generated using NWS, NJWxNet, and other professional weather stations. Note the in 2 °F increment scale beneath the map.
Precipitation and Storms
The sparse November precipitation resulted in only five NJWxNet and CoCoRaHS stations exceeding 2.00” for the month, all in Sussex County. Vernon Township reached 2.43” and 2.36” (two locations), High Point 2.21”, Sandyston 2.20”, and Hardyston 2.19”. Montague (Sussex) and Frelinghuysen (Warren) came close with 1.99”. On the low end, Hopewell Township and Logan Township (Gloucester) each caught just 0.50”, Lower Alloways Creek Township 0.52”, South Harrison (Gloucester) and Berkeley Township (Ocean) each 0.54”, and Cherry Hill (Camden) and Pennsauken (Camden) each 0.55”.
Snowfall totals for the month reached 1.1” in Mount Olive Township (Morris), 0.6” in Blairstown (Warren), and 0.5” at Mine Hill Township (Morris) and Mount Arlington (Morris).
Rainfall on the second reached 0.50” in Hamilton (Atlantic), with only the southern quarter of NJ picking up more than 0.10”. Snow pellets fell briefly in Kinnelon (Morris). The 3rd to 11th was precipitation-free throughout the state. This streak broke on the morning of the 12th, with the only one inch-plus rain event of the month. Mount Olive Township picked up 1.25”, Jefferson Township (Morris) 1.18”, Frelinghuysen Township 1.17”, and Hardyston 1.16”. Nine stations picked up 1.00”–1.14” and 83 of the 247 CoCoRaHS reports were from 0.50”–0.98”. Lesser amounts fell to the south (Figure 5).
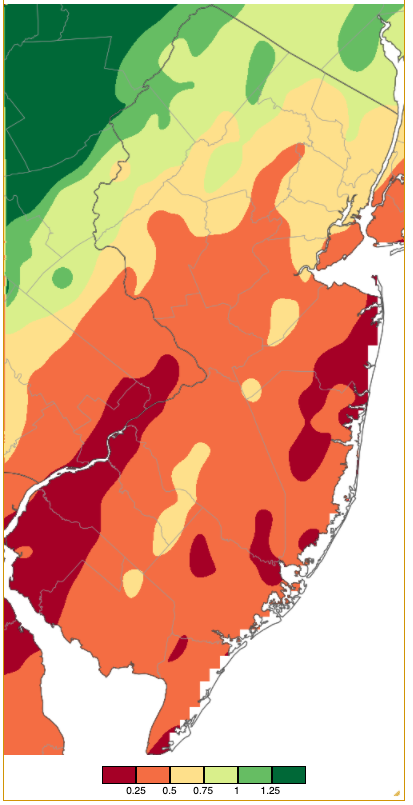
Figure 5. Precipitation across New Jersey from 7 AM on November 11th through 7 AM on November 13th based on a PRISM (Oregon State University) analysis generated using NWS Cooperative and CoCoRaHS observations. Note the scale in inches beneath the map.
The most extreme event of the month occurred from late morning into the afternoon of the 13th. A squall line brought a quick shot of localized heavy rain and hail, strong winds, and up to a 20° drop in temperature. The Highlands region bore the brunt of the extreme weather, with thunderstorms depositing as much as 0.70” in both Califon (Hunterdon) and Mount Arlington, and 0.50”–0.69” at 11 stations (Figure 6). Hail was reported in eight counties (Bergen, Hunterdon, Mercer, Middlesex, Morris, Passaic, Sussex, and Union). It ranged in size from BB size to 1 inch (Figure 7) and covered the ground in some locations (Figure 8). Rainfall totals were mainly under 0.10” in south Jersey, while winds were strong throughout the state. Gusts reached 54 mph at Seaside Heights, 51 mph in Little Egg Harbor Township (Ocean), 50 mph at Cream Ridge (Monmouth), and 40–49 mph at 16 other NJWxNet locations. The rapid drop in air and dew point temperatures and the strong gusts are seen in the 24-hour meteogram at Sea Girt (Monmouth; Figure 9).
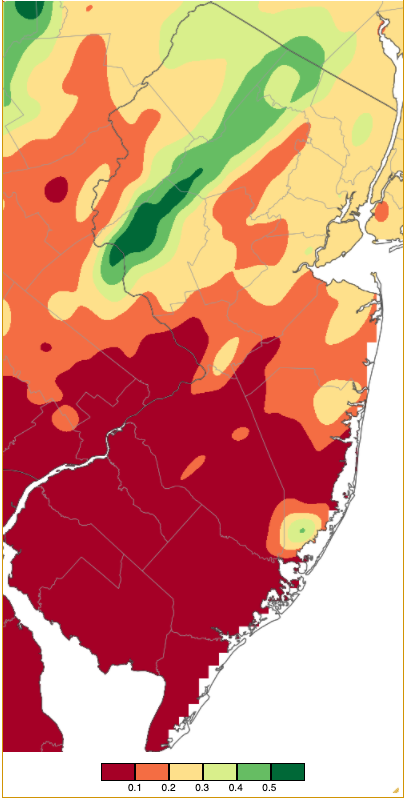
Figure 6. Rainfall from approximately 7 AM on November 13th to 7 AM on November 14th based on a PRISM (Oregon State University) analysis generated using NWS Cooperative and CoCoRaHS observations. Note the scale in inches beneath the map.
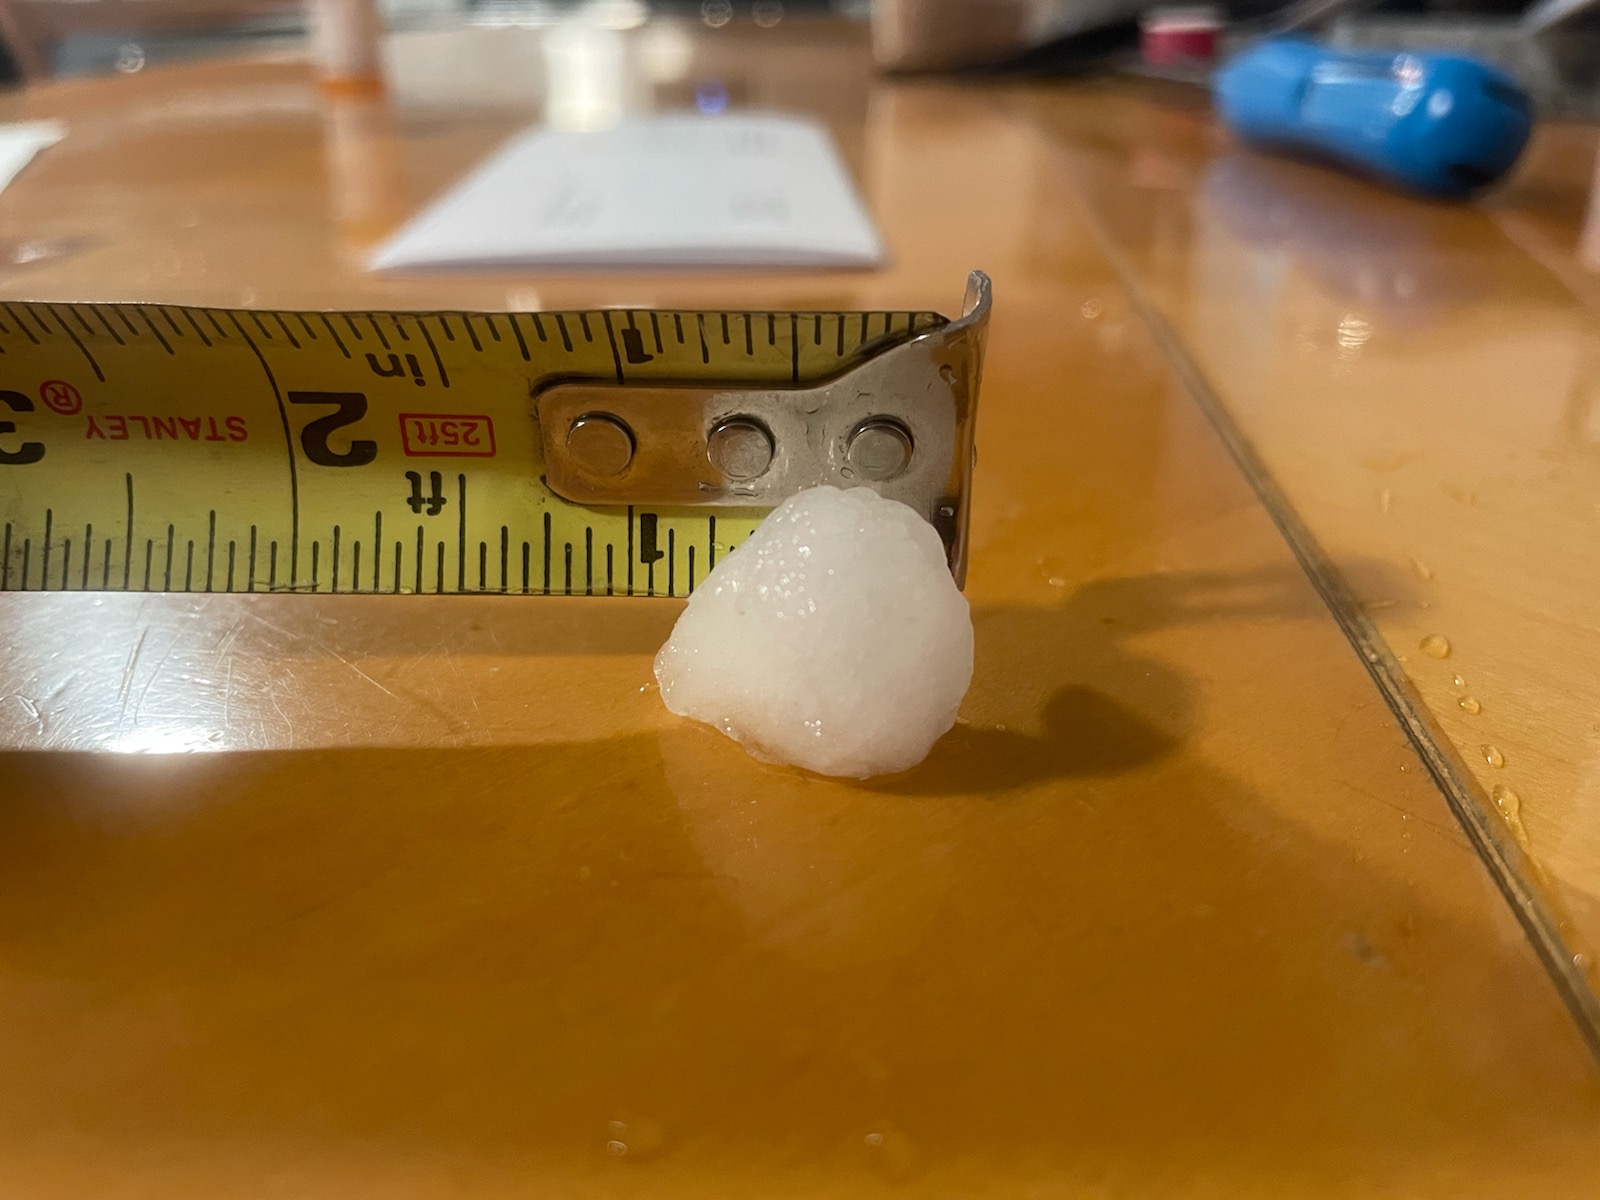
Figure 7. Hailstone that fell in Butler (Morris) on November 13th (courtesy of R. Greig).
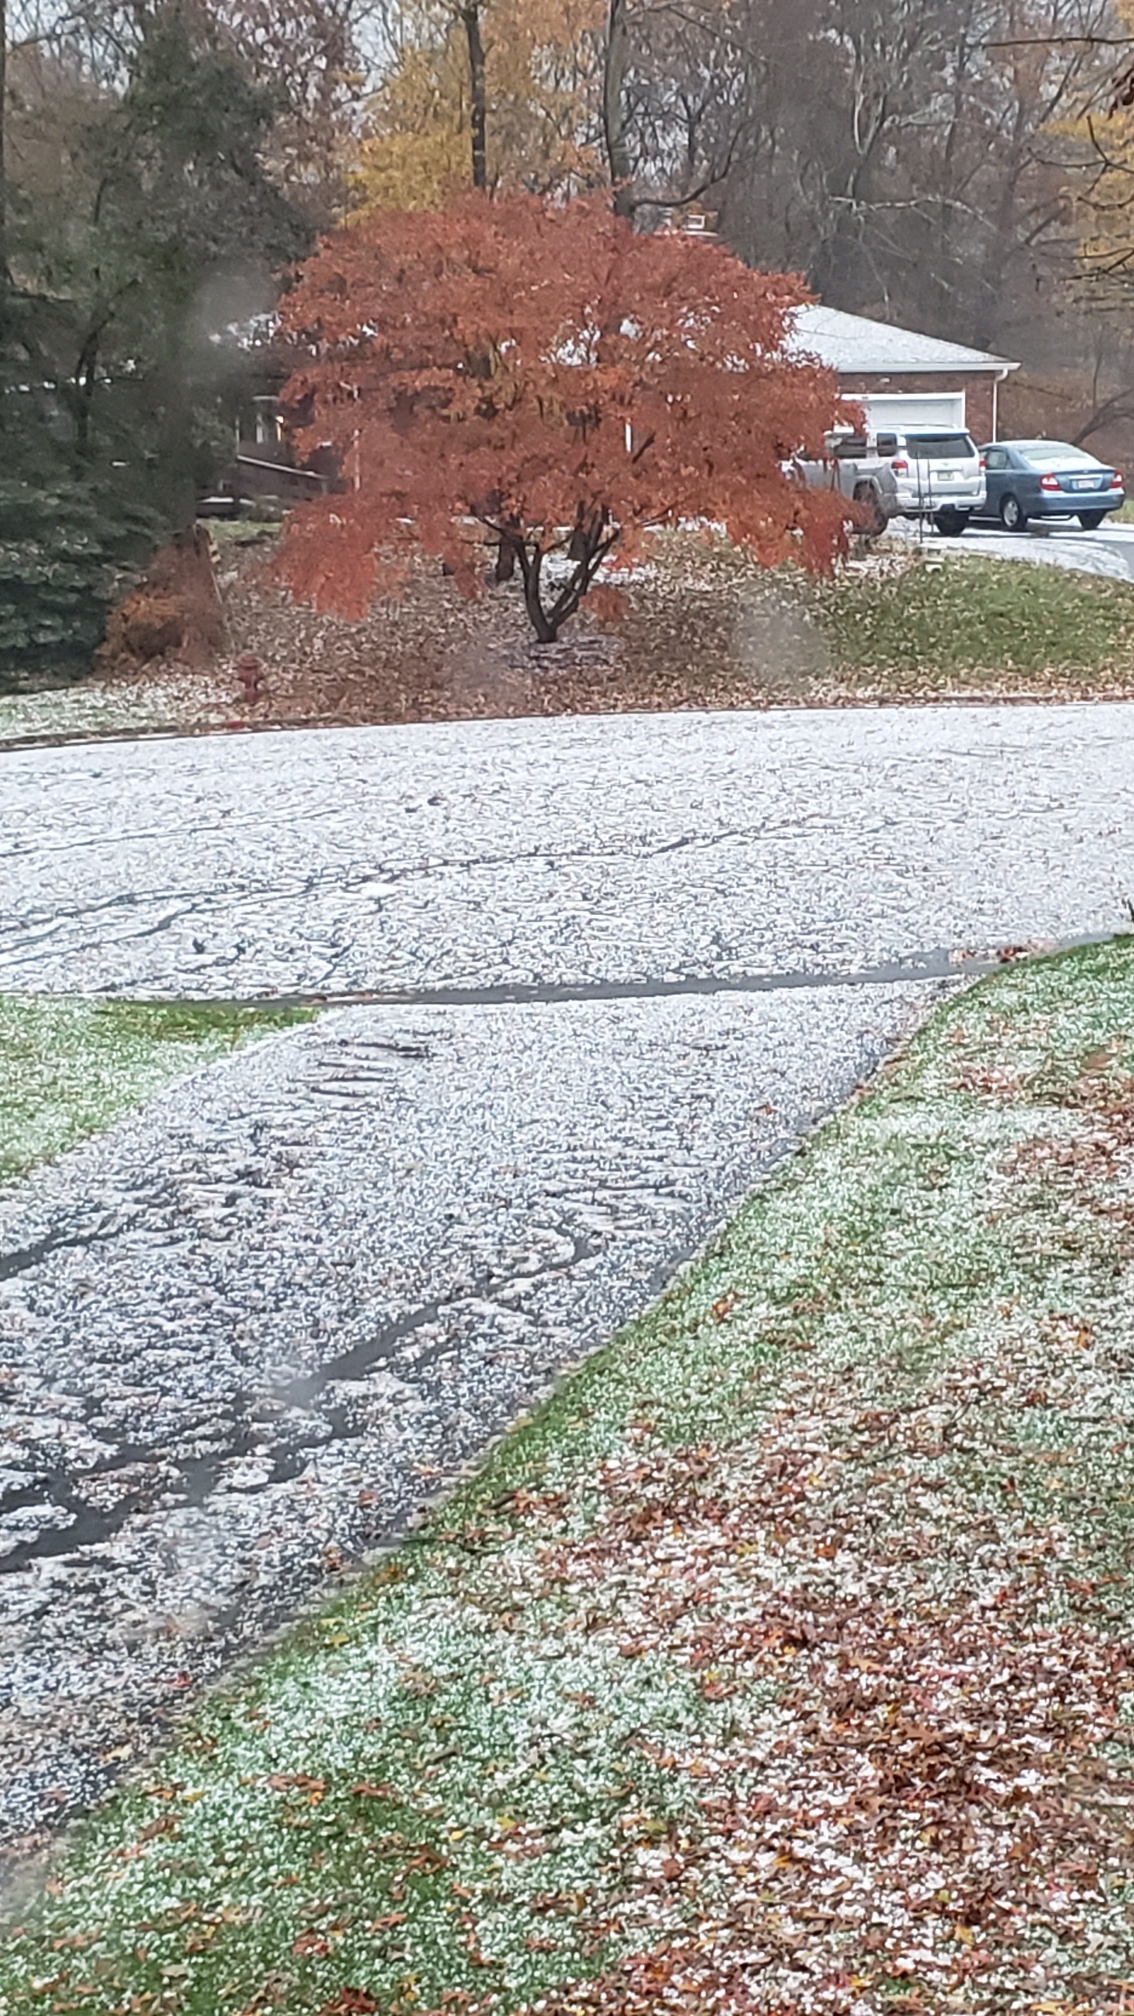
Figure 8. Hail covering the ground in Jefferson Township on November 13th (courtesy of R. Ramsey).
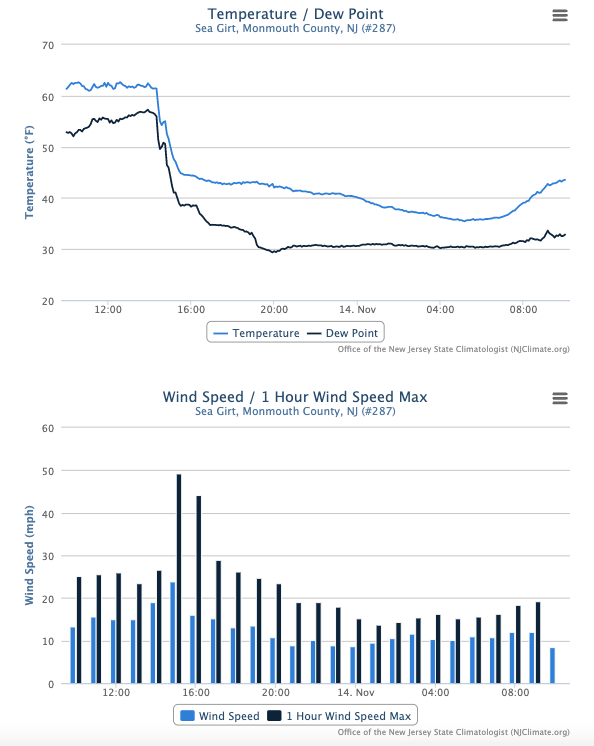
Figure 9. Meteogram of temperature and dew point (top) and wind speed and wind gusts (bottom) at the Sea Girt NJWxNet station from 10:00 AM on November 13th to 10:00 AM on November 14th.
A few tenths of an inch of snow fell at the highest northwestern elevations early on the 15th, the first measurable amounts of the season (see photo that leads this report). Rain returned late on the 18th into the 19th, bringing as much as 0.49” and 0.40” to two Vernon Township locations. Showers moved into the northwest late on the 25th but fell most heavily in the south early on the 26th where Linwood (Atlantic) picked up 0.60” and Maurice River Township (Cumberland) 0.48”. Only the southeast saw more than 0.30”.
Light snow fell across north and central locations from late on the 27th into the morning of the 28th. Mount Olive Township received 0.6”, Mine Hill Township 0.5”, and 0.1”–0.4” was measured at 33 CoCoRaHS locations. Mount Olive Township and High Point each caught another 0.5” on the 30th.
The state was under high pressure for a good portion of the month. Barometric pressure readings ranged from 30.30”–30.45” from the 3rd–6th, from 30.45”–30.55” on the 19th, and 30.55”–30.60” on the 20th. The 13th saw the lowest pressure at 29.55”–29.65”. In addition to the strong winds on the 13th, there were six other days when NJWxNet stations gusted over 40 mph. These include a 43 mph gust at Harvey Cedars on the 12th, 49 mph at HPM, Harvey Cedars 43 mph, and Sea Girt 40 mph on the 18th, HPM 41 mph on the 19th, HPM 48 mph on the 23rd, HPM 53 mph and 13 stations 40 mph–45 mph on the 26th, and HPM 52 mph and Fortescue 40 mph on the 27th.
Fall 2021 OverviewWhile the cool and dry November was a rather uncommon pairing, climatological conditions averaged for all of fall 2021 proved to be quite common for recent years. The statewide average temperature of 57.3° was 1.5° above the 1991–2010 normal and ranked as the 9th mildest fall on record. Eight of the top ten mild falls since 1895 have occurred since 2005, with five of the most recent seven falls in that mix. This year’s ranking came about due to the second mildest October and 9th mildest September, far outweighing the 76th coolest November.
| Rank | Year | Fall Avg. Temp. |
| 1 | 1931 | 58.5° |
| 2 | 2015 | 58.3° |
| 3 | 2005 | 58.0° |
| 4 | 2007 | 57.9° |
| 4 | 2011 | 57.9° |
| 6 | 2016 | 57.7° |
| 6 | 2017 | 57.7° |
| 8 | 2020 | 57.6° |
| 9 | 2021 | 57.3° |
| 10 | 1961 | 57.2° |
It was a highly variable fall for precipitation (Figure 10). While most often on the dry side across the state and dry throughout fall in the far south, there were two exceptional precipitation events that ultimately resulted in a wet fall. The 12.42” statewide average was 0.71” above normal and ranked as the 36th wettest fall of the past 127. There was an almost four-fold difference in fall precipitation from wettest to driest locations. Warren Township (Somerset) came out on top with 21.88” and Lower Township (Cape May) was driest at 6.07”. Other wet locations included Oxford Township (Warren) with 21.34”, Vernon Township (Sussex) 21.19”, Rockaway Township (Morris) 20.51”, North Arlington (Bergen) 20.41”, and Hackettstown (Warren) 20.26”. Other drier spots were the Cape May County communities of Wildwood Crest at 6.25”, Middle Township 7.02”, Woodbine 7.84”, and Ocean City 7.58, with Hamilton (Atlantic) catching just 7.49”.
The two heavy rainfall events alluded to above were the result of post-tropical storm Ida pummeling all but the southeast on the evening of September 1st into early the 2nd and an early-season nor’easter dumping heavy rain from late October 25th to early on the 27th. For instance, without these two events, the Warren Township fall total would have plummeted to 7.45”. Every day certainly does count in the precipitation department. Written about extensively in the September and October summaries, along with a special report on Ida, these were impactful events. Ida will long be remembered for the remarkable rainfall rates and resultant flash flooding that resulted in 30 drowning deaths in central and northeastern locations. Also, for the strongest NJ tornado since 1990, a category 3 twister in Gloucester County that leveled houses but fortunately resulted in no fatalities.
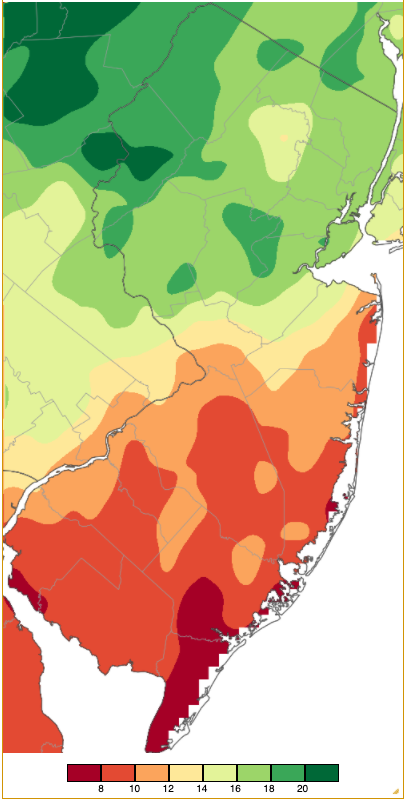
Figure 10. Fall 2021 precipitation across New Jersey based on a PRISM (Oregon State University) analysis generated using NWS Cooperative and CoCoRaHS observations from 7 AM on August 31st to 7 AM on November 30th. Note the scale in quarters of an inch at the bottom of the map. Totals range from 6.00”–8.00” (dark red) to 20.00”–22.00” (dark green).
For those seeking more detailed information on 5-minute, hourly, daily, and monthly conditions, please visit the following Office of the NJ State Climatologist's websites:
Rutgers NJ Weather Network
NJ Community Collaborative Rain, Hail and Snow Network
NJ Snow Event Reports
Interested in receiving our monthly summaries at the end of each month? Send us your e-mail address here to join the mailing list.
Past News Stories

