Mother Nature Picking on Two NJ Communities!: July 2019 Recap
New Jersey State Climatologist
Center for Environmental Prediction, School of Environmental and Biological Sciences/NJAES, Rutgers University
August 4, 2019
Overview
With 565 incorporated communities in New Jersey, one would think that the odds of multiple significant weather events specific to any one of them within a month would be exceedingly rare. Yet July 2019 brought such a duel scenario to not one but two NJ townships. Mt. Laurel (Burlington County) was visited by two tornados, while one rain gauge in Stafford Township (Ocean) caught 5.00” in two separate 24 hour periods. More specifics are provided later in this report. The good news is that, despite damage occurring in each of the four events, there were no fatalities nor reported injuries.
The month as a whole was a wet one, averaging 6.15” across the state. This is 1.58” above the 1981–2010 mean and ranks as the 20th wettest since 1895. Northern counties were wettest, averaging 7.20” or some 2.45” above normal and ranking 16th wettest. The south averaged 5.61”, which is 1.12” above normal and ranks 29th wettest.
Ten of the past 12 months and 15 of the past 18 months have received above-average precipitation across the state. While the 12 months ending in January this year ranks as wettest (66.61”) of 1484 such intervals dating back to 1895, the past 12 month period ending in July comes in second place with 65.74”, just ahead of the 12 months ending in June (65.50”).
The average statewide July temperature was 77.9°. This is 3.3° above the 1981–2010 mean and ranks as the 5th warmest since 1895. Eleven of the 20 warmest Julys have occurred since 2002 (Table 1). Southern NJ averaged 78.9° which is 3.2° above normal and ranks 6th warmest. The north averaged 76.4°, some 3.6° above normal and 4th warmest (tied with 2013). The excessive humidity throughout most of the month led to nighttime temperatures ranked as the 2nd warmest on record statewide (67.4°; tied with 2011), as a moist atmosphere inhibits the loss of the previous day’s heat during the overnight period.
| Rank | Year | July Avg. Temp. |
|---|---|---|
| 1 | 2011 | 78.4° |
| 1 | 1999 | 78.4° |
| 1 | 1955 | 78.4° |
| 4 | 2010 | 78.3° |
| 5 | 2019 | 77.9° |
| 6 | 2013 | 77.8° |
| 6 | 2012 | 77.8° |
| 8 | 2016 | 77.2° |
| 9 | 1949 | 77.0° |
| 10 | 1994 | 76.8° |
| 11 | 2006 | 76.7° |
| 12 | 1988 | 76.5° |
| 12 | 1901 | 76.5° |
| 14 | 1993 | 76.3° |
| 14 | 1952 | 76.3° |
| 16 | 2018 | 76.1° |
| 16 | 2002 | 76.1° |
| 16 | 1995 | 76.1° |
| 19 | 2008 | 76.0° |
| 19 | 2005 | 76.0° |
Table 1. The 20 warmest Julys across New Jersey since 1895.
On the 26th, the Rutgers NJ Weather Network (NJWxNet) welcomed a new station in East Brunswick (Middlesex). Gratitude is expressed to the Middlesex County Utilities Authority for hosting this state-of-the-art facility.
Temperature
Daily maximum temperatures reached 90° or higher on 23 July afternoons at one or more of the 65 NJWxNet locations. On 14 of these days at least 20 stations topped 90°, while some stations exceeded 95° on 7 of these days, and the century mark was reached at an NJWxNet or National Weather Service Cooperative station on 2 days. The 2nd kicked things off with West Creek (Ocean) rising to 93° and 34 stations packed closely behind at 90°–91°. A partly sunny and humid 4th saw Hawthorne (Passaic) make it to 94° and Columbus (Burlington) and Mansfield (Burlington) each hit 93°. Cream Ridge (Monmouth) and Haworth (Bergen) reached 92° on the 6th. It wasn’t until the 14th that the 20 station mark was again achieved, with eight stations at 92° and 34 from 90°–91°. Six sites were 93° on the 16th, with 40 from 90°–92°. Oswego Lake (Burlington) got to 98° on the 17th, followed by Berkeley Township (Ocean), Sicklerville (Camden), and Toms River (Ocean) at 97°, and 53 other sites between 90°–96°. Harvey Cedars (Ocean) and Charlotteburg (Passaic) were coolest at 84°. Cape May Court House (Cape May), Pennsauken (Camden), and Hamilton (Mercer) reached 95° on the 19th, with 53 stations from 90°–94°.
A Cooperative station in Harrison (Hudson) shot up to 100° on the 20th, along with Point Pleasant (Ocean) and Hawthorne, with the NWS station at Atlantic City Airport in Pomona (Atlantic) close behind at 99°. Some 46 other NJWxNet stations topped out from 95°–98°, with only High Point Monument (HPM; Sussex) at 88° not making it to 91° or higher. As might be expected, morning lows on the 20th were as high as 83° at Fortescue (Cumberland), with three stations at 68° the only ones below 70°. The 21st was the hottest day of what for some locations was a seven-day (16th–22nd) heatwave of 90° plus afternoons. NJWxNet stations at Point Pleasant, Sea Girt (Monmouth), and Seaside Heights (Ocean) soared to 101°, as did Harrison. Atlantic City Airport/Pomona reached 100°, with eleven NJWxNet sites at 99° and 43 from 95°–98°. Again, HPM at 87° was the only location below 91°. It is highly unusual to have such torrid maximum temperatures led by coastal stations (more common for urban Harrison). Aside from a two-hour window in the mid-afternoon at Harvey Cedars, west to northwesterly winds kept the sea breeze from encroaching on coastal locations. But why these three coastal stations were hottest remains something of a mystery. Perhaps it was their morning minimums of 80°–82° serving as a warm “launching pad”, though other stations were equally warm. Three locations did not drop below 82°, with 12 others with lows from 80°–81°. Sandyston (Sussex) and Walpack (Sussex) reached 67° and 68°, respectively, with all other stations 70° or warmer for daily minimums. The heatwave ended on the 22nd, with Woodbine (Cape May) up to 97°, nine locations from 95°–96°, and 35 at 90°–94°.
The heat began to ratchet up again in the closing days of July. The 28th found Upper Deerfield (Cumberland) up to 94°, Point Pleasant, Hamilton (Mercer), and Vineland (Cumberland) each 93°, and 41 other NJWxNet stations from 90°–92°. The thermometer reached 90° at 48 locations on the 29th, topped by Upper Deerfield’s 96° and 95° at Cherry Hill (Camden), Pennsauken, and Vineland. It heated up a bit more on the 30th, with Hawthorne at 97°, Cherry Hill, and Upper Deerfield both 96°, and 52 stations from 90°–95°. The 31st found Vineland and Upper Deerfield peaking at 93°, with 21 stations from 90°–92°.
Dates when the 90° mark was topped at fewer than 20 NJWxNet stations include the 3rd, 5th, 9th–12th, 18th, 26th, and 27th.
On the cool side of the ledger, there were seven days when the temperature fell to 55° or lower at one or more NJWxNet station. The 1st had the chilliest lows, with Walpack at 47°, Pequest 51°, Sandyston 52°, HPM 53°, and Vineland 54°. Before the heat rolled in on the 2nd, Walpack fell to 51°, Sandyston 52°, and Pequest 54°. Some cool air moved in come mid-month, with Sandyston at 55° on the 13th, Walpack 50°, Sandyston 53°, and both Pequest and Basking Ridge (Somerset) 55° on the 15th, with Walpack 53° and Sandyston 54° on the 16th. Late in the month, Sandyston dropped to 54° on the 25th and 53° on the 26th, with Pequest and Walpack each 54°.
Precipitation
As is common in a summer month where the majority of New Jersey’s rainfall stems from convective activity (thunderstorms and localized downpours), there can be a wide range of monthly totals across the state. Even in a wet month such as this one, some locations see rain dodge precipitation gauges while other sites require gauges to be emptied time and time again. One Community Collaborative Rain, Hail and Snow Network (CoCoRaHS) gauge at a Stafford Township location caught 13.29” in July, while only 1.44” was collected at a site further down the coast in Wildwood Crest (Cape May). Other wet locations included 10.54” at the Pequest NJWxNet station, another Stafford Township station with 10.22”, two Blairstown (Warren) locations with 10.13” and 9.32”, Stockton (Hunterdon) 9.73”, Oakland (Bergen) 9.70”, Oxford Township (Warren) 9.55”, and Edison (Middlesex) 8.92”. Others on the dry side included four Middle Township (Cape May) stations reporting 1.58”, 1.66”, 1.68”, and 2.64”, another Wildwood Crest location at 2.13”, West Cape May (Cape May) 2.14”, Sea Isle City (Cape May) 2.29”, Lower Township (Cape May) 2.51”, and Point Pleasant Beach (Ocean) 2.73”.
There were eleven events during July that deposited at least an inch of rain at one or more CoCoRaHS or NJWxNet station. Five of these brought more than 3.50” to at least one location. The first inch plus rain event came on the evening of the 2nd into the early hours of the 3rd. The heaviest rain fell in and near Hunterdon, Atlantic, Ocean, and Salem counties. Brigantine (Atlantic) received 1.50”, Toms River 1.43”, and Lacey Township (Ocean) 1.30”. Some of the storms brought wind gusts exceeding 40 mph to Logan (Gloucester) 50 mph, Lower Alloways Creek Township (LACT; Salem) 48 mph, Oceanport (Monmouth) 47 mph, Vineland 43 mph, and Pennsauken 40 mph. Scattered afternoon showers on the 5th brought 1.33” to Winslow Township (Camden) and 1.32” to Pitman (Gloucester). Little or no rain fell outside of southwest and west central areas.
The 6th brought the first of two July deluges to Stafford Township and the first of two tornadoes to strike Mt. Laurel. Scattered storms from late morning into the evening were the culprits. Three Stafford Township CoCoRaHS stations received 5.70”, 4.06”, and 3.25”, and Linwood (Atlantic) 2.19”. In the northwest, Stockton caught 2.26” and Blairstown received 2.16”. The map below (Figure 1) shows these three locations well, along with the widely-varying totals around the state. Of the 224 CoCoRaHS reports, 35 came in between 1.00”–1.94” and 55 from 0.50”–0.99”.
Winds during the storms of the 6th were highlighted by a small, short-lived but intense tornado in Mt. Laurel. Rated an EF0, the NWS estimated peak winds of 70 mph, and just a 5 yard wide size and a 0.07 mile long track. Yet video shows that winds were briefly strong enough to flip a small car and damage the roof of a business. Other 40 mph plus gusts in straight-line winds included 48 mph at Logan, Fortescue 42 mph, Pennsauken 41 mph, and LACT 40 mph.
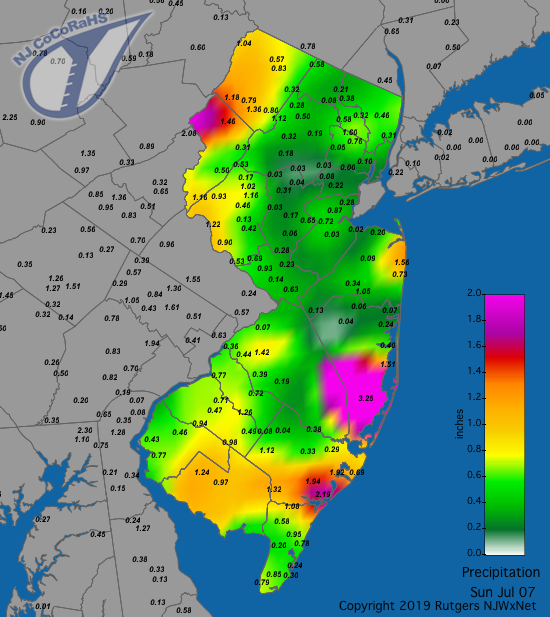
Figure 1. Rainfall totals from the morning of July 6th to the morning of the 7th. Observations are comprised of reports from CoCoRaHS stations.
Scattered showers statewide on the morning of the 8th brought as much as 1.14” and 1.01” to two stations in Stockton. Some 43 locations received from 0.50”–0.99”.
The 9th and 10th brought partly cloudy skies with gradually increasing, but not oppressive, humidity. What made these days notable was the milkiness to the “clear” skies, the result of distant wildfires in Alaska and western Canada.
Showers moved into the state during the afternoon of the 11th, becoming more widespread during the evening with thunderstorms galore. The far northwest in Sussex County and southern Cape May County received the least rain, with moderate to heavy totals most elsewhere (Figure 2). Top amounts included 3.91” and 3.62” at two Galloway Township (Atlantic) locations, 3.50” and 3.46” at two sites in Oakland, Hopewell Township (Mercer) 3.32”, Egg Harbor Township (Atlantic) 3.25, Port Republic (Atlantic) 3.19” and 3.00”, Ramsey (Bergen) 3.11”, and Stockton 3.03”. Of the 245 CoCoRaHS reports, 46 stations caught 2.00”–2.99” and 131 from 1.00”–1.99”. Montague (Sussex) saw the least with 0.11”, Vernon (Sussex) 0.28”, and Wildwood Crest 0.22”. All other stations received at least 0.44”.
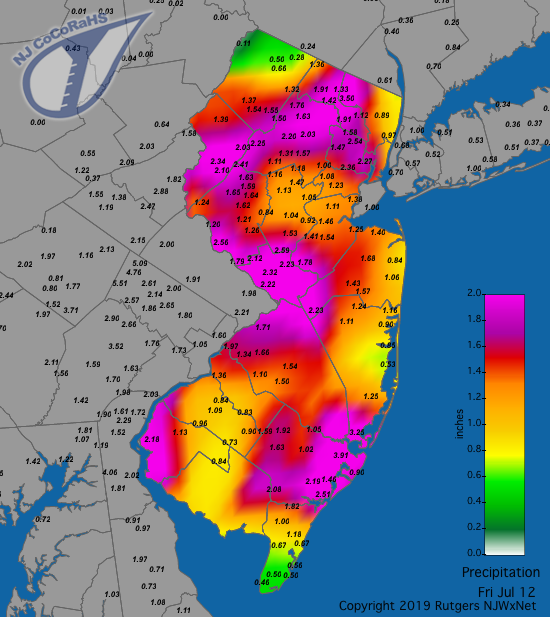
Figure 2. Rainfall totals from the morning of July 11th to the morning of the 12th. Observations are comprised of reports from CoCoRaHS stations.
While no NJWxNet station gusted over 40 mph in these storms, there was another tornado observed in Mt. Laurel. This one was more formidable than the one on the 6th, and was rated an EF1 with winds estimated to be 90 mph. It occurred close to 7:20 PM and had a discontinuous path of 1.3 miles. Numerous trees were downed, some onto houses.
Windy evening storms on the 17th drenched parts of northern NJ while dropping modest amounts of rain in the southwest and little in most coastal areas (Figure 3). New Providence (Union) caught the most rain with 3.89”, followed by nearby Chatham (Morris) 3.39”, Bernards Township (Somerset) 3.04”, Long Hill Township (Morris) 2.87”, Lebanon (Hunterdon) 2.83” and 2.65”, and Far Hills (Somerset) 2.74”. Thirteen other locations saw 2.08”–2.58” and 67 gauges caught 1.00”–1.87”. A downburst occurred in Ewing Township (Mercer) at 8:15 PM. It took down trees and damaged houses, though no injuries were reported. Wind gusts at NJWxNet stations included 57 mph at LACT, 53 mph in Berkeley Township, 51 mph at Fortescue, and ten stations gusting from 40–48 mph.
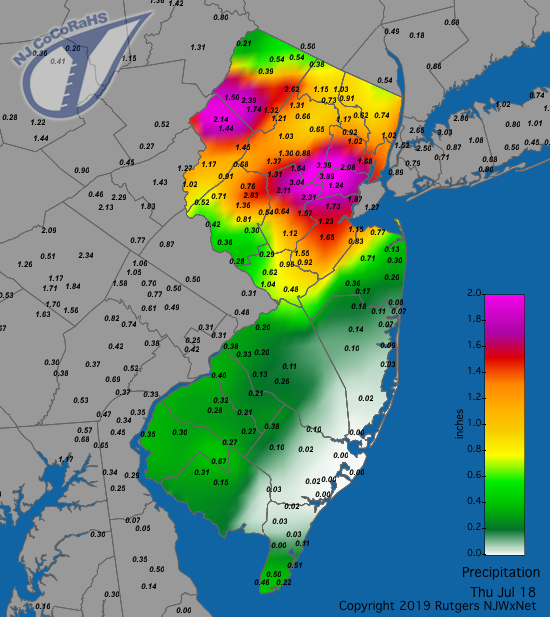
Figure 3. Rainfall totals from the morning of July 17th to the morning of the 18th. Observations are comprised of reports from CoCoRaHS stations.
Thunderstorms returned during the late afternoon and evening of the 18th. These storms were associated with the extratropical remains of Hurricane Barry that made landfall in Louisiana on the 13th. The heaviest rain was quite scattered, however, it included yet another deluge for Stafford Township. The same station that received 5.70” on the 6th caught 5.50” this time. The other two stations in town saw 3.27” and 3.05”. A 5.00” plus total in several hours’ time in this location has an estimated return period ranging from 500 years over two hours to 50 years over six hours. To have two such events in less than two weeks seemingly defies any reasonable probabilities! It is important to note that due to there being more precipitation gauges than ever throughout New Jersey (several hundred NJWxNet and CoCoRaHS, along with legacy NWS), the odds of observing impressive and unusual precipitation events have increased over the last 10–20 years. Previously, there were only several dozen NWS gauges deployed. Despite this, it is more than fair to couch this as a very unusual dual dousing. Other heavy reports for this event include 2.02”–2.64” at nine stations, 25 sites catching 1.00”–1.89”, and 44 from 0.50”–0.97” (Figure 4).
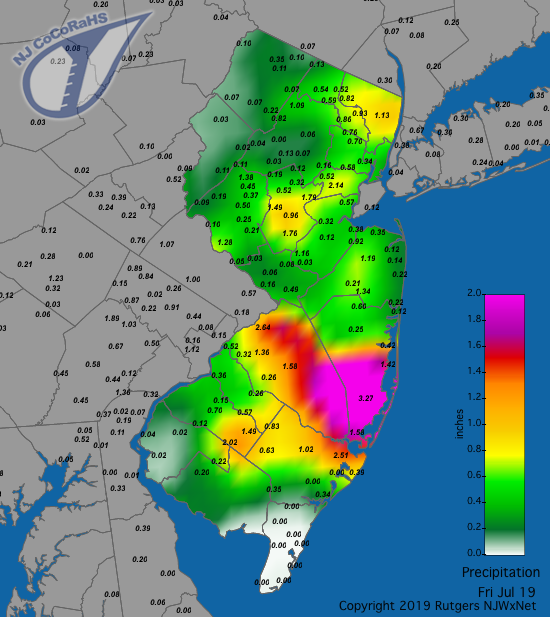
Figure 4. Rainfall totals from the morning of July 18th to the morning of the 19th. Observations are comprised of reports from CoCoRaHS stations.
Far northwestern Sussex County saw a late-afternoon storm on the 20th deposit 1.29” in Branchville, 0.97” at Sandyston, 0.83” in Montague, and 0.72” at High Point. Two rounds of scattered storms on the evening of the 21st brought modest rain, strong winds, and localized hail to central NJ. Rainfall came close but did not top an inch at a few locations, including 0.97” and 0.91” at two Franklin Township (Somerset) sites. The former location also received four minutes of dime-size hail that caused no damage. Such was not the case with strong winds in downtown New Brunswick (Middlesex) that toppled a construction crane across a well-traveled road and severely damaging two homes, yet miraculously injured no one. An isolated storm in Salem County brought a gust of 51 mph to LACT.
During the afternoon and evening of the 22nd and into the pre-dawn hours of the 23rd, a series of powerful storms helped “break” the heatwave. They brought copious rain and some of the strongest widespread wind gusts since Sandy in 2012 to a good portion of NJ. Of the 236 CoCoRaHS reports, 20 were between 3.00”–4.15”, 50 from 2.00”–2.97”, and 79 from 1.00”–1.96” (Figure 5). Cumberland County saw very little rain. Topping the list was Wantage (Sussex) with 4.15”, followed by Edison 4.01”, Blairstown 3.71” and 3.42”, Oxford Township 3.66”, Woodbridge (Middlesex) 3.56”, Westfield (Union) 3.52”, and Hawthorne and Sandyston each with 3.48”. Large hail also pummeled locations in Morris, Passaic, and Bergen counties, with multiple reports of quarter to golf-ball size hail stones.
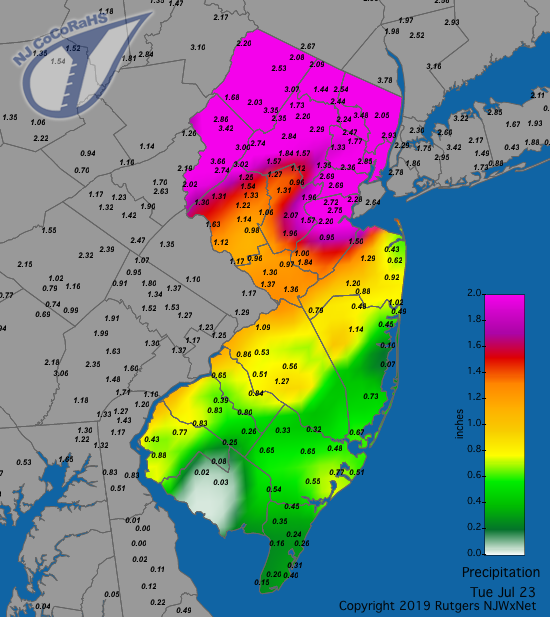
Figure 5. Rainfall totals from the morning of July 22nd to the morning of the 23rd. Observations are comprised of reports from CoCoRaHS stations.
Winds gusted between 51–59 mph at eleven NJWxNet locations, including Columbus and Pennsauken each at 59 mph, Moorestown (Burlington) 57 mph, Sea Girt 55 mph, Berkeley Township and Cream Ridge each 54 mph, LACT 53 mph, Point Pleasant 52 mph, and Logan Township, South Harrison (Gloucester), and Harvey Cedars each 51 mph. Nine other NJWxNet stations gusted between 40–49 mph. There were unconfirmed reports of gusts into the low 70 mph range at some locations, none of which can be dismissed as exaggerations, as the damage from these winds was widespread, particularly in Burlington, Ocean and, especially, Monmouth counties. At one point, electrical service was lost for over 300,000 customers (close to one million individuals). Many trees brought down the power lines in addition to damaging homes, in some cases severely. Once again, miraculously, no major injuries were reported.
Following some light morning showers, the rainfall intensity picked up during the afternoon and evening of the 23rd, on a much cooler day than experienced over the prior week. Franklin Township (Gloucester) picked up 1.46”, Medford Township (Burlington) 1.23”, Manchester Township (Ocean) 1.11”, and East Brunswick 1.02”. Winds gusted to 51 mph at LACT, 44 mph in Fortescue, and 41 mph at Bivalve (Cumberland).
Aside from a few local renegade showers on the 28th and 29th, the state was mostly rain-free until the afternoon of the 31st. Storms were scattered around central and northern areas, resulting in some local street flooding and power outages. Winds gusted to 41 mph at Lyndhurst (Bergen), with unofficial reports of gusts elsewhere topping 50 mph. Any time rain (or snow) falls after approximately 7AM on the last day of a month, a conundrum of sorts unfolds. Since most NWS Cooperative stations and CoCoRaHS sites report once daily around the breakfast hour, any precipitation falling after that time is credited to the next morning’s total. Thus, the state and divisional totals discussed earlier in this report and also the CoCoRaHS monthly totals do not include the afternoon rainfall on the 31st. Only the few NWS stations reporting at midnight (Newark [Essex] and Atlantic City airports) have this rainfall added to July totals. Otherwise observations will be included as part of August totals. Still, since the bulk of the rain on “August 1st” fell on July 31st, this event will be discussed here and just briefly mentioned in the August report. The heaviest rain fell in west central and northern coastal and northeastern areas. Top totals included 3.30” at Colts Neck (Monmouth), remarkably two Stafford Township locations with 2.63” and 2.41” (these totals were not part of the monthly values for these sites mentioned earlier in this section), Berkeley Township 2.40”, Port Republic 2.35”, and, as if to tie a bow around the theme of this month’s report, Mt. Laurel came in with 2.07”.
The lowest barometric pressure occurring during July was in the 29.65”–29.70” range on the 22nd. Highest pressure was approximately 30.25”–30.30” on the 26th. This is a narrow range in a month where neither a well-defined area of low pressure, nor a strong cooling high pressure system from the north invaded New Jersey.
For those seeking more detailed information on 5-minute, hourly, daily and monthly conditions, please visit the following Office of the NJ State Climatologist's websites:
Rutgers NJ Weather Network
NJ Community Collaborative Rain, Hail and Snow Network
NJ Snow Event Reports
Interested in receiving our monthly summaries at the end of each month? Send us your e-mail address here to join the mailing list.
Past News Stories

