Once Again Hot, and This Time Around, Dry: July 2022 Recap
New Jersey State Climatologist
Center for Environmental Prediction, School of Environmental and Biological Sciences/NJAES
Rutgers University
August 6, 2022
Overview
When it comes to recent hot Julys in New Jersey, the beat goes on. This year the heat was joined by quite limited precipitation, something not often seen in recent years. The statewide average temperature of 78.1° was 2.7° above the 1991–2020 normal, ranking 6th warmest since records commenced in 1895. Eight of the ten warmest Julys have occurred since 2010, leaving only 1955 and 1999 as top-ten outliers (Table 1). The statewide average maximum was 88.6° (+2.9°, 6th warmest) and the minimum 67.5° (+2.4°, 4th warmest). Northern counties averaged 75.9° (+2.2°, 9th warmest), southern counties 79.5° (+3.0°, 3rd warmest), and coastal areas 78.8° (+2.6°, tied as 4th warmest).
| Rank | Year | July Avg. Tmp. |
| 1 | 2020 | 78.8° |
| 2 | 2011 | 78.4° |
| 2 | 1999 | 78.4° |
| 2 | 1955 | 78.4° |
| 5 | 2010 | 78.3° |
| 6 | 2022 | 78.1° |
| 7 | 2019 | 78.0° |
| 8 | 2013 | 77.8° |
| 8 | 2012 | 77.8° |
| 10 | 2016 | 77.2° |
Table 1. The 10 warmest Julys across NJ since 1895.
Statewide July precipitation averaged 2.19”, which is 2.52” below normal, ranking as the 13th driest on record (Table 2). Of the top 15, only two have occurred this century. The north averaged 2.03” (-2.69”, 14th driest), south 2.30” (-2.44”, 14th driest), and coast 2.16” (-2.22”, 17th driest). The central portion of the state was driest, with less than 2.00” accumulating, and under an inch in the driest areas. Closer-to-normal totals were found in the northwest, northeast, and southwest. At month’s end, portions of central NJ were classified as being in moderate drought (D1) on the weekly U.S. Drought Monitor map. This denotes conditions not seen more than once every five to ten years. Surrounding central and northern areas were considered abnormally dry (D0), as was the southeast corner of the state. This all coincides quite well with the most pronounced precipitation deficits of the past month.
| Rank | Year | July Avg. Precip. |
| 1 | 1999 | 1.27” |
| 2 | 1944 | 1.36” |
| 3 | 1955 | 1.47” |
| 4 | 1957 | 1.52” |
| 5 | 1929 | 1.54” |
| 6 | 1910 | 1.60” |
| 7 | 2002 | 1.66” |
| 8 | 1954 | 1.69” |
| 9 | 1983 | 1.98” |
| 10 | 1998 | 2.04” |
| 10 | 1968 | 2.04” |
| 12 | 1966 | 2.12” |
| 13 | 2022 | 2.19” |
| 14 | 1909 | 2.20” |
| 15 | 1974 | 2.30” |
Table 2. The 15 driest Julys across NJ since 1895.
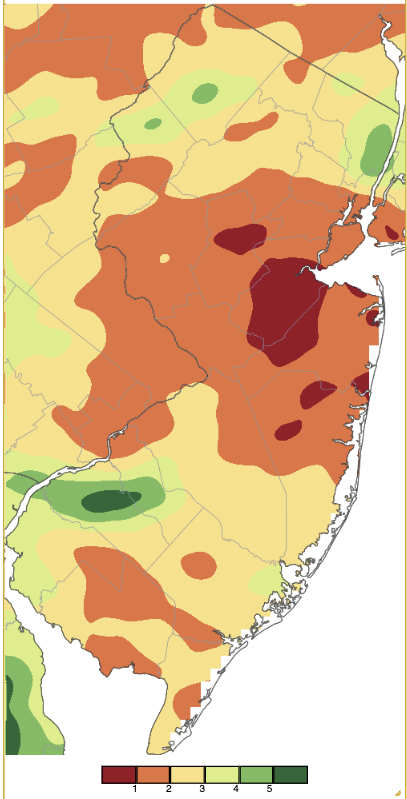
Figure 1. July 2022 precipitation across New Jersey based on a PRISM (Oregon State University) analysis generated using NWS Cooperative and CoCoRaHS observations from 7AM on June 30th to 7AM on July 31st. Note the scale in full inches at the bottom of the map. Totals range from 0.00–1.00” (dark red) to 5.00”–6.00” (dark green).
Temperature
On 24 July days one or more NJWxNet station reached a maximum of 90° or higher. This is just one day fewer than the record-hot July of 2020. Hillsborough-Duke (Somerset County) had 21 days of 90° maximums, one ahead of the Newark Airport station in Elizabeth (Union) and three above New Brunswick (Middlesex). The latter two stations have weather records extending back to 1931 and 1893 and this year experienced, respectively, their 2nd (tied with 1993; +4.4°) and 3rd (+3.1°) hottest Julys. It is no coincidence that these thermal anomalies were among the largest in NJ, given that these stations were among the driest locations. Newark Airport received just 0.55”, the least on record, while New Brunswick saw 0.79”, their second lowest July total. The resulting dry conditions meant that the ground and atmosphere heated up more readily than in wetter locations where there was more evaporation to assist in reducing temperatures. The airport recorded five days with highs of 100°–102°. Occurring consecutively (20th–24th), this marked the longest streak on record. Hillsborough-Duke missed this 100° run by a day, only making it to 99° on the 22nd.
All but one of the 66 Rutgers NJ Weather Network stations reached the 90° mark on at least one day, the exception being the High Point Monument (Sussex) station at the highest elevation in NJ, where the temperature topped out at 89° on three afternoons. The first of nine July days with a NJ maximum of at least 95° was the 1st when Hillsborough-Duke and Little Falls (Passaic) reached 95°, with 44 of the 66 WxNet sites from 90°–94°. Additional 90°–94° maximums were found on the 2nd, 3rd, 5th, 6th, 12th, 13th, 14th, 15th, 16th, and 17th before Hillsborough-Duke made it to 97° on the 18th. 94° was reached at nine locations on the 19th, before a six-day 95° or hotter streak began. Hillsborough-Duke notched a 100° high on the 20th, with 36 WxNet sites from 95°–98° and 24 from 90°–94°. Harvey Cedars (Ocean) on Long Beach Island was coolest at 86°. Hillsborough-Duke again hit 100° on the 21st, with 33 stations from 95°–99°, 26 from 90°–94°, and Atlantic City Marina (Atlantic) just to 82°. Berkeley Township (Ocean), Pennsauken (Camden), and Hillsborough-Duke reached 99° on the 22nd, with 56 other stations in the 90°s. Hillsborough-Duke rose to 101° on the 23rd, with the century mark reached at East Brunswick (Middlesex), Hamilton (Mercer), Pennsauken, and Piney Hollow (Gloucester). Forty stations topped out from 95°–99° and 16 from 90°–94°, with Seaside Heights (Ocean) up to just 86°.
The hottest day of the month was the 24th (Figure 2), with Berkeley Township and Hillsborough-Duke up to 102° (Newark Airport also made it to 102°) and seven other WxNet stations at 100°. Forty sites were from 95°–99°, 12 from 90°–94°, and of five locations in the upper 80°s. Harvey Cedars was coolest at 86°.
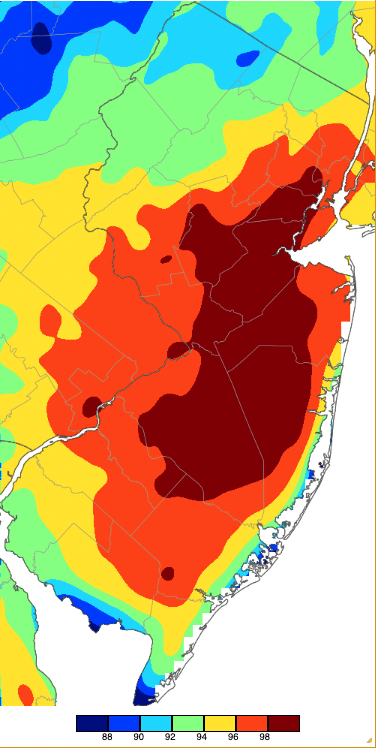
Figure 2. Maximum temperatures on July 24th based on a PRISM (Oregon State University) analysis generated using NWS, NJWxNet, and other professional weather stations. Note the in 2-degree increment scale beneath the map.
The 25th saw highs of 95° at Berkeley Township and Cape May Court House (Cape May), with Cape May Court House again reaching 95° on the 28th. Low 90°s were found at some locations on the 27th, 29th, 30th, and 31st.
Persistent southwesterly winds contributed to the hot air temperatures later in the month. Ironically, but not surprisingly, these winds also resulted in warm surface waters being pushed offshore, opening the door for cooler waters to upwell from depth. This dropped surf temperatures from the low 70°s into the mid to upper 50°s, particularly from Long Beach Island southward. Satellite-observed ocean temperatures show the cool conditions, though do not pick up the coolest temperatures in the surf zone (Figure 3). The northern coast is oriented more north-to-south compared to the northeast-to-southwest-oriented south coast. Thus, it did not experience as much upwelling and cooling than to the south. This situation also impacted average monthly air temperatures at the coast, as Atlantic City Marina averaged just 0.5° above normal for the month while the airport station inland in Pomona (Atlantic) was 1.9° above normal.
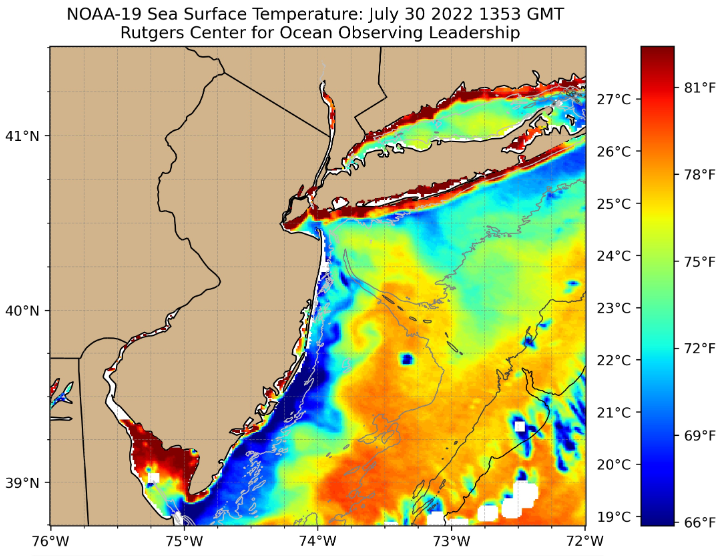
Figure 3. Sea Surface temperatures at 9:53 AM on July 30th based on data from the NOAA 19 satellite. Image courtesy of the Rutgers Center for Ocean Observing Leadership.
Minimum air temperatures were mainly in the 60°s and 70°s across the state during July. However, Fortescue (Cumberland), sitting on a dune next to warm Delaware Bay waters (Figure 3) only dropped to 80° on the 21st and 23rd. This location had lows in the 70°s on 24 other days. On the cool side, there were nine days where one or more WxNet station dipped to 55° or lower. The first of these was on the 1st, with Walpack (Sussex) and Sandyston (Sussex) at 53° and 54°, respectively. These two locations reached 52° on the 3rd, with Pequest (Warren) at 55°. The 4th was the coolest morning of the month, with Walpack down to a chilly 44°, Sandyston 46°, and 15 locations from 48°–55° (Figure 4). Meanwhile, Harvey Cedars, Seaside Heights, and Lower Alloways Creek Township (Salem) only fell to 68°.
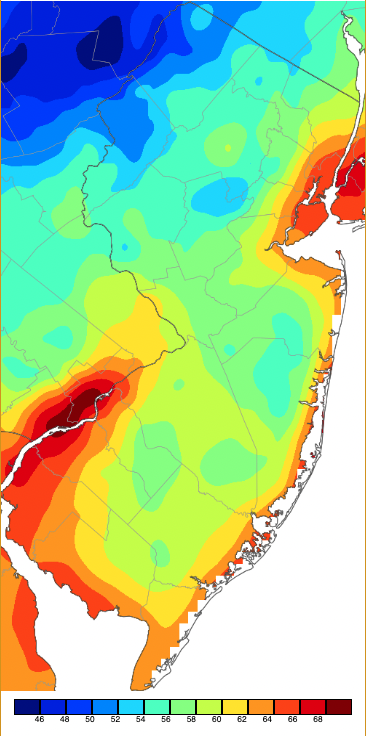
Figure 4. Minimum temperatures on July 4th based on a PRISM (Oregon State University) analysis generated using NWS, NJWxNet, and other professional weather stations. Note the 2-degree increment scale beneath the map.
The 10th found Walpack at 48° and Sandyston 49°. Berkeley Township in the Pinelands reached 49° on the 11th. Walpack was 51° and Sandyston 52° on the 15th, while it took until the 26th for Walpack to record the next 55° low in NJ. Sandyston bottomed out at 52°, with Pequest and Walpack each at 54° on the 27th. The 31st brought lows of 51° to Walpack, Sandyston 53°, and Pequest 54°.
Precipitation and Storms
As is often the case during the warm season, July precipitation totals varied quite a bit across NJ but overall, showers were less frequent and more localized than normal. The wettest stations were one to two inches above normal, including Mantua Township (Gloucester) with 7.31”, Newton (Sussex) 6.89”, Columbus (Burlington) 6.77”, Cherry Hill (Camden) 6.26”, Wood-Ridge (Bergen) 6.02”, Washington Township (Gloucester) 5.84”, and Tenafly (Bergen) 5.73”. On the low end, there was Warren Township (Somerset) with 0.46”, Newark Airport/Elizabeth 0.55”, Old Bridge (Middlesex) 0.55”, Franklin Township (Somerset) 0.63”, Green Brook (Somerset) 0.65”, Lakewood (Ocean) 0.68”, and Eatontown (Monmouth) 0.74”. Those regions with lower totals saw burn bans issued and water restrictions recommended. A wildfire in Wharton State Forest (Ocean; the scene of June’s major fire) scorched about 100 acres on July 12th.
There were 12 events during the month that deposited at least 0.50” on a CoCoRaHS or NJWxNet station. Not quite making this mark were scattered thunderstorms on the 1st that brought 0.49” to Montague (Sussex) and 0.40” at Hillsborough-Duke. The latter site experienced a rapid 20° temperature drop, a 42-mph wind gust, and a rapid, short-lived spike in pressure of about 0.05” (Figure 5).
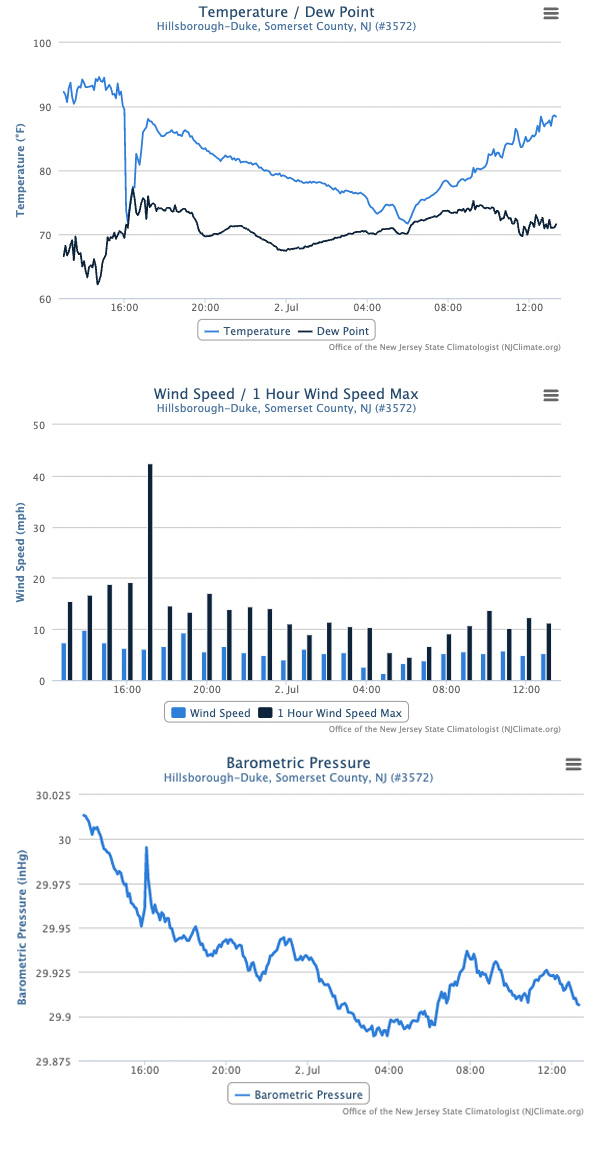
Figure 5. Time series of temperature, wind, and barometric pressure at the Hillsborough-Duke NJWxNet station from 1:20PM on July 1st to 1:20PM on July 2nd.
The afternoon of the 2nd into the 3rd saw light to locally moderate rain. Long Branch (Monmouth) caught 0.82”, Freehold (Monmouth) 0.57”, and Woodbine (Cape May) 0.50”. Ping-pong ball-sized hail fell in Eatontown. Winds gusted to 49 mph at Cream Ridge (Monmouth) and 47 mph at both High Point Monument and Oceanport (Monmouth).
It was a tale of two states on the 3rd as a front continued to slide southeastward through NJ. By late morning, northern NJ skies had cleared, temperatures had risen to near 80°, and dew point and relative humidity levels suggested comfortable moisture levels (Figure 6). Meanwhile, some light showers were falling under south Jersey clouds. Temperatures and dew points were in the low to middle 70°s, resulting in relative humidity values above 80%.
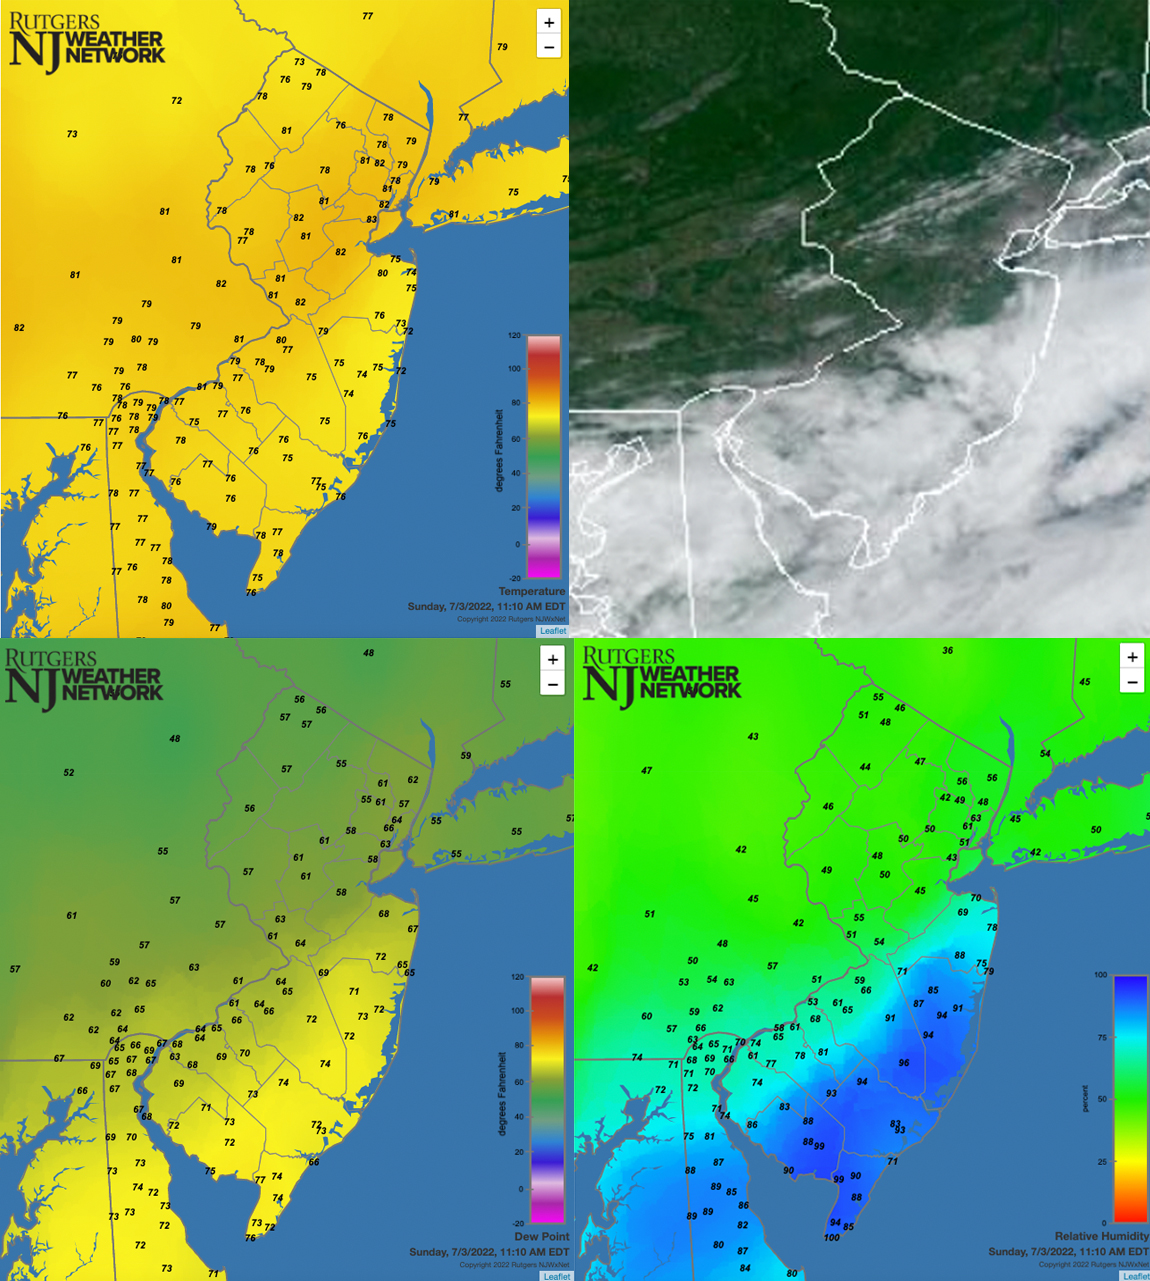
Figure 6. Conditions across the region at 11:20 AM on July 3rd. This includes temperatures (top left), cloud cover (top right), dew point (bottom left), and relative humidity (bottom right).
Three Lower Township (Cape May) stations picked up 0.75”, 0.74”, and 0.63” on the 5th, with little falling elsewhere. Early-morning rain on the 7th saw Galloway Township catch 2.02”, Washington Township (Gloucester) 1.88”, and Winslow Township (Camden) 1.79”. All told, 38 of the 248 CoCoRaHS reports came in over 1.00”, making for one of the more widespread events of the month, but still quite regional, as central and northern areas picked up little to no rain (Figure 7).
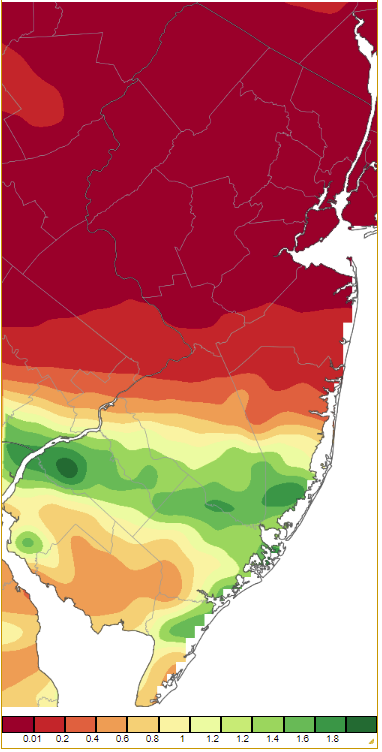
Figure 7. Precipitation across New Jersey from 7AM on July 6th through 7AM July 8th based on a PRISM (Oregon State University) analysis generated using generated using NWS Cooperative and CoCoRaHS observations. Note the scale in inches beneath the map.
Afternoon and evening showers on the 8th were concentrated in the I-195 corridor, dropping 1.08” at Pennington (Mercer) and Upper Freehold Township (Monmouth) 0.89”. Elsewhere, Frelinghuysen Township (Warren) picked up 0.85”.
Showers on the 12th brought locally strong winds to the southwest and northwest, and reports of pea to marble-size hail in Warren and Morris counties Rainfall amounted to 0.77” in Mount Arlington (Morris), 0.69” in Upper Deerfield (Cumberland), and 0.55” at both Rockaway Township (Morris) and Blairstown (Warren). Winds gusted to 55 mph at Mullica (Atlantic), Vineland (Cumberland) 54 mph, Greenwich (Salem) 51 mph, Upper Deerfield 49 mph, and Fortescue 40 mph. These gusts paled in comparison to the 82 mph gust at Lower Alloways Creek Township. Figure 8 depicts the temperature drop, wind gust, and pressure variations at the time of the peak gust and a while later when a second storm was nearby. The pressure rise associated with the major gust was about 0.10”, twice that of what was seen at Hillsborough-Duke in Figure 5, though the temperature decline was not as great. The second windy interval showed a brief pressure decline of about 0.05”. The scattered storms brought down trees and wires in Warren, Morris, and Cumberland counties.
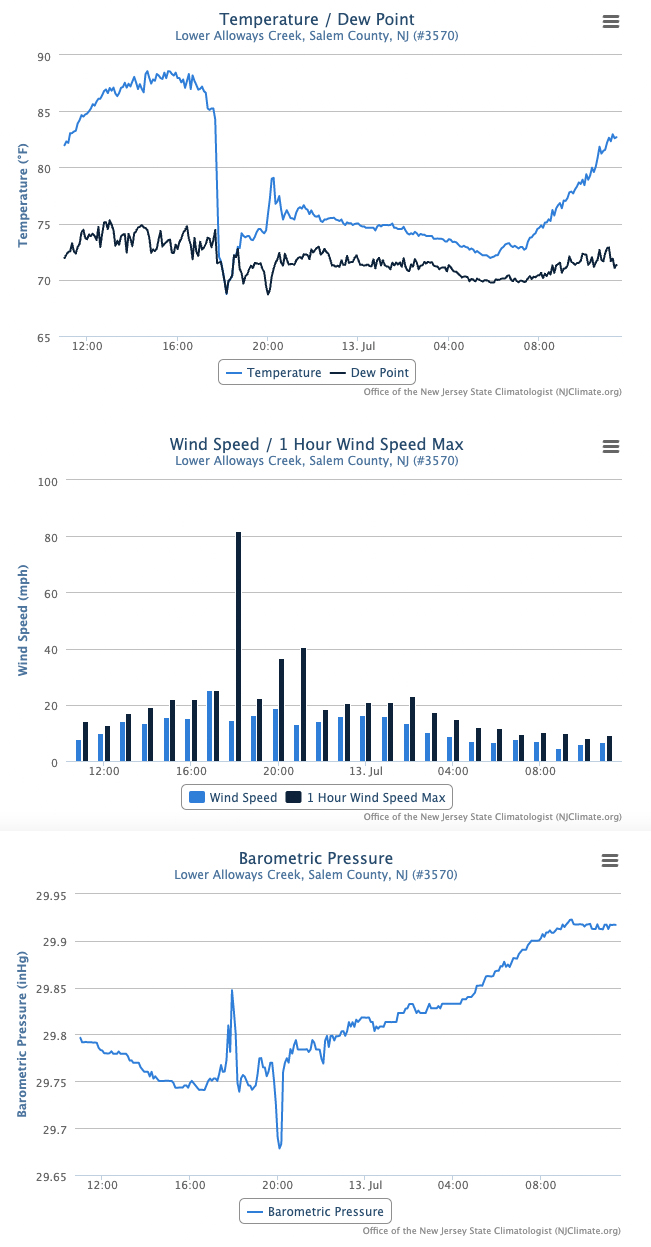
Figure 8. Time series of temperature, wind, and barometric pressure at Lower Alloways Creek Township NJWxNet station from 11:25AM on July 12th to 11:25AM on July 13th.
The monthly pattern of widely scattered and occasionally heavy showers continued on the 15th, with Burlington (Burlington) receiving 1.07” and Buena Vista (Atlantic) 0.50”. Colts Neck (Monmouth) had a local deluge of 2.38” on the 16th, with Wood-Ridge receiving 2.20” and Barnegat (Ocean) 1.28”. Quarter-size hail fell in Monmouth County where some trees came down. Showers in the northwest continued into the 17th, leaving Mount Olive (Morris) with 0.85” and two Lebanon (Hunterdon) stations with 0.64” and 0.74”.
Early-morning rain on the 18th brought Newton 3.02”, Sparta (Sussex) 2.23”, Fredon Township (Sussex) 1.91”, and Blairstown 1.20”. Waves of thunderstorms moved through northern areas during the day and into the evening of the 19th. Another 3.64” fell in Blairstown, while further east, Pompton Lakes (Passaic) received 3.15”, Bloomingdale (Passaic) 3.10”, Oakland (Bergen) 3.01”, Fair Lawn (Bergen) 4.25”, River Edge (Bergen) 4.24”, and Tenafly 4.25”. Of 264 CoCoRaHS reports, 14 exceeded 3.00”, 21 were from 2.00”–2.99”, and 24 from 1.00”–1.99” (Figure 9). Generally, less than 0.25” fell south of a line from the Warren-Hunterdon border to Hudson County.
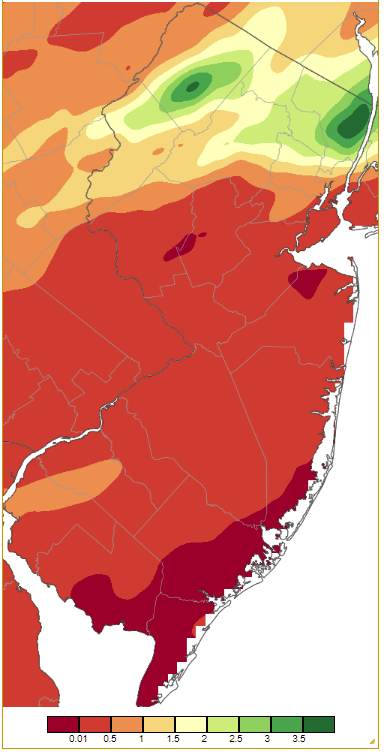
Figure 9. Precipitation across New Jersey from 7AM on July 17th through 7AM July 19th based on a PRISM (Oregon State University) analysis generated using generated using NWS Cooperative and CoCoRaHS observations. Note the scale in inches beneath the map.
The 22nd brought 1.12” to Palisades Park (Bergen) and 0.56” to both Wood-Ridge and Montclair (Essex). Pea-size hail fell in Wood-Ridge. The next day, 0.61” fell in Wantage (Sussex) and 0.58” in Vernon Township (Sussex). Heavier but still isolated showers fell on the 26th, hitting eastern Atlantic, southern Ocean, and Gloucester counties hardest. Hamilton (Atlantic) collected 3.33”, Galloway Township 2.82”, Mantua 2.55”, and Port Republic (Atlantic) 2.28”. Only ten CoCoRaHS stations received from 1.00”–1.99”. Heavy rain in west central NJ fell early on the 28th, with some also noted in coastal Monmouth County. Pennington received 1.35”, Greenwich Township (Warren) 1.04”, Hopewell (Mercer) and Flemington (Hunterdon) each 1.00”, and Bradley Beach (Monmouth) 0.98”.
In addition to the three days mentioned earlier where gusts above 40 mph were achieved, Vernon Township saw a 40 mph gust on the 24th and on the, 25th Harvey Cedars and Pennsauken each gusted to 48 mph and Logan Township (Gloucester) to 40 mph. The highest barometric pressures of the month of 30.20”–30.25” occurred on both the 4th and 31st. Lowest pressures in the 29.60”–29.70” range occurred on the 21st.
For those seeking more detailed information on 5-minute, hourly, daily, and monthly conditions, please visit the following Office of the NJ State Climatologist's websites:
Rutgers NJ Weather Network
NJ Community Collaborative Rain, Hail and Snow Network
NJ Snow Event Reports
Interested in receiving our monthly summaries at the end of each month? Send us your e-mail address here to join the mailing list.
Past News Stories

