Leaning Warm and a Bit Dry, and Once Again, Top-Ten Warmth: August and Summer 2019 Recaps
New Jersey State Climatologist
Center for Environmental Prediction, School of Environmental and Biological Sciences/NJAES, Rutgers University
September 5, 2019
August Overview
The summer of 2019 concluded on a warm and a bit dry note when averaged across the Garden State. The warmth was a common theme throughout June to August, while the earlier summer months were on the wet side. The average August temperature of 74.4° was 1.4° above the 1981–2010 mean and is tied with 1983 and 1973 as the 14th warmest since 1895 (Table 1). On 12 days, the temperature topped out at 90° or hotter at one or more Rutgers NJ Weather Network station, but never exceeded 96°. The heat was somewhat tempered by seven mornings with lows in the 40°s at some northwestern NJWxNet locations.
| Rank | Year | Aug. Avg. Temp. |
|---|---|---|
| 1 | 2016 | 76.9° |
| 2 | 2018 | 76.8° |
| 3 | 2005 | 76.4° |
| 4 | 2002 | 75.8° |
| 5 | 1980 | 75.6° |
| 6 | 2001 | 75.5° |
| 6 | 1955 | 75.5° |
| 8 | 1988 | 75.4° |
| 9 | 2003 | 75.1° |
| 10 | 1900 | 75.0° |
| 11 | 2010 | 74.9° |
| 11 | 2009 | 74.9° |
| 13 | 2012 | 74.7° |
| 14 | 2019 | 74.4° |
| 14 | 1983 | 74.4° |
| 14 | 1973 | 74.4° |
Table 1. The 16 warmest Augusts across New Jersey since 1895.
August precipitation averaged 3.75” across NJ. This was 0.35” below normal and ranks as the 52nd driest of the past 125 Augusts. As expected during a summer month that is dominated by hit and miss showers, rainfall totals varied quite a bit, even on a local scale. The driest location in the state was Lambertville in Hunterdon County where 1.48” fell, while the wettest was Lebanon, also in Hunterdon County, with 7.99”. When and where the storms struck, they were, at times, intense. This included small tornadoes and more widespread strong winds, dangerous lightning, and flash flooding.
Precipitation and Storms
In addition to the 7.99” in Lebanon, other wet spots in August included Mt. Laurel (Burlington County) with 7.53” and Clinton (Hunterdon), where two locations caught 7.45” and 6.64”. Also, Hainesport (Burlington) received 6.99”, White Township (Warren) 6.73”, Hillsborough (Somerset) 6.67” (although another gauge in the township caught just 2.64”), Bridgewater Township (Somerset) 6.59”, and two locations in Stafford Township (Ocean) with 6.51” and 5.76”. Joining Lambertville on the dry end was Toms River (Ocean) with 1.56” and two Hopewell Township (Mercer) stations receiving 1.59” and 1.52”. Also, Montague (Sussex) had 1.91”, Wantage (Sussex) and Point Pleasant Beach (Ocean) each received 1.94”, Lower Alloways Creek Township (Salem) 1.95”, Pennington (Mercer) 1.96”, Berkeley Township (Ocean) 1.97”, and Flemington (Hunterdon) 2.01”.
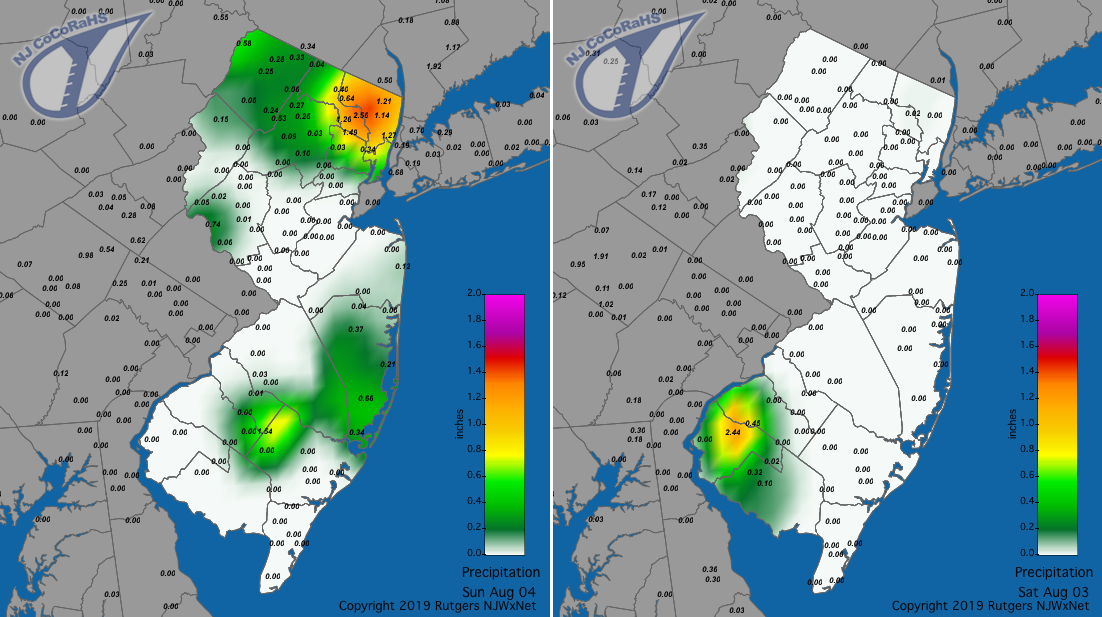
There were 14 August days where one or more of the several hundred precipitation gauges across NJ caught at least an inch (another day came close with a spot receiving 0.99”). Demonstrating how isolated summer showers can be, on the 2nd Woodstown (Salem) saw 2.44”, while no other location in the state received more than the 0.45” measured at South Harrison (Gloucester). The left map in Figure 1 demonstrates the local nature of this event. While showers during the afternoon and late evening of the 3rd were a bit more widespread, the map on the right in Figure 1 shows their hit and miss nature across the state. Two stations in Hawthorne (Passaic) caught 2.56” and 1.66”, with two sites in nearby Glen Rock (Bergen) with 1.94” and 1.82”, Winslow Township (Camden) 1.54”, Little Falls (Passaic) 1.49”, and Hammonton (Atlantic) 1.36”. Yet another isolated shower on the 5th dropped 1.43” on Vineland (Cumberland) with Mullica (Atlantic) next wettest at 0.43”. The latter location recorded a wind gust of 42 mph.

Figure 1. Rainfall from approximately 7AM on August 2 to 7AM on August 3 (left) and 7AM on August 3 to 7AM on August 4 (right). Observations are comprised of reports from CoCoRaHS stations.
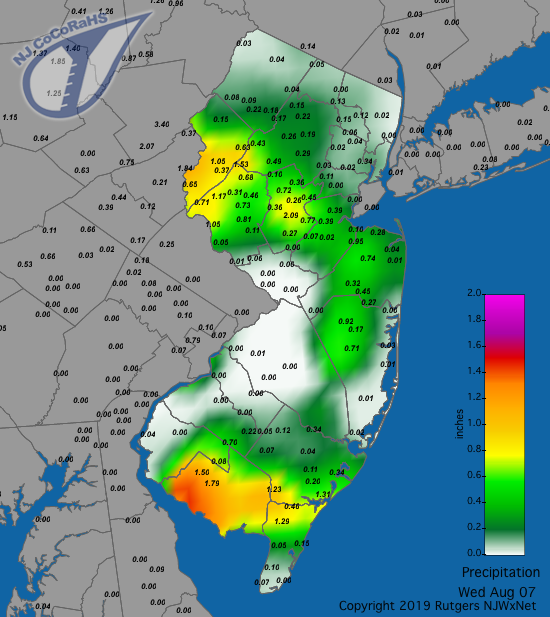
Rain coverage expanded on the 6th, as seen in Figure 2. Still, the rainfall was hardly statewide, with local downpours delivering 2.09” to Manville (Somerset), Hillsborough 2.04”, Washington Township (Morris) 1.80” and 1.53”, Fairfield Township (Cumberland) 1.79”, and Upper Deerfield (Cumberland) 1.50”. There were reports of trees and wires down, with associated power outages in Warren County.

Figure 2. Rainfall from approximately 7AM on August 6 to 7AM on August 7. Observations are comprised of reports from CoCoRaHS stations.
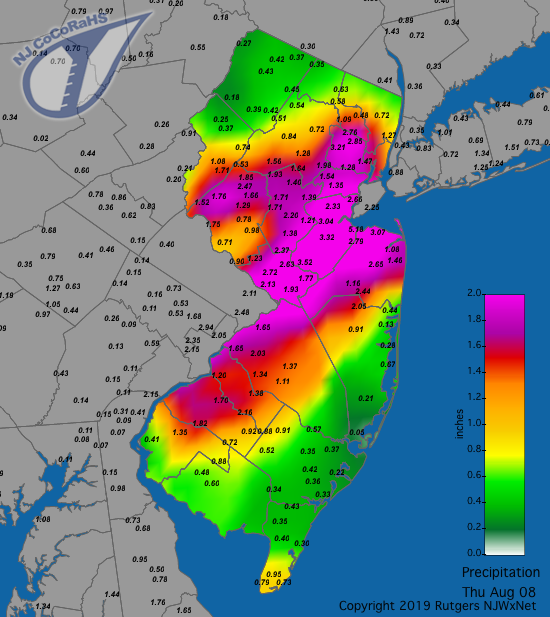
The most widespread rainfall of the month resulted from several rounds of afternoon and evening showers and thunderstorms on the 7th (Figure 3). Flash flooding brought rush hour commuting chaos to Middlesex County. In a few hours or less, Old Bridge was deluged with 5.18”, South River 4.17”, Woodbridge 3.95” and 3.42”, Sayreville 3.71”, Plainsboro 3.52”, and New Brunswick 3.77” and 3.49”. Nearby, Hillsborough stations caught 3.68” and 1.76”. Of the 231 CoCoRaHS reports, 14 came in at 3.00” or more, 35 from 2.00”–2.99”, and 81 from 1.00”–1.99”. Hail up to a half dollar in size was reported in Monmouth County, with smaller hail falling in Warren County. Reports of strong winds bringing down trees and wires came in from Bergen to Cape May counties. Winds gusted to 57 mph in both Lower Alloways Creek Township and Fortescue (Cumberland), 56 mph at Lyndhurst (Bergen), 44 mph at Cream Ridge (Monmouth), and 41 mph in Columbus (Burlington).
In the midst of this tumult, three small tornadoes touched down on the 7th. The first was a short-lived EF0 twister in Springfield (Union) just before 3:00 PM. Other than an estimated maximum wind speed of 70 mph, the National Weather Service did not provide further information. Close to 4:30 PM another EF0 tornado occurred in Hightstown (Mercer). The NWS reported maximum winds of 75 mph, and a 0.33 mile track that was 25 yards at its maximum width. There was major damage to a large greenhouse with one minor injury from flying glass. Finally, at 6:40 PM an EF0 twister touched down in Millville (Cumberland), damaging solar panels at the city sewer department. It was estimated to have winds up to 70 mph, a 0.1 mile track, and a maximum width of 10 yards.

Figure 3. Rainfall from approximately 7AM on August 7 to 7AM on August 8. Observations are comprised of reports from CoCoRaHS stations.
Evening storms zipped through the state on the 8th. They dropped a maximum of 0.99” in Mine Hill Township (Morris) with another station in town receiving 0.83”, Rockaway (Morris) 0.82”, and Fredon Township (Sussex) 0.75”. Strong winds brought down power lines and trees, including one that landed on a car, fortunately leaving the driver unhurt. Despite the bulk of the action being up north, a 42 mph gust occurred in Logan Township (Gloucester).
Several beautiful weather days followed, including the 11th, which was the first day since July 9th without a single NJWxNet station having a minimum temperature of 70° or higher and no station with a maximum temperature of 80° or higher for the first time since June 14th. Showers returned on the 13th where in Cape May County, West Cape May saw 1.41”, Wildwood 1.25”, and Lower Township 1.00” and 1.02”. Elsewhere, Harvey Cedars (Ocean) came in with 1.17”, Cedar Bridge (Burlington) 1.08”, and Woodland Township (Burlington) 1.03”. The following afternoon saw heavier rain hit Franklin Township (Gloucester) with 1.85”, Sicklerville (Camden) 1.69”, South Harrison 1.61”, Woodbine (Cape May) 1.52”, Little Egg Harbor Township (Ocean) 1.48”, Pittsgrove (Salem) 1.47”, and Atlantic City Marina (Atlantic) 1.39”.
The 18th brought scattered storms to much of the state, with the heaviest concentration in the northwest. Three reports from Blairstown (Warren) included 2.14”, 1.50”, and 1.30” filling gauges. Branchburg (Sussex) had 1.90”, Kingwood (Hunterdon) 1.85”, Andover (Sussex) 1.54”, Frenchtown (Hunterdon) 1.46”, and Bridgewater Township 1.39”. The Frenchtown storm also included hail up to 3/8” in diameter, while winds toppled trees and brought down power lines at locations in Warren, Hunterdon, Somerset, and Bergen counties.
Strong storms through the northern portion of south Jersey on the 19th included a downburst that produced a 78 mph gust at Columbus. Trees, power lines and some structures were damaged in Camden, Burlington, Ocean, and Monmouth counties. Heavy rain accompanying these storms deposited 2.40” in Harvey Cedars, 2.22” at Howell (Monmouth), 2.04”, 1.73”, and 1.45” at three Stafford Township locations, and 1.42” at Oswego Lake (Burlington).
More storms during the late afternoon of the 21st brought reports of small hail in Burlington County, with county locations catching 1.93” of rain in Medford Township, 1.90” in Medford Lakes, 1.81” and 1.21” in Evesham, and 1.58” at Moorestown. Tree and power line damage was reported in five counties in the central third of the state.
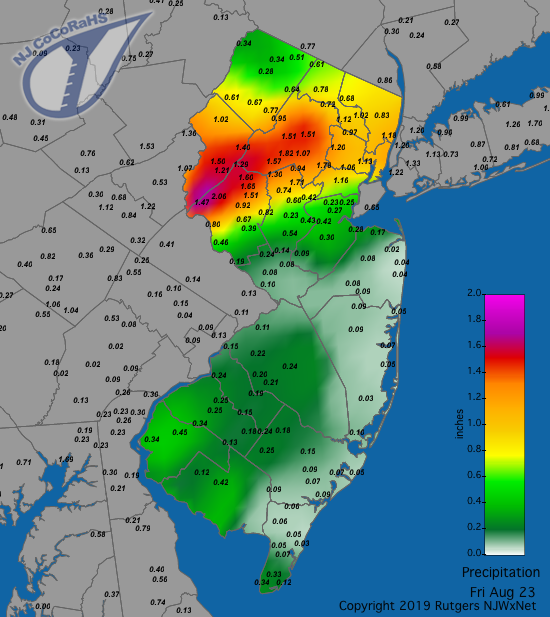
A line of strong storms traversed northern NJ during the early evening of the 22nd, with light rain most elsewhere, though little to none along the coast (Figure 4). The heaviest totals included 2.56” in Greenwich Township (Warren), Washington Township (Morris) 2.19”, Bethlehem Township 2.06”, and Randolph Township (Morris) 1.82”. 50 other stations out of the 217 reporting saw between 1.00”–1.79”. Once again, tree and wire damage occurred, this time in areas along the Interstate 78 corridor. Fortescue had a gust of 48 mph. Cool air invaded the state on the 23rd, and with it, some morning rain fell along the southern coast. Wildwood Crest (Cape May) received 1.00” and 0.79”, West Cape May 0.94”, and North Wildwood (Cape May) 0.76”.

Figure 4. Rainfall from approximately 7AM on August 22 to 7AM on August 23. Observations are comprised of reports from CoCoRaHS stations.
August rainfall finished up on the 28th along the northern coast, with the Monmouth County communities of Long Branch catching 1.00” and 0.97”, Ocean Township 0.93”, Monmouth Beach 0.85”, and Oceanport 0.65”.
In addition to 40+ mph gusts previous mentioned, the 1st saw a gust of 41 mph at Lower Alloways Creek Township and the Vineland anemometer reached 46 mph on the 9th. The highest barometric pressure during the month was in the 30.25”–30.30” range on both the 25th and 31st. The lowest was from 29.65”–29.70” on the 8th.
Temperature
Warm and cooler weeks alternated over the course of August, with the first and third ones warmest. The first of the 12 days with 90° maximums began on the 1st with Lower Alloways Creek Township at 91° and 90° at Hillsborough-Duke. Piney Hollow (Gloucester), Upper Deerfield, West Deptford (Gloucester), and Hillsborough-Duke reached 90° on the 3rd. Upper Deerfield, Vineland, and West Deptford topped out at 92° on the 4th, with 27 NJWxNet stations at 90° or 91°. Upper Deerfield hit 90° on the 5th. The 7th saw Columbus, Lower Alloways Creek Township, Sewell (Gloucester), and Upper Deerfield at 93°.
Heat returned 10 days later to begin a run of six consecutive 90° plus days. Highs on the 17th reached 92° in Hawthorne and West Deptford and 90°–91° at 21 locations. Basking Ridge (Somerset), Cherry Hill (Camden), Hawthorne, and West Deptford reached 94° on the 18th, with 34 sites from 90°–93°. The 19th was the hottest day of the month, with Sicklerville up to 96°, Cherry Hill, Hawthorne, and Upper Deerfield at 95°, and 43 stations from 90°–94°. The coolest maximums that day were 83° at High Point Monument (Sussex), Harvey Cedars, West Cape May, and Atlantic City Marina. The 20th saw Upper Deerfield at 94° and Basking Ridge and West Deptford 93°. South Harrison and Upper Deerfield topped out at 93° on the 21st, with 34 locations from 90°–92°. High Point Monument only got to 80° on the 21st and 81° on the 22nd, the latter day seeing Lower Alloways Creek Township and Upper Deerfield up to 94° and 47 stations from 90°–93°. Berkeley Township and Upper Deerfield snuck in a 90° maximum on the 30th.
On the cool side of the ledger, there were 13 days with one or more NJWxNet station having a minimum of 55° or lower. The northwest valley location of Walpack (Sussex) was a part of every one of those lows, oftentimes with Sandyston (Sussex), which is in Stokes State Forest. Those two stations started things off on the 5th, with minimums of 54°. They repeated on the 9th, each at 55°, and at 50° on the 10th when Pequest (Warren) came in at 52°. The 11th found Walpack down to 46°, Sandyston 47°, Pequest 49°, and 20 NJWxNet stations from 50°–55°. Sandyston and Walpack fell to 49° on the 12th, with 10 stations from 50°–55°.
Cool nights returned on the 23rd, with Walpack at 51° and Sandyston 53°. Sandyston and Walpack hit 47° on the 24th, with Pequest 49°. Walpack and Hopewell bottomed out at 50° on the 25th. On the 26th it was again Walpack and Sandyston leading the way at 44° and 46°, respectively. 20 other stations dropped to 50°–55°, while Atlantic City Marina, being located adjacent to seasonally-mild coastal waters, had the warmest NJ low at 67°. Walpack was 46° and Sandyston 48° on the 27th, with 26 locations from 50°–55°. Atlantic City Marina and Harvey Cedars only fell to 68°.
Following a one-day break, the cool weather brought a 29th minimum of 50° to Walpack and 52° at both Pequest and Sandyston. The 30th saw a cool start, with Sandyston at 47°, Walpack, Pequest, and Hopewell Township 48°, and 23 locations from 50°–55°. The day warmed up considerably, with Berkeley Township in the sandy Pinelands rising from a low of 52° to a 90° maximum. Walpack ended the month with a 48° low on the 31st.
Summer 2019 Overview
Another warm, wet summer was entered into the climate record books. The persistence of above-normal temperatures from June through August resulted in the 2019 summer coming in tied with both 1999 and last summer as the 5th warmest dating back to 1895 (Table 2). The 74.3° average was 1.8° above the 1981–2010 mean, resulting from the 22nd warmest June, 5th hottest July, and 14th warmest August. Twelve of the 16 warmest summers of the past 125 years have occurred since 1999.
| Rank | Year | Summer Avg. Temp. |
|---|---|---|
| 1 | 2010 | 75.7° |
| 2 | 2016 | 74.9° |
| 3 | 2005 | 74.8° |
| 4 | 2011 | 74.6° |
| 5 | 2019 | 74.3° |
| 5 | 2018 | 74.3° |
| 5 | 1999 | 74.3° |
| 8 | 2012 | 74.2° |
| 9 | 2002 | 74.0° |
| 10 | 1949 | 73.9° |
| 11 | 2006 | 73.6° |
| 11 | 1988 | 73.6° |
| 13 | 1955 | 73.5° |
| 13 | 2013 | 73.5° |
| 13 | 1973 | 73.5° |
| 16 | 2008 | 73.4° |
Table 2. The 16 warmest summers (June–August) across New Jersey since 1895.
Statewide, the average summer 2019 rainfall was 15.08”. This is 2.40” above average and ranks as the 38th wettest on record. Last summer’s 14.77” ranks 41st wettest and 2017 with 14.78” ranks 40th, providing quite a consistent three-year run. Five different counties had stations in the top six for wetness, led by Tabernacle (Burlington) with 24.41”. This was followed by Mt. Laurel (Burlington) at 23.87”, Stafford Township (Ocean) 23.53”, Westfield (Union) 22.20”, Lebanon (Hunterdon) 22.08”, and Woodbridge (Middlesex) 21.76”. Six of the seven driest locations were found in Cape May County. This includes Wildwood Crest at 7.84”, Middle Township 9.11”, Sea Isle City 9.66”, Woodbine 10.09”, and Lower Township 10.42” and 10.46”. Storms more often avoided Point Pleasant Beach (Ocean) with only 10.19” accumulating. There was an impressive difference of 13.34” between this northern Ocean County community and Stafford Township, just around 25 miles to the south, and 11.57” with Woodbridge Township 35 miles to the north.
There were numerous severe thunderstorms over the course of the season, with eight of them generating minor tornadoes. The twisters were all rated EF0 or EF1, with no serious injuries reported. This year’s total to date ties with 1973 and 1990 as the third most in NJ in any year since 1951, and of course four months remain in 2019. The most in one year was 17 in 1989, with one F2 and the rest F1 or F2*. 1987 had the second most with 9, one being a F2, the remainder F0 or F1. 1973 had two F3s and F2 and the remainder F0 or F1, while 1990 had one F3, one F2, and the remainder weaker.
* A transition to EF rankings occurred in 2007, with no large difference in strength at these lower end ratings between the former and current system.
For those seeking more detailed information on 5-minute, hourly, daily and monthly conditions, please visit the following Office of the NJ State Climatologist's websites:
Rutgers NJ Weather Network
NJ Community Collaborative Rain, Hail and Snow Network
NJ Snow Event Reports
Interested in receiving our monthly summaries at the end of each month? Send us your e-mail address here to join the mailing list.
Past News Stories

