Strange, Just Plain Strange: June 2023 Recap, Plus First Half of 2023 Review
New Jersey State Climatologist
Center for Environmental Prediction, School of Environmental and Biological Sciences/NJAES
Rutgers University
July 11, 2023
Overview
There is rarely a month in New Jersey where something interesting, exciting, and different than normal doesn’t occur in the weather and climate department. However, not often do you find a month like this past June where one is left with their head spinning as smoke from near and distant wildfires darkened the sky, creating exceptionally unhealthy air quality, where growing drought concerns were quieted in most locations by late-month downpours, where two tornadoes touched down, and with temperatures averaging cooler than normal for the second consecutive month. Strange, indeed.
June temperatures across the state averaged 67.8°. This was 2.5° below the 1991–2020 mean and tied as the 36th coolest June since 1895. The average daily maximum temperature of 79.0° was 2.0° below normal and ranks 40th coolest. The daily minimum averaged 56.6°, 3.0° below normal and was 35th coolest. The northern NJ climate division averaged 66.1° (-2.5°, 33rd coolest), the southern division averaged 68.9° (-2.5°, 36th coolest), and the coastal division averaged 68.2° (-2.3°, 45th coolest). Both May and June averaged below normal, the first such back-to-back occurrence in NJ since April and May 2020.
NJ June precipitation averaged 3.87” (Figure 1). This was 0.43” below normal, however, it ranks as the 53rd wettest of the past 129 years (or 77th driest) due to the skewed nature of the distribution of monthly precipitation over this period. The north averaged 5.13” (+0.52”, 29th wettest [101st driest]), the south 3.19” (-0.95”, 51st driest [79th wettest]), and the coast 2.20” (-1.65”, 28th driest [102nd wettest]).
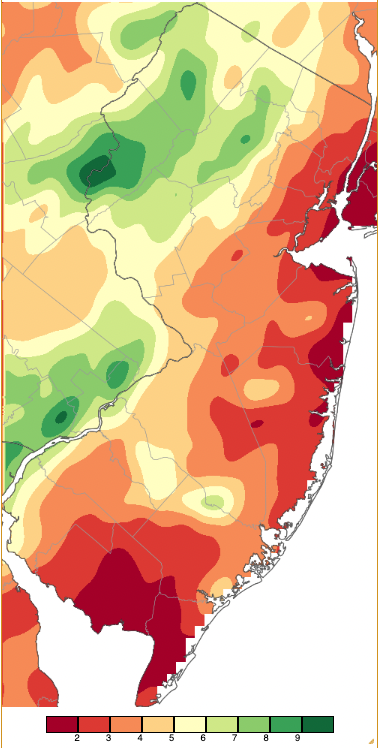
Figure 1. June 2023 precipitation across New Jersey based on a PRISM (Oregon State University) analysis generated using NWS Cooperative, CoCoRaHS, NJWxNet, and other professional weather station observations from approximately 8 AM on May 31st to 8 AM on June 30th. Note the scale in inches at the bottom of the map. Totals range from 1.00”–1.99” (dark red) to 9.00”–9.99” (dark green).
Smoke
As was the case in May, wildfire smoke led the news on multiple occasions. While May smoke from western Canadian fires mainly moved across the state at high altitudes, producing milky skies and red sunrises and sunsets, it did not impact air quality near the surface except in cases of local fires. High altitude smoke was also common in June but, on several occasions, the smoke came from eastern Canada. This smoke arrived under atmospheric conditions that brought the smoke to lower altitudes, impacting air quality and visibility.
The month began with a local wildfire in Bass River State Park (Burlington County). Beginning on May 31st, it was fully contained on June 3rd after scorching approximately 5,500 acres. Smoke drifted over portions of south Jersey as seen in Figure 2 and on the morning of the 2nd combined with fog to close a 25-mile section of the Garden State Parkway for several hours.
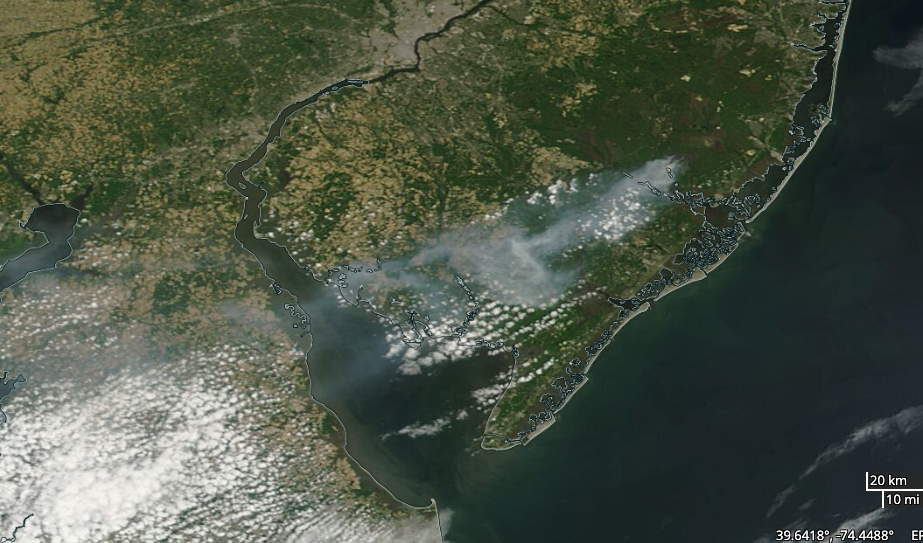
Figure 2. MODIS Terra visible satellite image at approximately 10 AM on June 1 showing grey smoke from the Bass River fire drifting southwestward over south Jersey, Delaware Bay, and central Delaware. The brighter features are cumulus clouds. Courtesy of NASA.
Winds from the northwest introduced a remarkable influx of smoke into the state during the daytime hours of June 7th (Figure 3). The Air Quality Index in north and central Jersey approached the top of the scale for the first time in its 43-year existence, making the air as unhealthy as anywhere on earth for several hours on the 7th and of poor quality for several days. Solar radiation was greatly reduced in the north as seen in the Figure 4 map. The time series of solar radiation at Haworth (Bergen) demonstrates just how little light made it to the surface for a period of time (Figure 5). This is particularly notable when compared to far less smoky conditions at West Cape May (Cape May) in the far south.
Subsequent days saw smoke high aloft until near month’s end, centered on the 29th, when there was a period with smoke at the surface, with its noticeable smell and poor air quality.
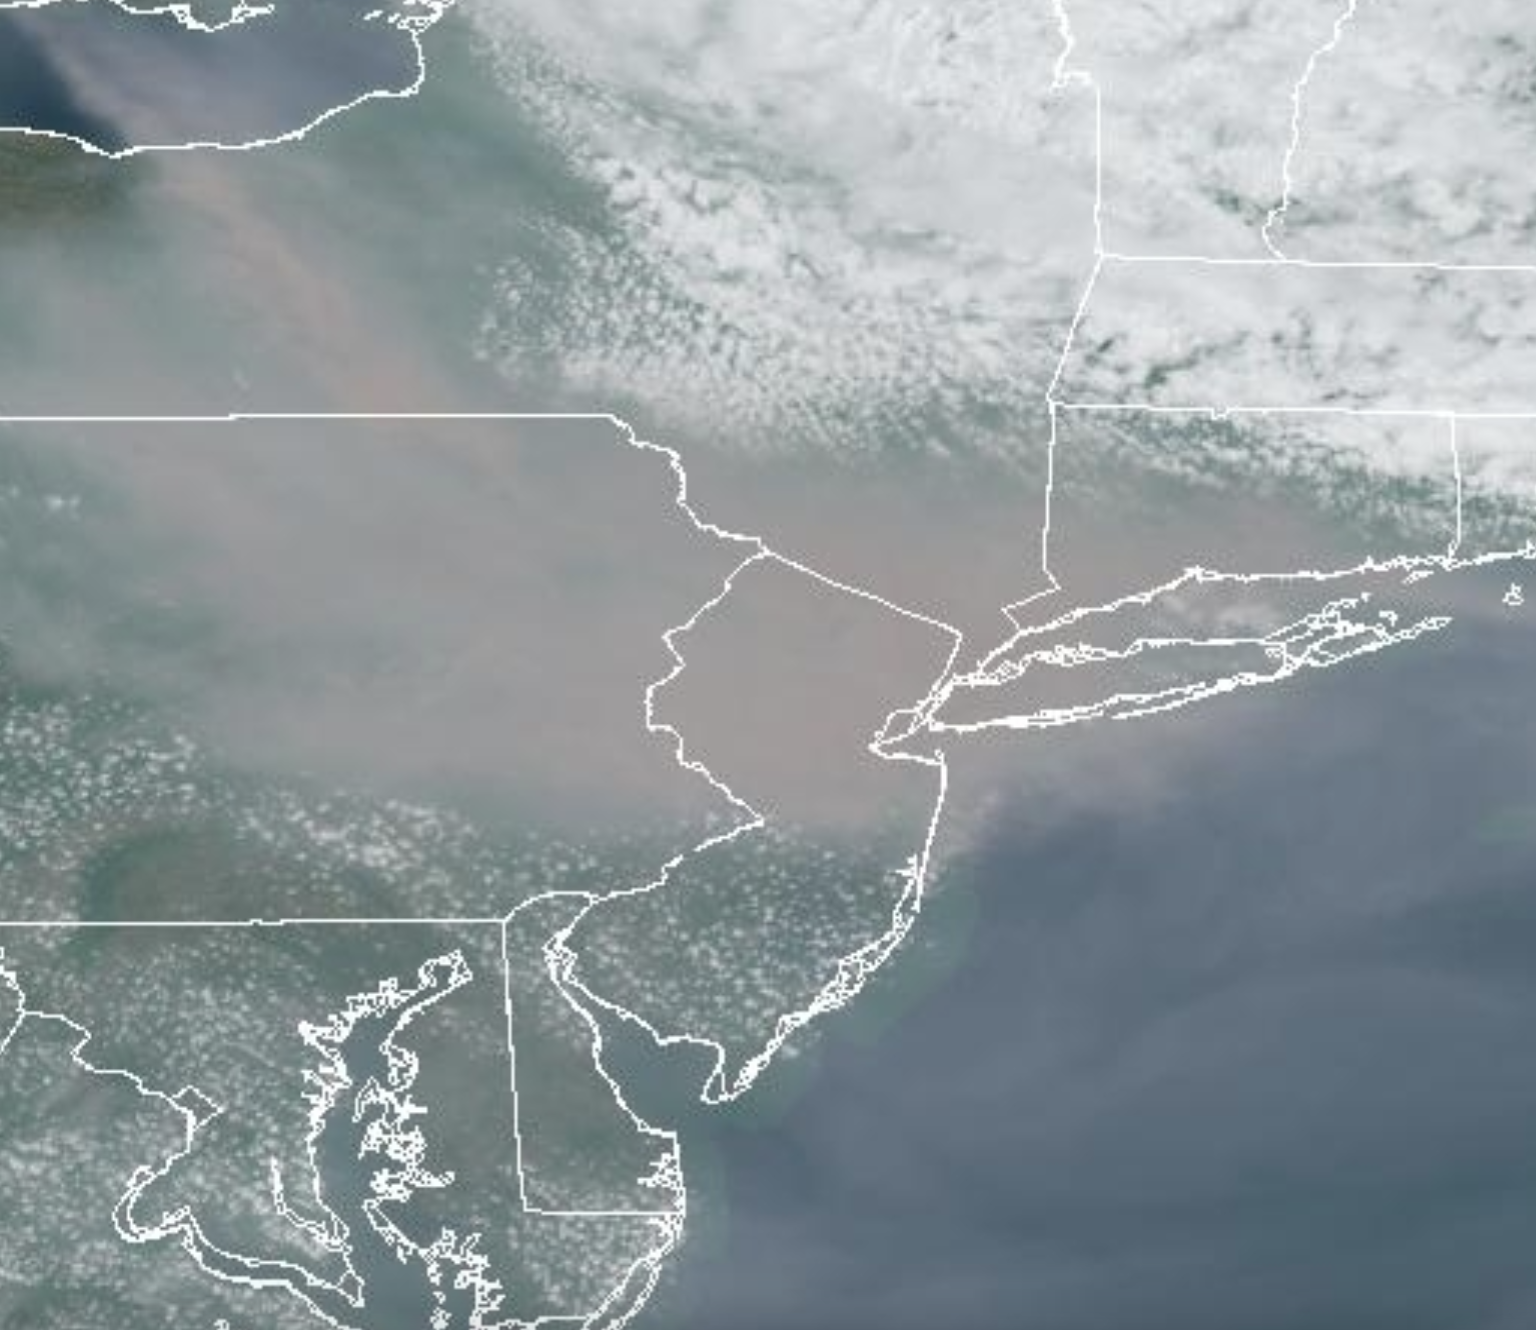
Figure 3. Smoky skies over northern New Jersey and surroundings at 2:02 PM on June 7th. Note the presence of scattered cumulus clouds south of the area of densest smoke where the atmosphere is less stable than within the smoky zone. (NOAA GOES visible satellite image).
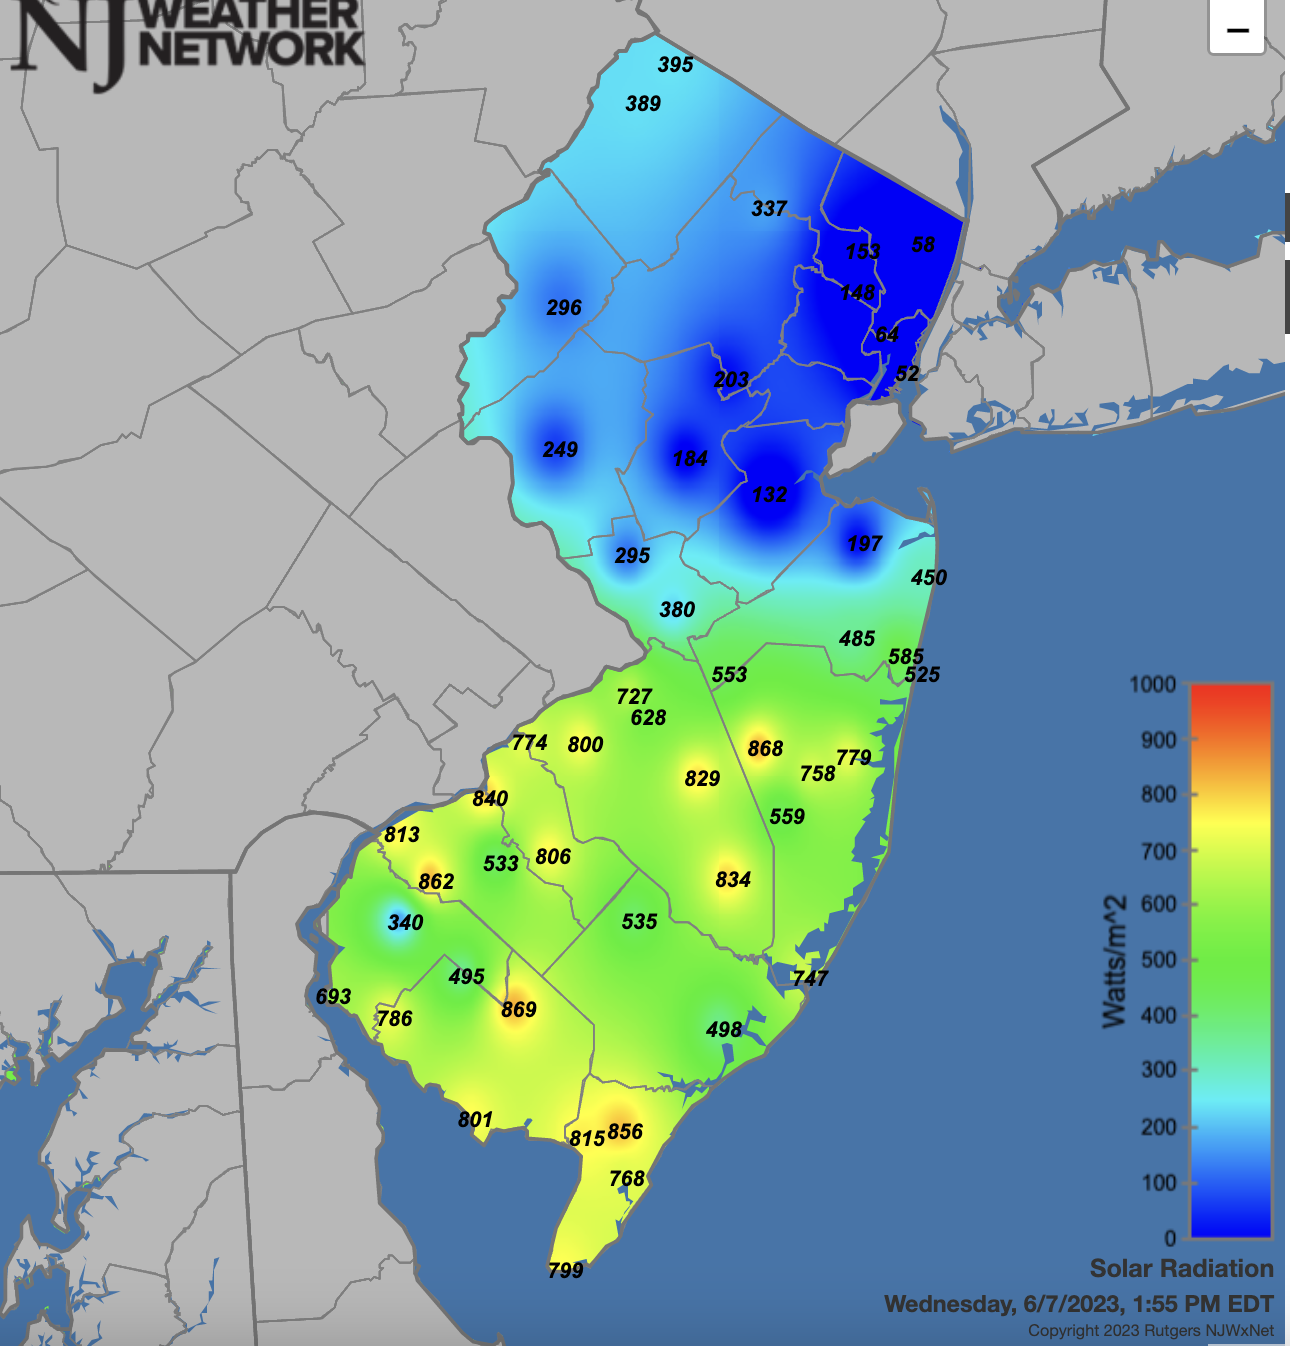
Figure 4. Solar radiation observed at NJWxNet stations at 1:55 PM on June 7th.
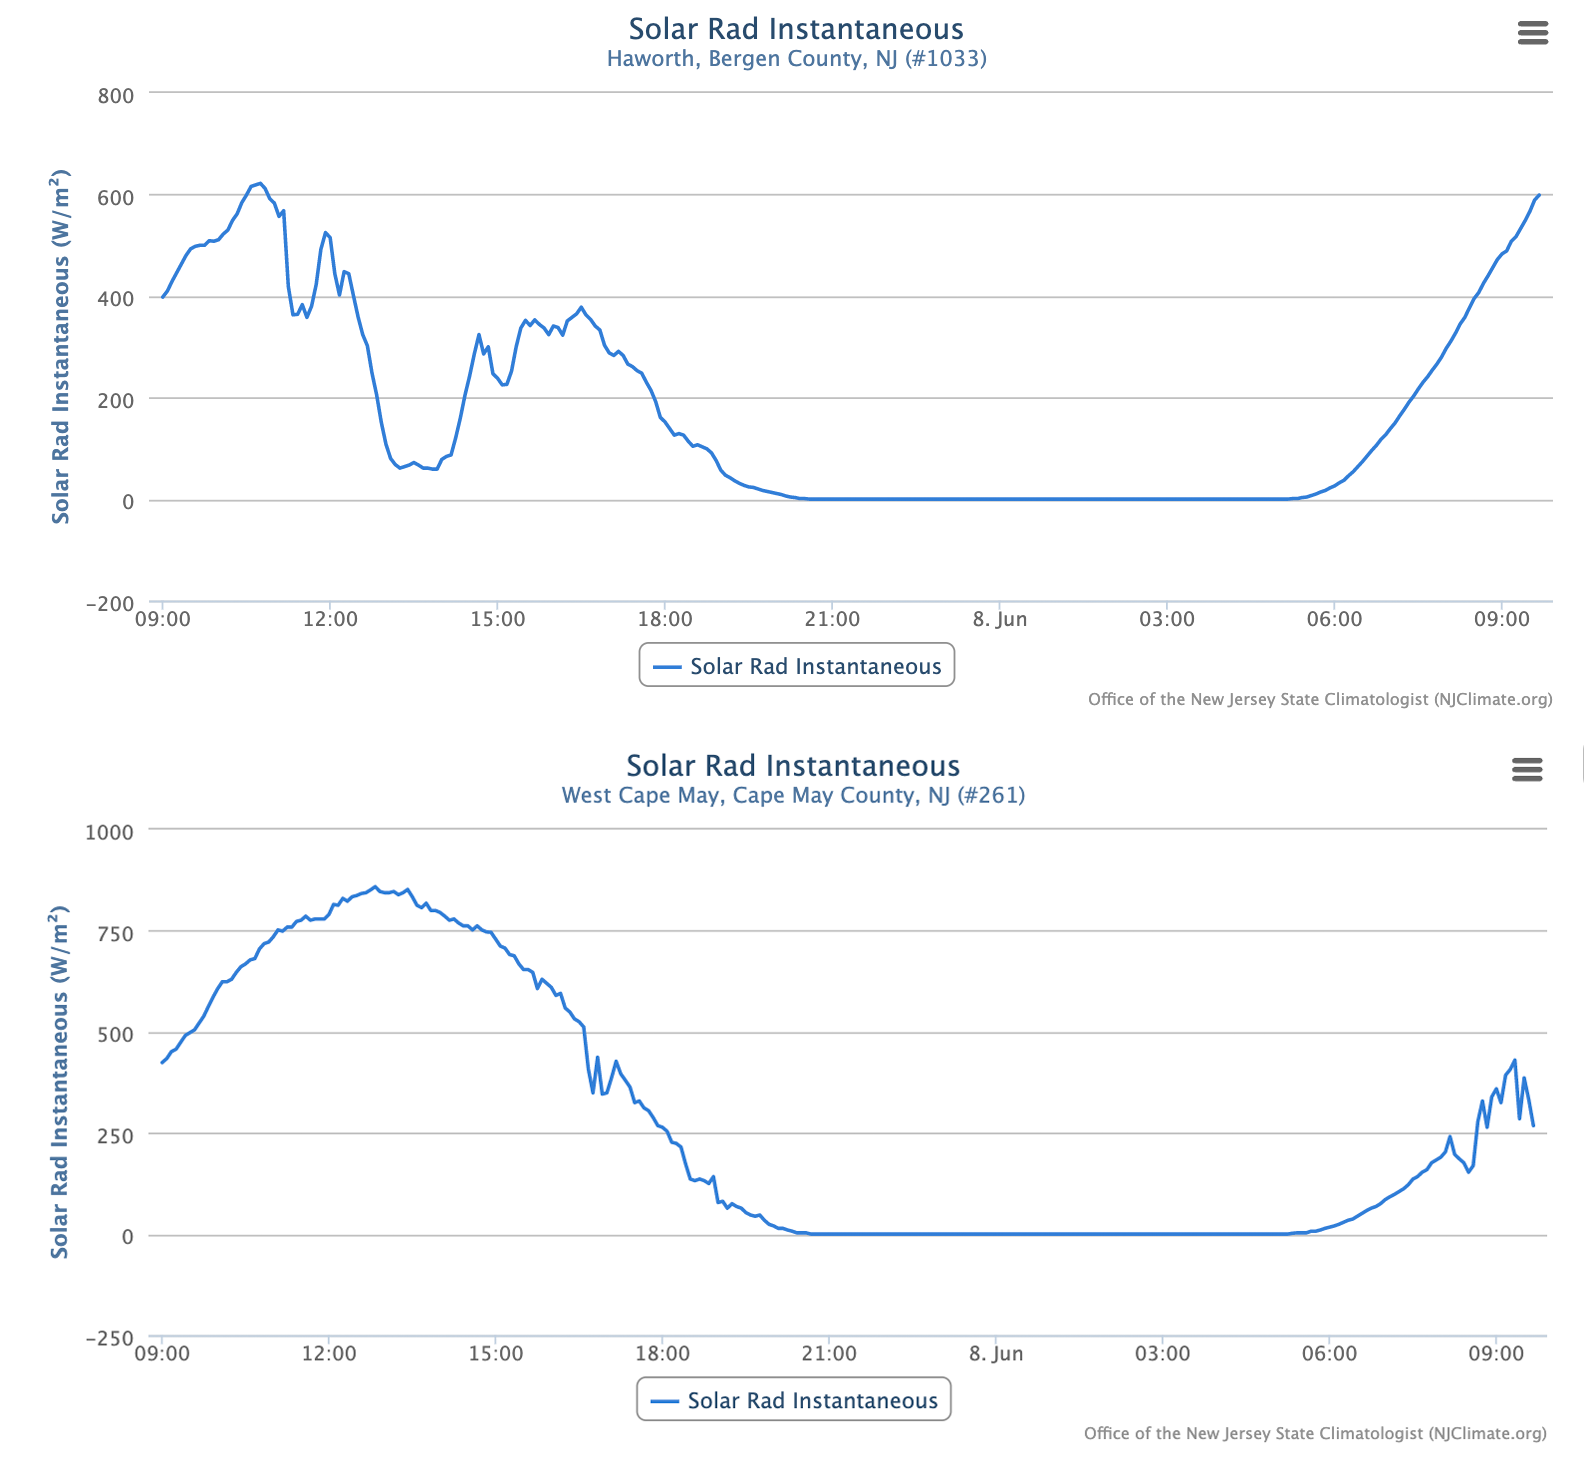
Figure 5. Time series of solar radiation at (top) Haworth (Bergen) and (bottom) West Cape May (Cape May) NJWxNet stations from 9:40 AM on June 7th to 9:35 AM on June 8th. The tremendous impact of the dense smoke is noted in the early afternoon of the 7th at Haworth, while skies remained much less smoky throughout the day at West Cape May, more typical of a clear June day, though somewhat impacted by a thinner, more elevated veil of smoke than in the north.
Precipitation and Storms
As the Figure 1 map depicts, there was a wide range of June precipitation totals around NJ. The largest total included 9.92” in Lebanon (Hunterdon), followed by Denville (Morris) at 9.35” and 8.74” (two stations), Belvidere (Warren) 8.81” and 8.59”, Newton (Sussex) 8.57”, and White Township (Warren) 8.51”. On the low end was Middle Township (Cape May) at 1.02” and 1.56”, Sea Isle City (Cape May) 1.20”, Long Branch (Monmouth) 1.35”, Neptune (Monmouth) 1.47”, Middletown (Monmouth) 1.55”, and Maurice River (Cumberland) 1.57”.
Not a single NJ station received a daily total over 0.50” during the first 11 days of the month, though a storm deposited small hail in Ewing (Mercer) on the 1st. Come the 12th, light morning showers became heavier in the afternoon, delivering 1.42” to Pennsville (Salem), Newton 1.17”, and Collingswood (Camden) 1.16”. Of 282 CoCoRaHS reports, 19 were from 1.00”–1.42” and 127 from 0.50”–0.97”. Winds gusted to 46 mph at Lower Alloways Creek Township (Salem). On the 14th, winds gusted to 43 mph at Little Egg Harbor Township (Ocean) and 42 mph in Stewartsville (Warren), pea size hail fell on Liberty Township (Warren), and Manchester Township (Ocean) received 0.83” and White Township 0.71” of rain.
The first significant severe weather of the month occurred on the 16th. This included an EF0 tornado in Pemberton (Burlington) that was on the ground for 3.4 miles between 12:55 and 1:01 PM, with a maximum width of 200 yards. Damage was mostly limited to trees and there were no reported injuries. Wind damage was also reported in Gloucester, Burlington, Ocean, and Atlantic counties as a line of storms moved eastward through the state from late morning to midafternoon. Rainfall amounted to as much as 1.53” in Linwood (Atlantic), Monroe Township (Gloucester) 1.49”, and Hamilton Township (Atlantic) 1.43”. Of 276 CoCoRaHS reports, 27 were from 1.00”–1.53” and 51 from 0.50”–0.97”. Straight line winds gusted to 58 mph at Lower Alloways Creek Township, 43 mph in Columbus (Burlington), and 40 mph at Berkeley Township (Ocean).
Isolated late afternoon storms on the 17th brought pea-size hail and tree damage to Hillsborough (Somerset) and Montgomery (Somerset) and 0.56” of rain in Clinton (Hunterdon). Also, winds gusted to 48 mph in Point Pleasant (Ocean), 43 mph in Vernon Township (Sussex), 42 mph at Seaside Heights (Ocean), and 41 mph at Harvey Cedars (Ocean). Moderate rain in Cape May County on the 21st brought 0.87” to Wildwood Crest, three Middle Township stations with 0.66”, 0.64”, and 0.56”, and 0.60” at North Wildwood. A peak gust of 41 mph occurred at Atlantic City Marina (Atlantic). Middle Township received another 0.50” on the morning of the 22nd.
What had been growing drought concerns across all of the state began to diminish in the last week of June. Numerous storms moved through the state during this period, beginning on the morning of the 23rd into the first half of the 24th (Figure 6), resuming during the second half of the 25th and appearing off and on through the 27th. The first episode brought as much as 3.27” to Hammonton (Atlantic), 2.13” and 1.88” to a pair of Denville stations, Boonton (Morris) 1.84”, Morris Township 1.81”, and Washington Township (Morris) 1.75” and 1.80”. Totals ran from 1.00” to 3.27” at 43 stations and 0.50”–0.99” at 80 sites.
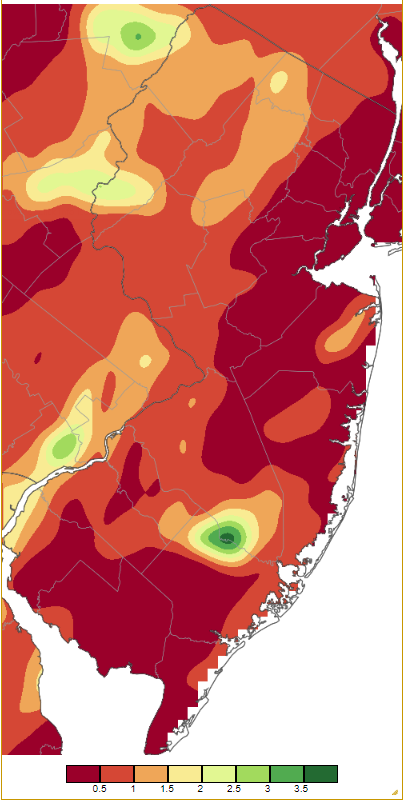
Figure 6. Precipitation across New Jersey from 8 AM on June 23rd through 8 AM June 25th based on a PRISM (Oregon State University) analysis generated using NWS Cooperative, CoCoRaHS, NJWxNet, and other professional weather station observations. Note the scale in inches beneath the map.
The prolonged second round of storms delivered 7.05” to Lebanon, Denville saw 6.08” and 5.95”, Belvidere 6.06” and 6.04”, Liberty Township 5.71”, Rockaway Township (Morris) 5.65”, Oxford Township (Warren) 5.63”, and Mount Olive (Morris) 5.61” (Figure 7). Of 288 CoCoRaHS reports, 19 were from 5.00”–7.04”, 34 from 4.08”–4.93”, 36 from 3.00”–3.98”, and 120 from 1.00”–2.99”. The second tornado of the month touched down in Bedminster (Somerset) on the 26th. An EF1 in strength with winds estimated to be as high as 105 mph, it traveled for 1.4 miles and was as wide as 475 yards. Significant tree damage occurred but no major structural damage was noted, and no one was injured. This was New Jersey’s 10th tornado of 2023, making for the third most in a year since records commenced in 1950. Only 1989 with 18 and 2021 with 13 have seen more, and, of course, half of this year remains for potential additional activity. Pea-size hail fell in some north Jersey locations on the 25th and 26th, with wind damage reported in more than half of the state’s counties. Lower Alloways Creek Township had a 57-mph gust on the 27th.
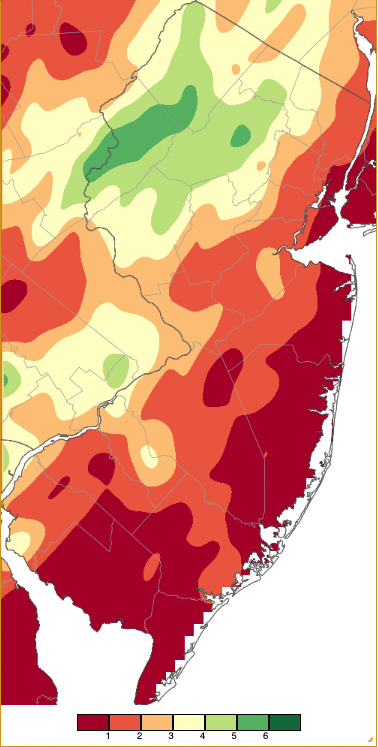
Figure 7. Precipitation across New Jersey from 8 AM on June 25th through 8 AM June 28th based on a PRISM (Oregon State University) analysis generated using NWS Cooperative, CoCoRaHS, NJWxNet, and other professional weather station observations. Note the scale in inches beneath the map that differs from Figure 6.
Statewide, barometric pressure only made it as high as 30.20”–30.30” on the 21st. Pressure fell to 29.45”–29.55” on the 14th. In addition to gusts exceeding 40 mph on six days that were previously mentioned, Basking Ridge had a 41-mph gust on the 5th, and the 6th brought gusts of 46 mph to Pennsauken (Camden), Little Egg Harbor Township 44 mph, Fortescue (Cumberland) 41 mph, and Lower Alloways Creek Township 40 mph.
Temperature
Daily high temperatures reached 90° or greater on only four June afternoons. The month began with highs of 91° at both Hillsborough-Duke (Somerset) and Pequest (Warren) on the 1st with two other stations at 90°, while it only made it up to 67° at ocean-cooled Harvey Cedars. The 2nd was by far the hottest day this June with the temperature up to 95° at four of the 67 NJWxNet stations and from 90°–94° at 38 other sites (Figure 8). Again, Harvey Cedars was coolest at 70°. On the 11th, Moorestown and Pennsauken reached 91° with seven other stations at 90°. The remainder of June brought only one 90° maximum, this occurring at Moorestown on the 26th.
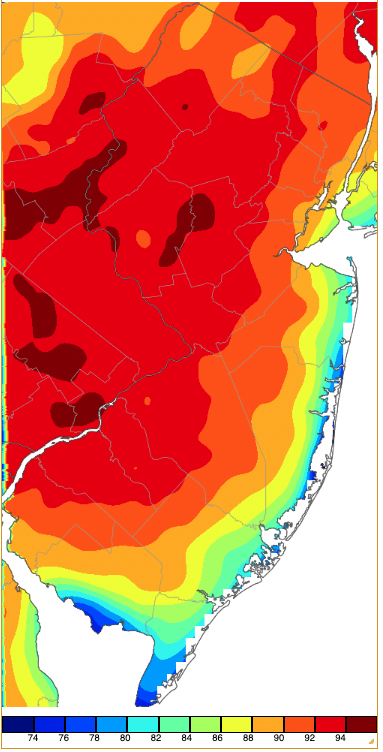
Figure 8. Maximum temperatures on June 2nd based on a PRISM (Oregon State University) analysis generated using NWS, NJWxNet, and other professional weather stations. Note the 2° scale beneath the map.
There were five June mornings, all during the first eight days of the month, where one or more NJWxNet station had a low temperature in the 30°s. Walpack (Sussex) fell to 38° on the 1st, later that day rebounding to a tie for third warmest site in the state at 90°. Walpack dropped to 37° on the 4th, with Sandyston (Sussex) at 39° and 23 stations from 40°–45°. The 5th saw lows of 38° at Walpack and 39° in Sandyston. Walpack reached 38° on the 7th. The 8th was an unusually cold June morning for most of NJ (Figure 9). Walpack fell to 33°, both Pequest and Sandyston were 35°, Berkeley Township, Hopewell Township (Mercer), and Basking Ridge were all 37°, Kingwood (Hunterdon) and Hackettstown (Warren) each 38°, and Hillsborough-Duke 39°. Atlantic City Marina was mildest at 58°.
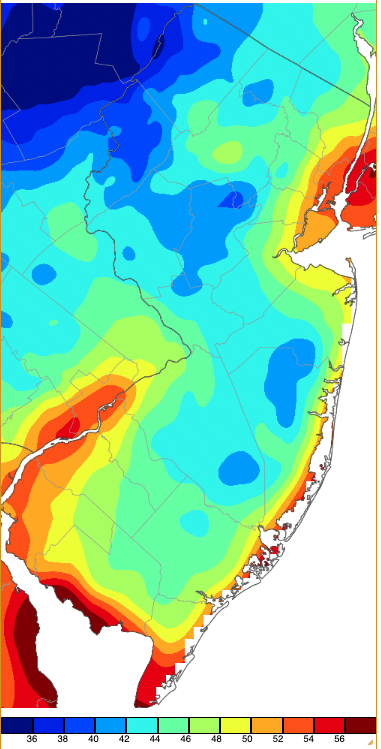
Figure 9. Minimum temperatures on June 8th based on a PRISM (Oregon State University) analysis generated using NWS, NJWxNet, and other professional weather stations. Note the 2° scale beneath the map.
First Half of 2023 Overview
Despite the two most recent months having modestly below-normal temperatures, January to April were mild enough to result in the third warmest first half of the year since records commenced in 1895. The average temperature of 50.8° was 2.6° above the 1991–2020 mean. Only 2012 and 1998 were warmer (Table 1). All of the top 10 warmest first halves have occurred since 1991, with seven of them this century.
| Rank | Year | Jan.–June Avg. Temperature |
| 1 | 2012 | 52.0° |
| 2 | 1998 | 50.9° |
| 3 | 2023 | 50.8° |
| 4 | 2020 | 50.3° |
| 4 | 2010 | 50.3° |
| 4 | 2017 | 50.3° |
| 7 | 2002 | 50.2° |
| 7 | 1991 | 50.2° |
| 9 | 2006 | 49.9° |
| 10 | 1990 | 49.6° |
Table 1. The ten warmest January–June periods since 1895.
Precipitation (rain and melted snow) for the first half of 2023 averaged 19.27" statewide. This was 3.03” below normal and ranks as the 35th driest of the past 129 years. Totals were greatest in the north and well below normal in the south (Figure 10). Coming in with the most were five Morris County communities, including Denville with 29.38”, Mine Hill 28.27”, Randolph Township 28.23”, Chester Township 27.77”, and Rockaway Township 27.06”. On the low end was Woodstown (Salem) with 16.29”, then South Harrison (Gloucester) 16.32”, Pitman (Gloucester) 16.36”, Barrington (Camden) 16.38”, and Upper Deerfield (Cumberland) 16.45”.
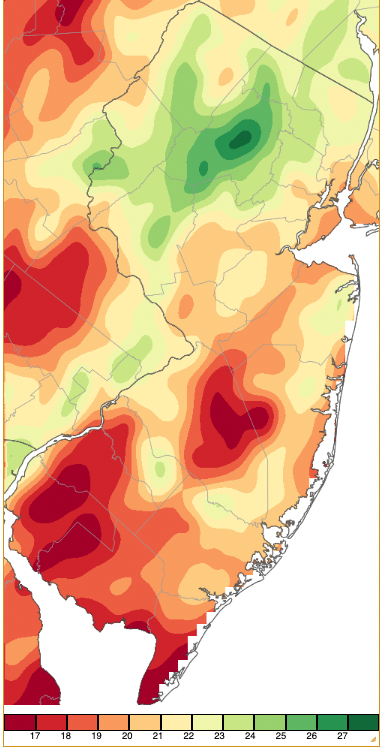
Figure 10. January–June 2023 precipitation across New Jersey based on a PRISM (Oregon State University) analysis generated using NWS Cooperative and CoCoRaHS observations from 7 AM on December 31st to 8 AM on June 30th. Note the scale in full inches at the bottom of the map. Totals range from 16.00”–16.99” (dark red) to 27.00”–27.99” (dark green).
For those seeking more detailed information on 5-minute, hourly, daily, and monthly conditions, please visit the following Office of the NJ State Climatologist's websites:
Rutgers NJ Weather Network
NJ Community Collaborative Rain, Hail and Snow Network
NJ Snow Event Reports
Interested in receiving our monthly summaries at the end of each month? Send us your e-mail address here to join the mailing list.
Past News Stories

