An Atmospheric 180°: September 2024 Recap
New Jersey State Climatologist
Center for Environmental Prediction, School of Environmental and Biological Sciences/NJAES
Rutgers University
October 8, 2024 (Updated October 25th)
Overview
Perhaps the title for this month’s report has captured your attention. Hope so, because while September was a rather quiet month weather-wise for New Jersey, it certainly was an unusual one. As many of you reading this report know, the prevailing winds across the middle latitudes, including New Jersey, tend to be westerlies, comprised of winds blowing from west to east. However, an unusually persistent atmospheric pattern this past month resulted in easterly winds most often blowing across the state. This led to minor coastal flooding, rip currents, and foggy conditions along the coast, and to moderate air temperatures and exceedingly dry conditions throughout NJ.
Looking first at precipitation, the general absence of notable storms either of coastal, tropical, or thunderstorm varieties led to the 3rd driest September on record. With records back 130 years to 1895, the statewide average of 0.83” was only greater than 0.29” in 1941 and 0.38” in 1914 (Table 1). The month fell 3.33” below the 1991–2020 average. The northern climate division averaged 1.12” (-3.34”, 7th driest), southern division 0.63” (-3.36”, 3rd driest), and coastal division 0.94” (-2.95”, 6th driest). The distribution of rainfall is shown in Figure 1, suggesting the coastal and southern divisions would have come in drier had coastal Ocean and Monmouth counties and inland Monmouth not benefited from some heavier late-month rain. Meanwhile some northern areas managed to eclipse the 1.00” mark.
| Rank | Year | Sept. Avg. Precip. |
| 1 | 1941 | 0.29” |
| 2 | 1914 | 0.38” |
| 3 | 2024 | 0.83” |
| 4 | 2007 | 0.99” |
| 5 | 1895 | 1.06” |
| 6 | 1948 | 1.13” |
| 7 | 2005 | 1.19” |
| 8 | 2019 | 1.25” |
| 9 | 1939 | 1.43” |
| 10 | 1953 | 1.51” |
Table 1. The 10 driest Septembers across New Jersey since 1895.
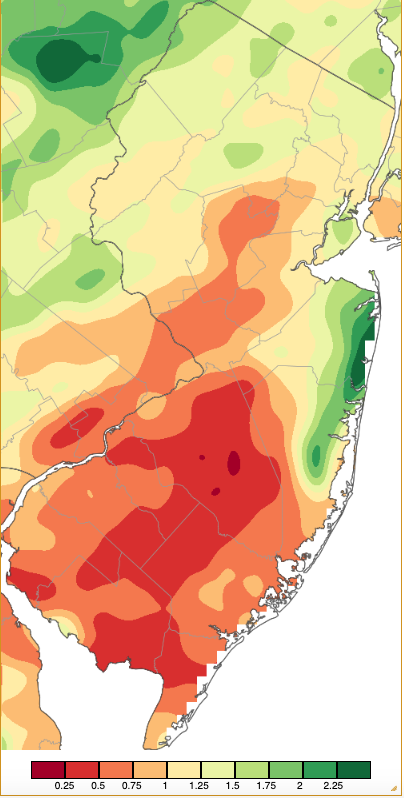
Figure 1. September 2024 precipitation across New Jersey based on a PRISM (Oregon State University) analysis generated using NWS Cooperative, CoCoRaHS, NJWxNet, and other professional weather station observations from approximately 8 AM on August 31st to 8 AM on September 30th. Note the scale in inches at the bottom of the map. Totals range from 0.00”–0.25” (dark red) to 2.25”–2.50” (dark green).
NJ’s statewide average September temperature was quite close to its 1991–2020 normal, coming in at 67.0°, 0.1° above normal. This ranks 31st warmest of the past 130 years due to the most recent 30-year average period being considerably warmer than earlier decades of the 20th century. The average high temperature of 76.7° was 0.5° below normal and the average minimum of 57.3° was 0.7° above normal, both indicative of a month with a prevailing maritime influence. The north averaged 65.0° (+0.1°, 34th warmest), south 68.2° (+0.1°, 31st warmest), and coast 68.7° (no departure, 35th warmest).
A 69th Rutgers New Jersey Weather Network station (NJWxNet) was commissioned on the 12th at Coyle Field in Woodland Township (Burlington County) adjacent to the renowned Pygmy Pine region within the Pinelands.
Atmospheric Pattern
Returning to the previously-introduced explanation for September conditions along the coast and even inland, the following two figures illustrate and explain what occurred. Figure 2 displays wind observations from the Newark Airport National Weather Service (NWS) weather station during the month. Looking specifically at wind direction observations, it is readily apparent that from September 11th through month’s end, there were very few observations of winds arriving from a westerly direction (180°–360° on the right axis of the time series). Such directions were more common but hardly continuous earlier in the month. The absence of strong two-minute average wind speeds or higher instantaneous gusts (left axis) illustrates the absence of September storms or major air mass changes (frontal systems).
The persistent easterly flow is explained by examining the map showing global surface air pressure anomalies from September normals (Figure 3). More specifically, examining the top-right box in the figure shows anomalous high pressure to the north and northeast of NJ and lower-than-normal pressure to the south and southeast. This combination of air rotating clockwise around the high region and counterclockwise around the low led to the persistent onshore/easterly flow.
The high pressure also deflected any storms from encroaching on the Mid-Atlantic and Northeast, ensuring dry weather. This pattern also led to persistent minor back-bay flooding, as witnessed at the Manahawkin Bay tide gauge in Ship Bottom (Ocean) where minor flooding occurred during 20 of the 26 high tides from September 18th through the 30th. The flow also resulted in frequent moderate to high rip currents in ocean surf zones, contributed to frequent foggy conditions due to moist air moving ashore (see the lead photo), and frustrated mariners with frequent small-craft advisories.
Data have yet to be examined to determine just how often this occurs, but it would be interesting to see if 1941, 1914, and other top-ten dry Septembers experienced a similar atmospheric pattern.
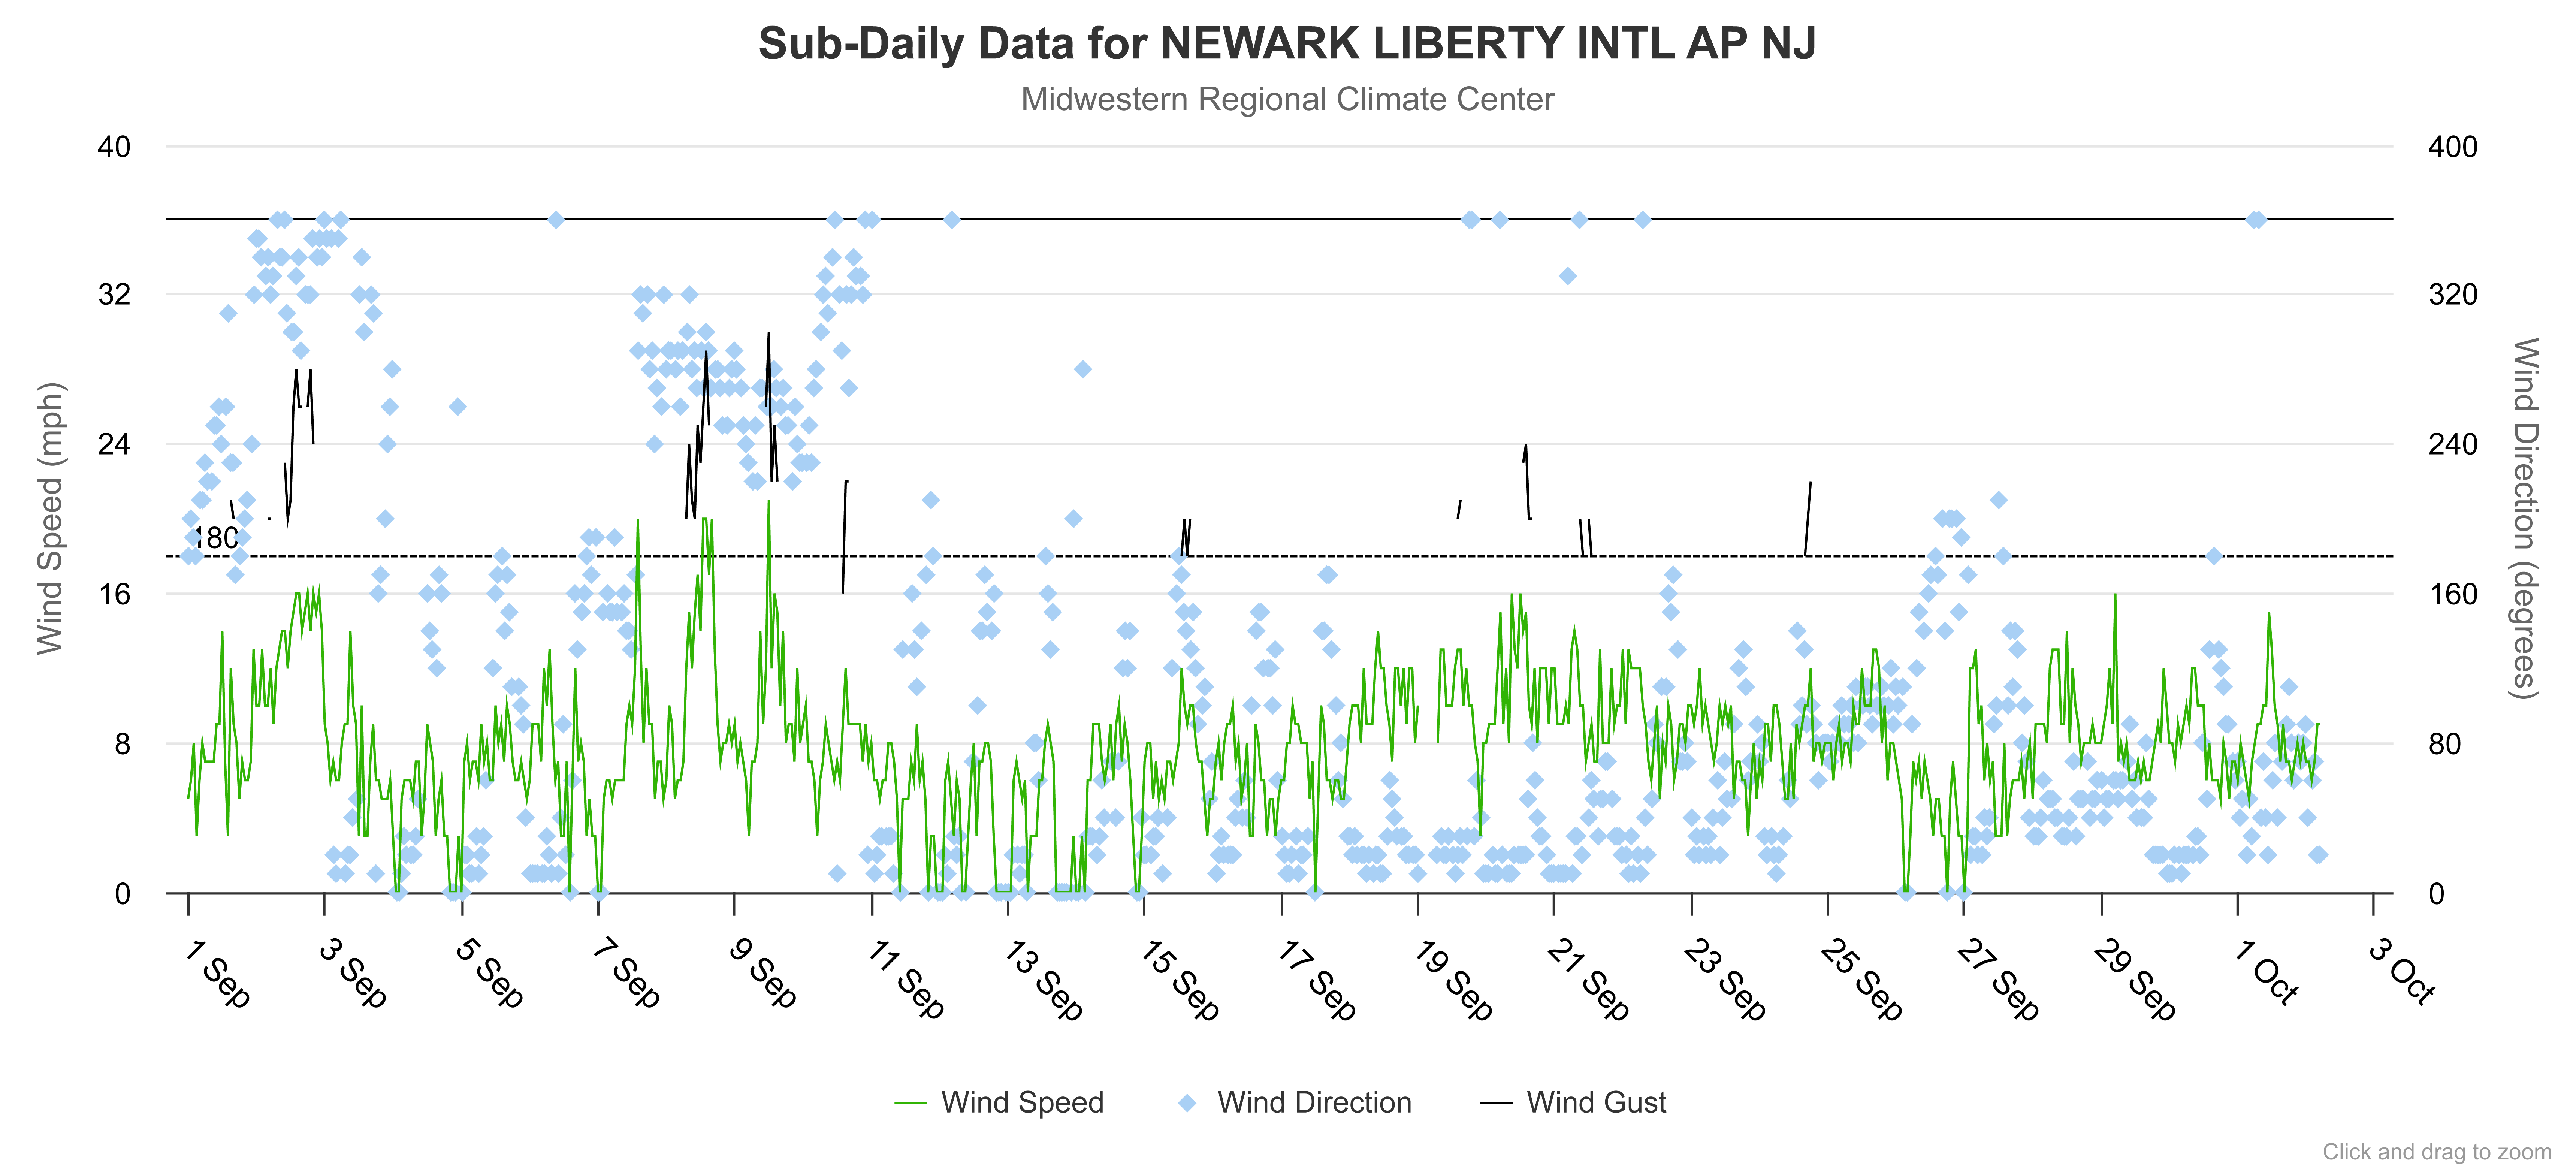
Figure 2. Time series of September 1–30, 2024, wind speed and direction at the National Weather Service weather station at Newark Liberty International Airport (Union). Note the wind speed (green line) and wind gust plots with the scale (mph) on the left axis. Also, the wind direction values with the scale (degrees) on the right axis (produced by A. Broccoli using the Midwest Regional Climate Center cli-MATE tool).
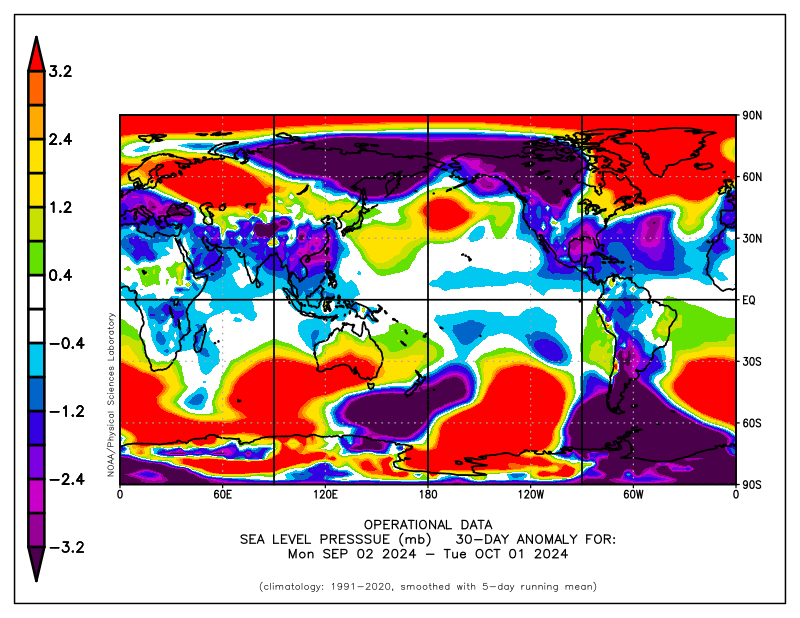
Figure 3. 30-day anomaly map of sea level pressure (mb) for the September 2–October 1, 2024, period. Note that the red coloring represents above-normal values and purple for below-normal values. The north Atlantic and eastern North America is in the top right box (produced by A. Broccoli using the NOAA Physical Sciences Laboratory climate plotting and analysis tool).
Precipitation and Storms
This section of the report is one of the shortest of its kind in many years of crafting these monthly reports. There was only one multi-day episode late in the month where a small number of Community Collaborative Rain, Hail, and Snow Network (CoCoRaHS) or Rutgers NJ Weather Network (NJWxNet) totals surpassed an inch. This was one of seven events where a few locations saw greater than a half inch. Top station totals for September include 2.89” and 2.73” at two Wall Township (Monmouth) stations. They are followed by Neptune Township (Monmouth) at 2.70”, Long Branch (Monmouth) 2.40”, Brick Township (Ocean) 2.37”, Oceanport (Monmouth) 2.16”, High Point (Sussex) 2.07”, and Pine Beach (Ocean) 1.93”. On the dry side, gauges at Piney Hollow (Gloucester) and Hamilton Township (Atlantic) each caught just 0.22”. This is followed by 0.26” and 0.28” at two Monroe Township (Gloucester) locations, two in Hammonton (Atlantic) at 0.27” and 0.28”, both Cherry Hill (Camden) and Fortescue (Cumberland) with 0.25”, and Franklin Township (Gloucester), Columbus (Burlington), and Lower Alloways Creek Township (Salem) each with 0.30”.
September 1st saw afternoon showers fall, mainly in the northwest and along the northern coast. Sandyston (Sussex) caught 0.54”, Millstone Township (Monmouth) 0.52”, Walpack (Sussex) 0.49”, and Frelinghuysen Township (Warren) 0.47”. Scattered daytime showers on the 6th dropped as much as 0.20” in Egg Harbor Township (Atlantic). The afternoon of the 7th brought some windy showers to Vernon Township (Sussex) with 0.80”, Montague Township (Sussex) 0.69”, and Haworth (Bergen) 0.63”. Fourteen CoCoRaHS stations came in between 0.50” and 0.80”. Two NJWxNet stations recorded wind gusts of 40 mph or greater, the only such strong winds this September. This included a 43 mph at Lower Alloways Creek Township and 40 mph in Seaside Heights (Ocean). It was not until the 17th that evening showers, extending into the 18th in the far south, brought 0.61” to Wildwood Crest (Cape May) and three Lower Township (Cape May) stations reporting 0.37”–0.60”.
The last week of the month saw three events dampen multiple locations. Afternoon and evening showers on the 25th brought top totals to Roxbury Township (Morris) 0.60” and Bordentown (Burlington) 0.35”. Beating these totals a bit, daytime and evening showers on the 26th into early on the 27th added up to 0.63” at Kingwood (Hunterdon), Mendham (Morris) 0.62”, Knowlton Township (Warren) 0.59”, Chester Borough (Morris) 0.55”, Chester Township (Morris) 0.54”, and Lebanon (Hunterdon) 0.50”.
The most notable rain episode of the month began with showers during the daytime of the 27th that continued off and on before ending late on the 29th. The north coast was the big winner during this period, with multi-day totals of 2.68” and 2.54” at two Wall Township locations, 2.26” at both Ocean Township (Monmouth) and Brick, Neptune City 2.24”, Bradley Beach (Monmouth) 2.17”, and Long Branch 2.06” (Figure 4). Seventeen of a total of 267 CoCoRaHS stations came in with 1.00–2.04” and 104 saw 0.50”–0.99”.
The highest barometric pressures for the month were from 30.45”–30.50” on the 4th. The lowest pressures from 29.75”–29.80” on the 7th.
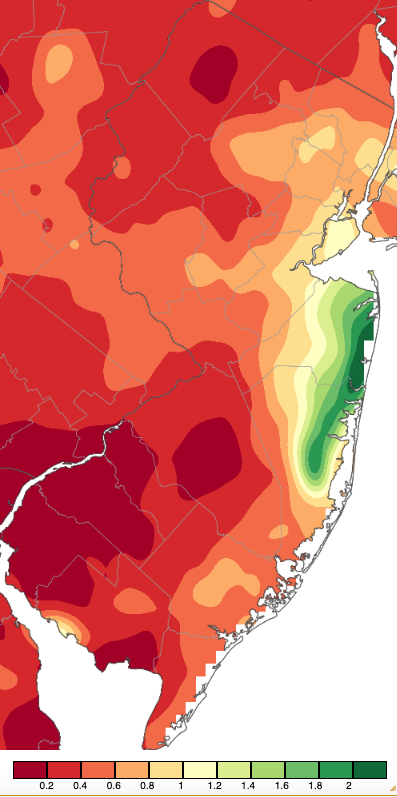
Figure 4. Precipitation across New Jersey from 8 AM on September 27th through 8 AM September 30th based on a PRISM (Oregon State University) analysis generated using NWS Cooperative, CoCoRaHS, NJWxNet, and other professional weather station observations. Note the scale in inches beneath the map.
The US Drought Monitor weekly map mostly covering the last week of September (Figure 5; data valid October 1st) indicates a portion of the Pinelands over to the central coast classified as Moderate Drought (D1), conditions having an expected recurrence interval of approximately 6–10 years. Much of the remainder of the state is classified as Abnormally Dry (D0), conditions expected approximately every 3–5 years.
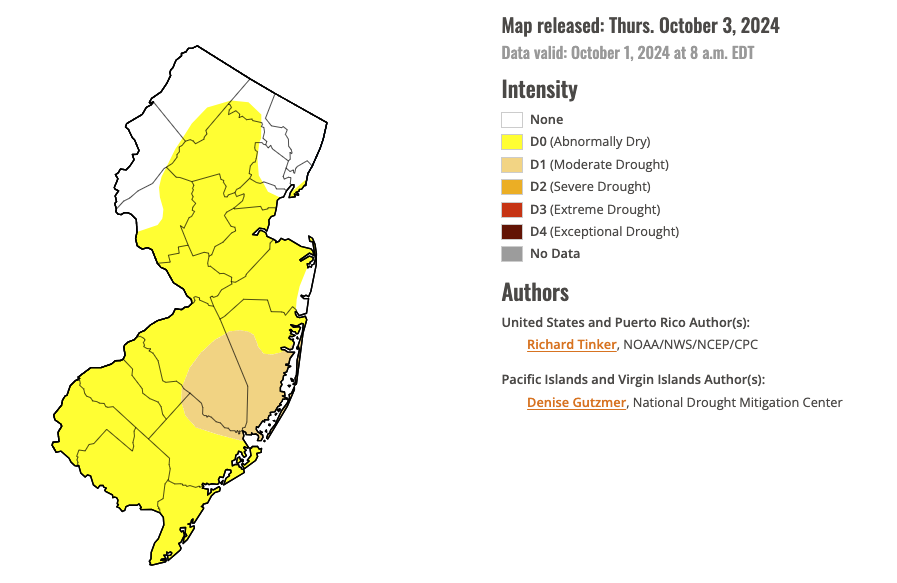
Figure 5. U.S. Drought Monitor map of conditions in NJ as of October 1, 2024.
Temperature
While there was nothing tremendously notable or dramatic with September temperatures throughout the Garden State, the month did manage to see ten days where one or more NJWxNet station reached a maximum of at least 85° and ten days when low temperatures fell to 45° or cooler. On the warm side, just as occurred this past August, the first day of the month had the warmest highs. Lower Alloways Creek Township reached 90°, and 42 of the 68 NJWxNet stations reached 85°–89° (Figure 6). Vernon Township only managed to make it to 76°. Little Egg Harbor Township (Ocean) rose to 85° on the 2nd. It was not until the 11th that Lower Alloway Creek Township and Piney Hollow made it to 87°, with four sites at 85° or 86°. Piney Hollow, Red Lion (Burlington), and Moorestown (Burlington) reached 85° on the 12th. The next day, Piney Hollow and Red Lion hit 87°, with 13 stations either 85° or 86°. The 14th saw four stations reach 88° and 26 stations rise to 85°–87°. Piney Hollow hit 85° on the 15th. The 19th found Mannington (Salem) and South Harrison (Gloucester) registering 87° highs and 20 sites reaching 85°–86°. Lower Alloways Creek Township hit 89° and two locations 85° on the 20th. Cape May Court House (Cape May) was alone at 85° on the 28th when the farthest northern station at High Point Monument (Sussex) only managed a 62° high.
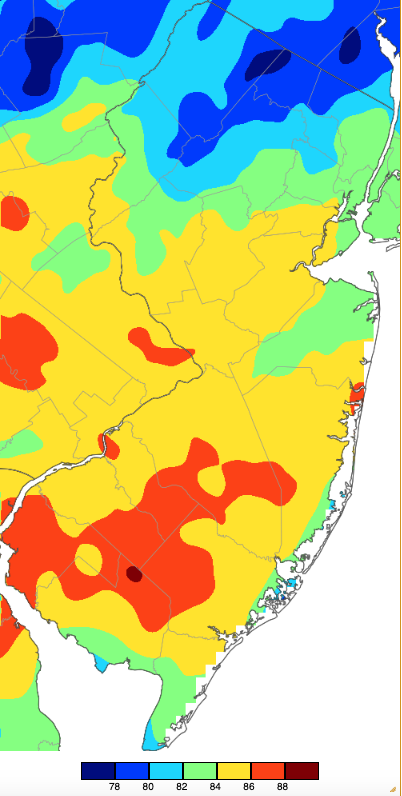
Figure 6. Maximum temperatures on September 1st based on a PRISM (Oregon State University) analysis generated using NWS, NJWxNet, and other professional weather stations. Note the 2° scale beneath the map.
Following the warm first two days of September, the 3rd–11th saw a run of seven out of eight days with low temperatures at or under 45°. Walpack dropped to 40° on the 3rd, with eight stations from 43°–45°. Berkeley Township (Ocean), Pequest (Warren), and Kingwood (Hunterdon) all fell to 42° on the 4th, with 13 other NJWxNet stations from 43°–45°. Pequest was again at 42° on the 5th and Sandyston 45° on the 6th. Hopewell Township (Mercer), Sandyston, and Walpack were 42° on the 8th.
The 9th was the coolest for the month with Oswego Lake (Burlington), Sandyston, and Walpack all at 38°, four stations 39°, and 28 from 40°–45° (Figure 7). Atlantic City Marina (Atlantic) at 57° was mildest that day. Hopewell Township fell to 45° on the 10th. Sandyston reached 43° on the 11th with four stations 44°–45°. Rounding out the cool mornings, Kingwood and Basking Ridge (Somerset) dropped to 45° on the 14th and Walpack sat alone at 43° on the 15th.
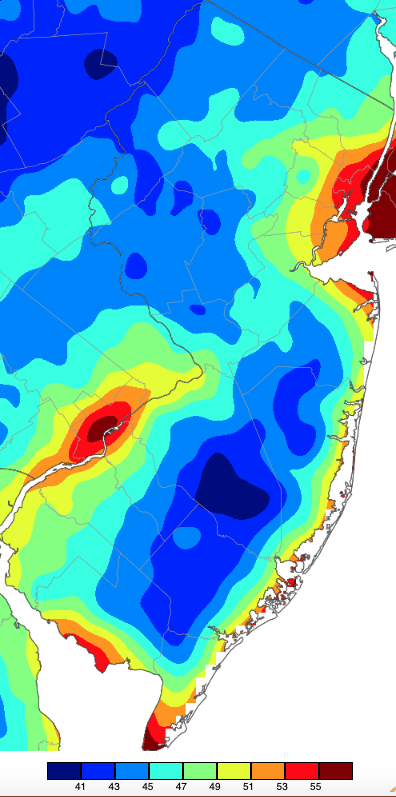
Figure 7. Minimum temperatures on September 9th based on a PRISM (Oregon State University) analysis generated using NWS, NJWxNet, and other professional weather stations.
For those seeking more detailed information on 5-minute, hourly, daily, and monthly conditions, please visit the following Office of the NJ State Climatologist's websites:
Rutgers NJ Weather Network
NJ Community Collaborative Rain, Hail and Snow Network
NJ Snow Event Reports
Interested in receiving our monthly summaries at the end of each month? Send us your e-mail address here to join the mailing list.
Past News Stories

