Pretty Darn Boring: January 2021 Recap
New Jersey State Climatologist
Center for Environmental Prediction, School of Environmental and Biological Sciences/NJAES, Rutgers University
February 9, 2021
Overview
The first month of 2021 lacked major storms, whether wet or white, and temperatures rarely were either quite mild or very cold. Thus the title of this report. Yes, the last day of the month turned snowy, the harbinger of anything but a boring start to February, but that’s to be covered next month. The January statewide average temperature was 33.7°. This was 3.0° above the 1981–2010 normal and ranks as the 26th mildest January in the past 127 years. The average high was 41.1°, which is 1.8° above normal and ranks 34th mildest, while the average low of 26.3° was 4.2° above normal, ranking 20th mildest.
January precipitation (rain and melted snow) averaged 1.99” across the state, which is 1.41” below normal and ranks 13th driest since 1895. The north averaged 1.93” (-1.48”, 18th driest), the south 2.02” (-1.37”, 13th driest), and the coast 2.19” (-1.25”, 17th driest). Generally, the eastern half of the state was wetter (particularly the northeast) than the west (Figure 1).
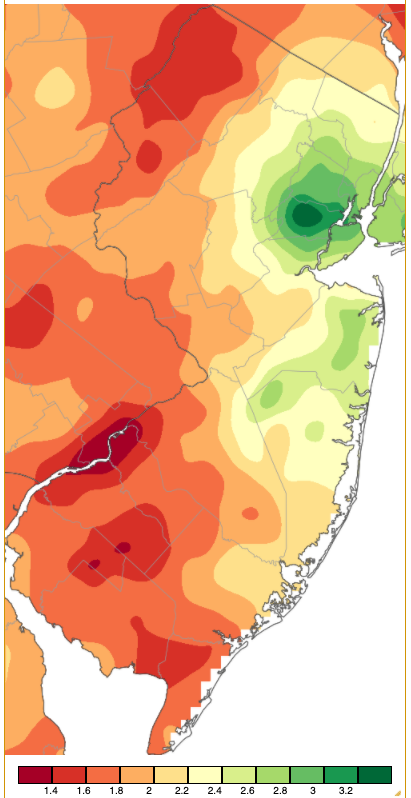
Figure 1. January 2021 precipitation across New Jersey based on a PRISM (Oregon State University) analysis generated using NWS Cooperative and CoCoRaHS observations from 7 AM on December 31st to 7 AM on January 31st. Totals range from 1.40”–1.50” (red) to 3.20”–3.40” (dark green).
| Rank | Year | January Precip. |
|---|---|---|
| 1 | 1981 | 0.54" |
| 2 | 1955 | 0.63" |
| 3 | 1970 | 0.95" |
| 4 | 1967 | 1.33" |
| 5 | 1985 | 1.40" |
| 6 | 1916 | 1.53" |
| 7 | 1896 | 1.61" |
| 8 | 1992 | 1.76" |
| 9 | 1946 | 1.78" |
| 10 | 1940 | 1.84" |
| 11 | 1957 | 1.92" |
| 12 | 2004 | 1.98" |
| 13 | 2021 | 1.99" |
| 13 | 1954 | 1.99" |
| 15 | 1989 | 2.02" |
| 15 | 1969 | 2.02" |
| 17 | 1931 | 2.04" |
| 18 | 2008 | 2.06" |
| 19 | 1989 | 2.12" |
| 20 | 2002 | 2.21" |
Table 1. The 20 driest Januarys across New Jersey since 1895.
Snowfall was quite meager, with the statewide average of 0.9” being 6.2” below average. This ranks as the 6th least snowy January since 1895 (tied with two other years) and the least snowy since 1995. The north saw the most, averaging 2.3”, but having the largest deficit at -7.0”. The central region saw 0.8” (-6.9”) and the south 0.3” (-5.3”).
Temperature
There were six January days where the temperature at one or more Rutgers NJ Weather Network stations topped out at 50°. West Cape May (Cape May County) started off the year with a high of 50° on the 1st. The 2nd was the mildest day of the month, with Atlantic City Marina (Atlantic), Dennis Township (Cape May), and Woodbine (Cape May) up to 57°, and 47 of the 63 NJWxNet stations ranged from 50°–56°. High Point Monument (HPM; Sussex) only made it to 39° for the coolest high in the state.
The middle of the month found Oswego Lake (Burlington) reaching 55° and 35 stations from 50°–54° on the 14th. Vineland (Cumberland) hit 57°, Mannington (Salem), Piney Hollow (Gloucester), and West Deptford (Gloucester) 56°, and 33 stations from 50°–55°. HPM only reached 35°. The 16th brought the temperature up to 53° in Point Pleasant (Ocean), and 52° at both Toms River (Ocean) and West Creek (Ocean). Egg Harbor Township (Atlantic) and West Creek hit 51° on the 21st.
Thirteen January days saw the thermometer dip to 15° of lower at one or more NJWxNet sites. In some cases, HPM was the coldest location, generally an indication of cold air moving (advecting) swiftly into the state from parts north. Other cold days when skies were clear and winds calm found valley locations, led by Walpack (Sussex), registering the coldest lows due to cold air drainage. Examples of the interesting regional and temporal variations within NJ’s climate regime!
Walpack fell to 15° on the 1st and the 8th. HPM led the way with 12° on the 12th, along with High Point (Sussex; several hundred feet lower than HPM) at 14° and Vernon (Sussex) 15°. Walpack and Berkeley Township (Ocean) fell to 13° on the 11th, with Walpack at 11°, and Pequest (Warren) and Sandyston (Sussex) each at 12° on the 12th.
Cold returned on the 21st with Walpack down to 11° and 12 WxNet stations between 12°–15°. HPM was 14° on the 23rd and 11° on the 24th, joined on the latter day by High Point at 12° and Vernon 13°. A mix of high and low elevation sites fell to 11° on the 25th, including HPM, Sandyston, and Walpack.
Cold air invaded the state on the 28th, with HPM down to 10° and five stations from 12°–15°. Brutal wind chills accompanied the cold on the 29th. HPM fell to 3° and at 7:30 AM with that minimum and a gust of 50 mph the wind chill sat at -27°. That morning, High Point and Vernon reached 5°, Sandyston and Wantage (Sussex) 7°, Charlotteburg (Passaic) 8°, and 10 other sites from 10°–15°. With the absence of wind, the 30th was the coldest January day, with Walpack down to 1°, Pequest and HPM 5°, eleven stations from 7°–10°, and 32 sites from 11°–15°. Logan Township (Gloucester) at 20° had the least cold minimum in the NJWxNet. Finally, HPM and Walpack each reached 6° on the 31st, with 15 stations from 7°–15°.
An interesting illustration of the impact sky cover has on both daily maximum and minimum temperatures occurred on the 13th. In the morning, colder temperatures were observed in the southern half of the state compared to the north (Figure 2). This was due to skies being clear in the south allowing the atmosphere to cool more than in the north, where clouds acted like a blanket, retaining some of the milder air of the previous day (Figure 3).
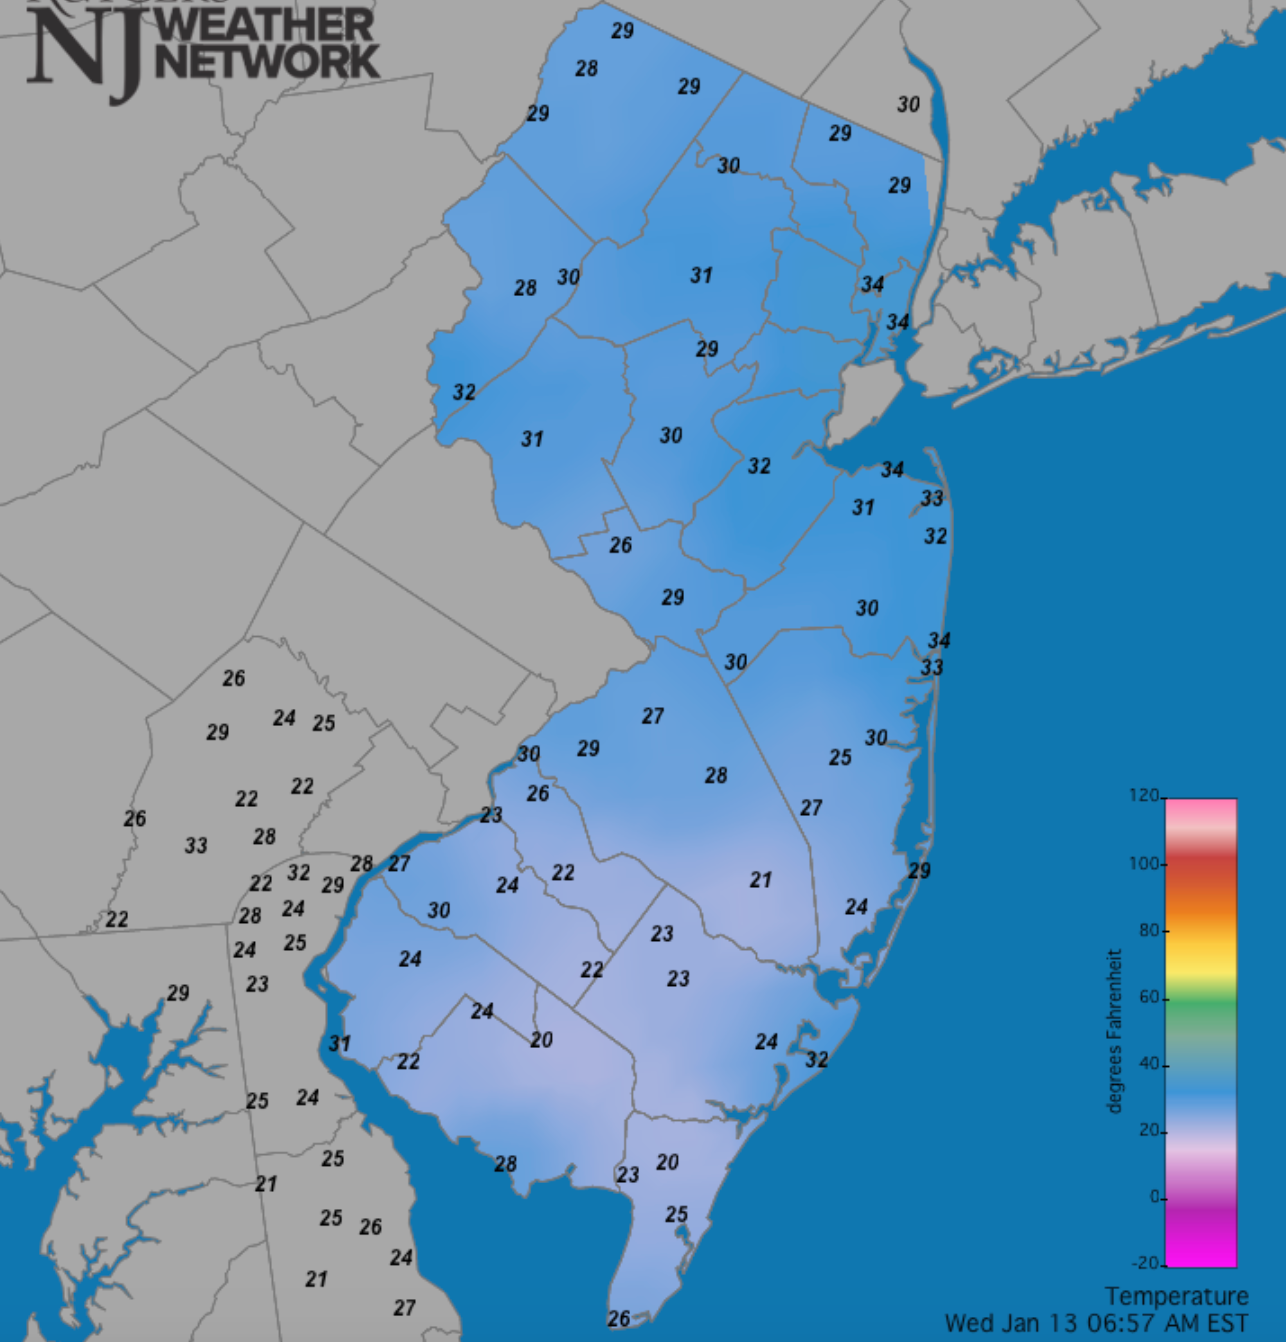
Figure 2. Temperatures at 6:57 AM on January 13th. Reports are from the NJWxNet.
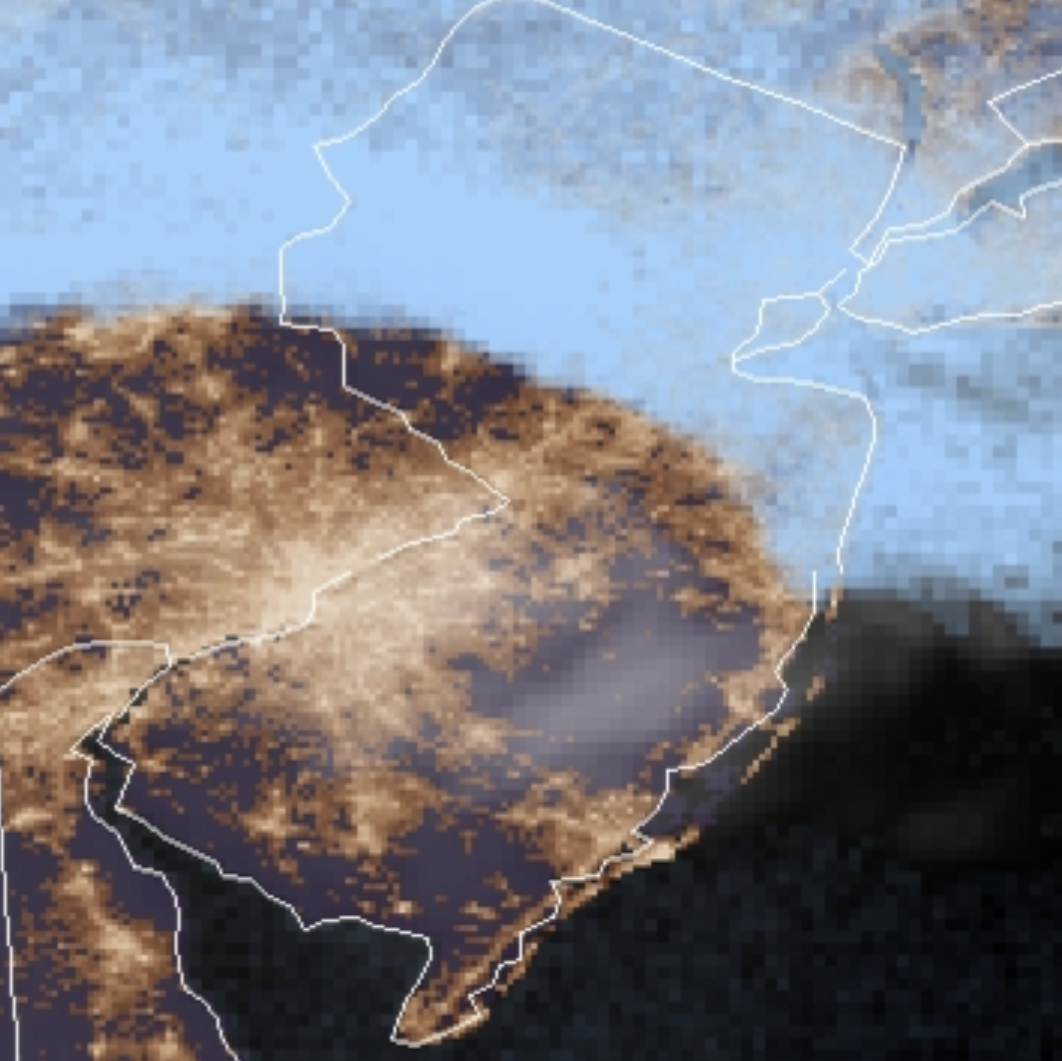
Figure 3. NOAA satellite image at 6:51 AM on January 13th.
This cloud/clear pattern continued into the afternoon, as seen in a visible satellite image (Figure 4) and NJWxNet solar radiation observations (Figure 5). Sunny conditions warmed things up in the south while the north stayed on the cool side (Figure 6).
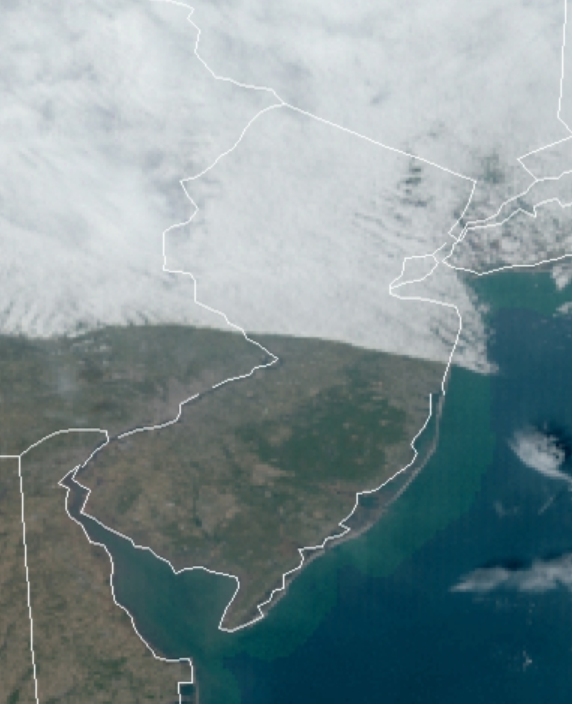
Figure 4. NOAA satellite image at 2:00 PM on January 13th.
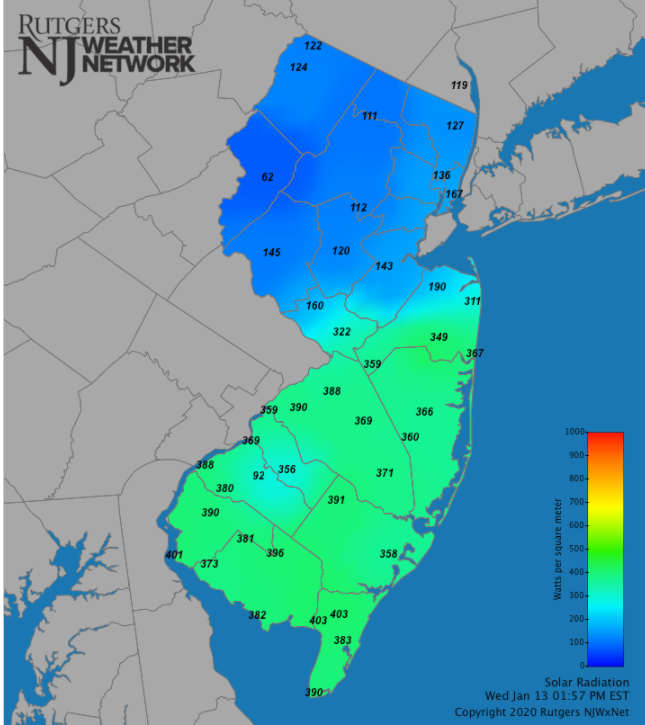
Figure 5. Solar radiation reaching the surface at 1:57 PM on January 13th. Reports are from the NJWxNet.
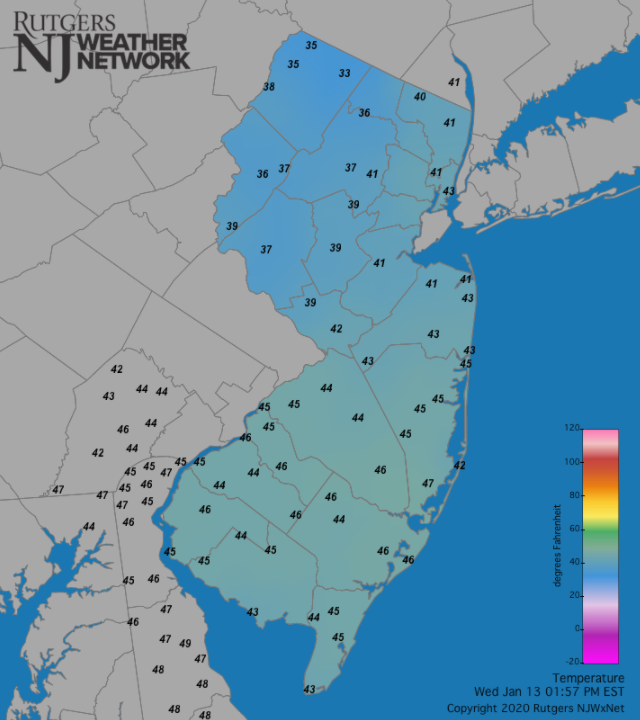
Figure 6. Temperatures at 1:57 PM on January 13th. Reports are from the NJWxNet.
Precipitation and Storms
Monthly precipitation (rain and melted snow) at NJ CoCoRaHS stations across the state exhibited commonly observed monthly variations. Cranford (Union) was in the sweet spot for January precipitation, totaling 4.37”. Next, but rather far behind, were nearby stations, including Woodbridge (Middlesex) at 3.22”, Westfield (Union) 3.13”, Springfield (Union) 3.17”, Kearny (Hudson) 3.10”, Chatham (Morris) 3.06”, and Montclair (Essex) 3.05”. On the low end for the month was Franklin Township (Gloucester) with 1.35”, followed by Monroe Township (Gloucester) and Franklin (Sussex) at 1.41”, Gloucester City (Camden) and Montague (Sussex) both with 1.42”, Winslow Township (Camden) 1.46”, and Moorestown (Burlington) 1.47”.
The most January snowfall was received at Stillwater (Sussex) with 4.4”, followed by Montague with 4.3”, Rockaway Township (Morris) and Wantage each with 3.6”, and two Jefferson Township (Morris) sites with 3.3” and 3.1”.
The first precipitation event of the month began during the afternoon of the 1st and lasted until the predawn hours of the 2nd. Aside from a bit of freezing rain at higher elevations in the north, it was a rain event. Southampton Township (Burlington) took top honors with 1.14”, followed by 1.12” in Deerfield Township (Cumberland), and Pine Beach (Ocean) and Berkeley Township each with 1.11” (Figure 7). An impressive 225 CoCoRaHS stations were between 0.50”–1.14”, with Vernon (0.28”) at the low end of 16 stations ranging up to 0.49”.
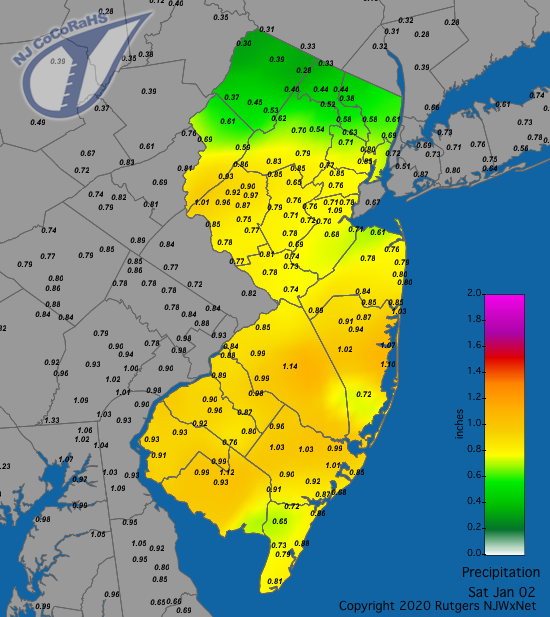
Figure 7. Rainfall from approximately 7 AM on 1st to 7 AM on January 2nd. Reports are from CoCoRaHS observers.
The next event arrived on the morning of the 3rd and lasted into the early morning hours of the 4th. It was a rain event in the south, one that went from a bit of snow and sleet to rain in central and northeastern regions, while depositing, at best, several inches of snow in the northwest. Ventnor City (Atlantic) was wettest with 0.73”, followed by Ocean Township (Monmouth) at 0.70” and Wildwood Crest (Cape May) 0.69”. Both Vernon and Wantage caught 3.5” of snow, followed by Rockaway at 2.0”.
Upwards of half or more of the month’s precipitation at some locations was received in a rain event from the afternoon of the 15th until about dawn on the 16th. Some freezing rain fell at high elevations in the north. Cranford saw 1.91” accumulate, with Springfield at 1.85”, Westfield 1.72”, and Livingston (Essex) 1.71” (Figure 8). Of the 259 CoCoRaHS reports, 58 came in from 1.00”–1.60” and 101 from 0.50”–0.99”.
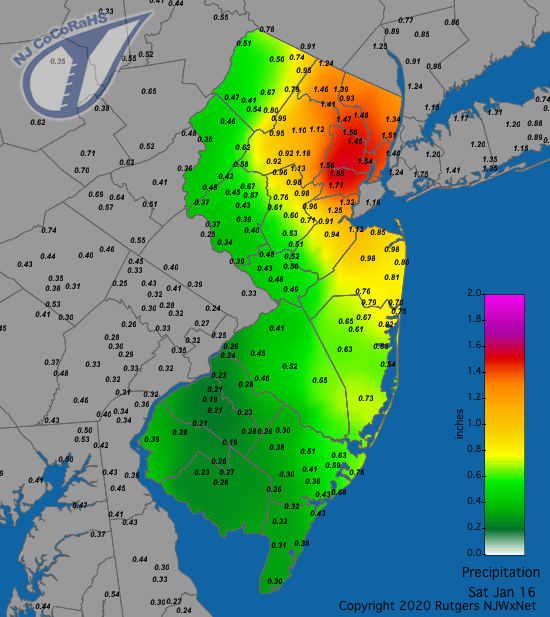
Figure 8. Rainfall from approximately 7 AM on January 15th to 7 AM on January 16th. Reports are from CoCoRaHS observers.
The 26th saw some rain and snow falling across the entire state. Totals were on the light side, with rain or rain and melted snow amounting to no more than 0.39” in Newton (Sussex), and 0.34” at both Eatontown (Monmouth) and Ocean Township (Monmouth). Top snow totals were 2.0” at both Oakland (Bergen) and Hawthorne (Passaic).
The highest barometric pressures of the month were in the 30.45”–30.55” range on the 1st. The lowest pressures of 29.35”–29.45” resulted from the storm early on the 16th.
Winds gusted to 40 mph or greater at one or more NJWxNet locations on twelve January days, with HPM at or near the top of the list on all but two times. HPM gusted to 52 mph on the 2nd, with Vernon at 48 mph and Wantage 40 mph. The 6th found HPM at 41 mph and Wantage 41 mph. These two sites came in with, respectively, 46 mph and 42 mph gusts on the 7th. HPM reached 45 mph on the 9th. Vernon topped the list at 46 mph on the 15th, followed by Pittstown (Hunterdon) at 41 mph. HPM topped out at 44 mph on the 17th. Columbus (Burlington) and Lower Alloways Creek Township (LACT; Salem) gusted to 44 mph on the 20th, with HPM and Vernon at 42 mph, and Seaside Heights (Ocean) and Pennsauken (Camden) 41 mph. HPM gusted to 52 mph on the 23rd, followed by Vernon 49 mph, Harvey Cedars (Ocean) 42 mph, LACT 41 mph, and Fortescue (Cumberland) 40 mph. HPM hit 52 mph and Vernon 42 mph on the 24th. Winds howled to 62 mph at HPM on the 28th, with Vernon 49 mph, and seven stations from 40–44 mph. The 29th was the windiest day of the month by far, with HPM up to 64 mph, Vernon 53 mph, Harvey Cedars 51 mph, Seaside Heights and LACT 50 mph, and 20 stations gusting from 40–49 mph. The 31st saw gusts up to 43 mph at Harvey Cedars and 40 mph at both Seaside Heights and Atlantic City Marina.
For those seeking more detailed information on 5-minute, hourly, daily, and monthly conditions, please visit the following Office of the NJ State Climatologist's websites:
Rutgers NJ Weather Network
NJ Community Collaborative Rain, Hail and Snow Network
NJ Snow Event Reports
Interested in receiving our monthly summaries at the end of each month? Send us your e-mail address here to join the mailing list.
Past News Stories

