Oh, What A Relief It Is: May and Spring 2025 Recaps
New Jersey State Climatologist
NJ Agricultural Experiment Station
Rutgers University
June 5, 2025
May Overview
It took a frustratingly long time for the cool season “recharge” of New Jersey’s water resources to get well underway. Following a record dry fall 2024, December through April precipitation remained below normal, including the third driest January of the past 131 years. However, February, March, and April precipitation totals were only a bit below normal, so while precipitation deficits were not recovering, they did not worsen, and reservoirs began to fill. Then along came May, with near record-high precipitation; just in time to bring most water resources up to normal heading into summer. Yes, quite a relief! The only cautionary note regards groundwater deficits that remain at some locations in the sandy substrate of south Jersey. This impacts local streamflow as well once runoff from any recent rains has diminished, leaving the streams fed by depleted spring waters. Thus, the NJ Department of Environmental Protection has not lifted the drought warning that was established in mid-November 2024.
As for May, the statewide average precipitation was 7.27”. This was 3.52” above the 1991–2020 normal and ranks as the 5th wettest May since statewide records became established in 1895 (Table 1). It is the wettest May since 1990, and the fifth May this century to fall into the top 25 (three have been in the driest 25). The northern climate division averaged 8.18” (+4.16”, 5th wettest), the southern division 6.78” (+3.18”, 8th wettest), and the coastal division 6.06” (+2.55”, 11th wettest; Figure 1).
| Rank | Year | May Avg. Precip. |
| 1 | 1989 | 8.43" |
| 2 | 1948 | 8.38" |
| 3 | 1984 | 8.30" |
| 4 | 1990 | 7.62" |
| 5 | 2025 | 7.27" |
| 6 | 1947 | 7.08" |
| 7 | 1978 | 7.04" |
| 8 | 1908 | 6.88" |
| 9 | 1898 | 6.77" |
| 10 | 2019 | 6.75" |
Table 1. The 10 wettest Mays across NJ since 1895.
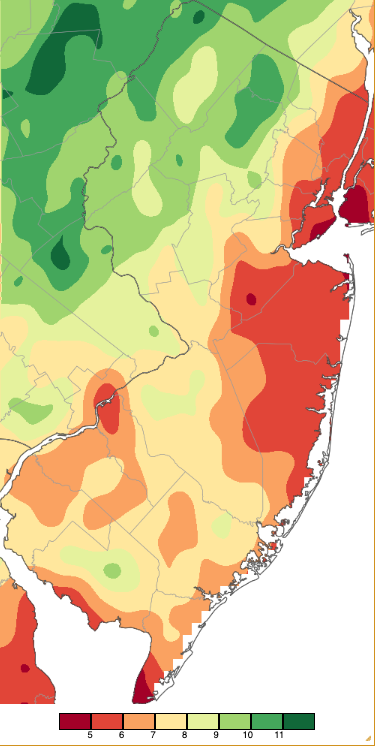
Figure 1. May 2025 precipitation across New Jersey based on a PRISM (Oregon State University) analysis generated using NWS Cooperative, CoCoRaHS, NJWxNet, and other professional weather station observations from 8 AM on April 30th to 8 AM on May 31st. Note the scale in inches at the bottom of the map. Totals range from 4.00”–4.99” (dark red) to 11.00”–11.99” (dark green).
May temperatures exhibited some notable swings, with the end of the month’s below-normal conditions just about balancing out the above-normal start. The statewide average of 62.0° was 0.8° above normal and ranks as the 30th mildest of the past 131 years. The statewide average high temperature was 71.5°, which was 0.8° below normal and ranked as the 65th warmest/66th coolest on record. Meanwhile, the 52.5° average low was 2.3° above normal, ranking as the 12th mildest. This sign disparity is the result of the frequent cloudy and wet conditions that suppressed both daytime warmth and nighttime cooling. The northern division averaged 60.2° (+0.3°, 42nd mildest), the southern division 63.2° (+1.0°, 26th mildest), and the coastal division 62.4° (+1.4°, 21st mildest).
Precipitation and Storms
With such large state and divisional precipitation totals for the month, some considerably larger local totals were to be expected. This was abundantly so in the far northwest, where Rutgers NJ Weather Network stations in Sussex County picked up 13.25” at High Point, 13.10” at Wantage, and 11.07” at High Point Monument. Elsewhere, West Milford (Passaic) came in with 12.73”, Butler (Morris) 11.59”, White Township (Warren) 11.09”, and Mount Arlington (Morris) 10.92”. Even in such a wet month, a few locations will miss out on totals greatly surpassing what is normally expected. While not all that meager, the low local totals were led by two Monroe Township (Middlesex) CoCoRaHS stations with 4.54” and 4.58”. They were followed by Brigantine (Atlantic) 4.79”, two Lower Township sites at 4.96” and 5.16”, Manasquan (Monmouth) 5.00”, Long Branch (Monmouth) 5.02”, and Toms River Township (Ocean) 5.11”.
The first rain of the month arrived on the afternoon of the 2nd in the form of some local southern thunderstorm cells that, at most, brought 0.50” to Little Egg Harbor Township (Atlantic). More meaningful rain arrived on the afternoon of the 3rd, with some scattered strong thunderstorms and a few reports of small hail. Some trees and wires were toppled in Hunterdon County that evening. Rain continued into the evening of the 4th. Heaviest totals were in central and northern areas, especially in the far northwest where, in Sussex County, Wantage caught 3.09”, High Point 3.05”, High Point Monument 2.47”, and Stillwater Township 2.22”. In Warren County, Liberty Township saw 2.37”, Belvidere 2.20”, and both White Township and Knowlton Township 2.14”. Of 259 Community Collaborative Rain, Hail, and Snow Network (CoCoRaHS) reports, eight were from 2.00”–2.37”, 11 from 1.00”–1.69”, and 85 from 0.50”–0.99”.
Showers on the afternoon of the 5th into early on the 6th moved into NJ from southeast to northwest. High Point again won out with 1.39”, followed by West Milford 1.20”, Hawthrone (Passaic) 1.10”, and Montvale (Bergen) 1.00”, with 50 stations from 0.50”–0.99”. Afternoon and evening showers on the 6th brought 1.37” to Sandyston (Sussex), including a thunderstorm that deposited hail up to approximately an inch in diameter (Figure 2). Other rain totals included Walpack (Sussex) 1.03”, Logan Township (Gloucester) 0.98”, and Wantage 0.63”. Pea-size hail was also reported in Rockaway Township (Morris).
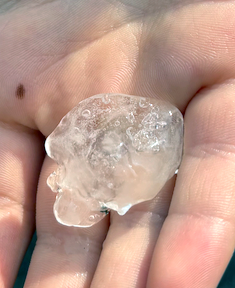
Figure 2. Hailstone gathered in Sandyston on May 6th.
As was common in May, it did not take long for rainfall to find its way back into the state. Beginning in the late afternoon of the 8th and continuing off and on into the afternoon of the 9th, substantial accumulations in the north included 2.74” and 2.56” at two Jefferson Township (Morris) locations, West Milford 2.47”, Mount Arlington 2.38”, and Butler 2.36”. Of 265 CoCoRaHS reports, 13 were from 2.00”–2.74”, 63 from 1.00”–1.99”, and 32 from 0.50”–0.99” (Figure 3).
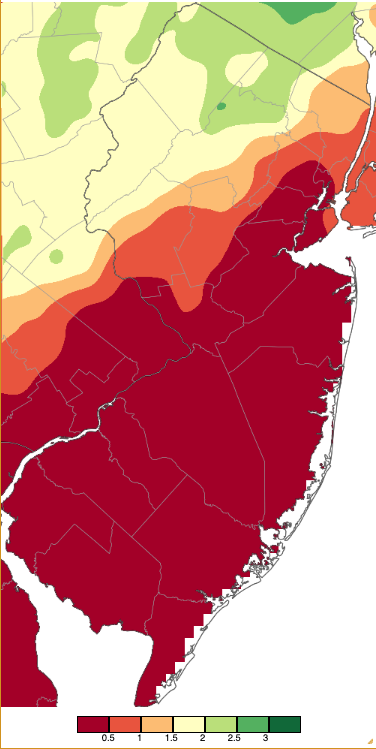
Figure 3. Precipitation across New Jersey from 8 AM on May 8th through 8 AM May 10th based on a PRISM (Oregon State University) analysis generated using NWS Cooperative, CoCoRaHS, NJWxNet, and other professional weather station observations. Note the scale in inches at the bottom of the map.
As the far north dried out a bit, the central half of NJ caught the most rain in an event that began with morning showers on the 13th, continued with off and on rain during the afternoon and evening, and finished with steady rain during the first half of the 14th into the afternoon. All told, as much as 3.52” fell in Riverside Township (Burlington), Willingboro Township (Burlington) 3.51”, Chatham (Morris) 3.45”, New Providence (Union) 3.37”, and both Princeton (Mercer) and Westfield (Union) 3.32” (Figure 4). Of 279 reports, 20 were from 3.00”–3.52”, 96 from 2.00”–2.99”, and 142 from 1.00”-1.99”. Two Lower Township gauges caught the least with 0.56” and 0.63”.
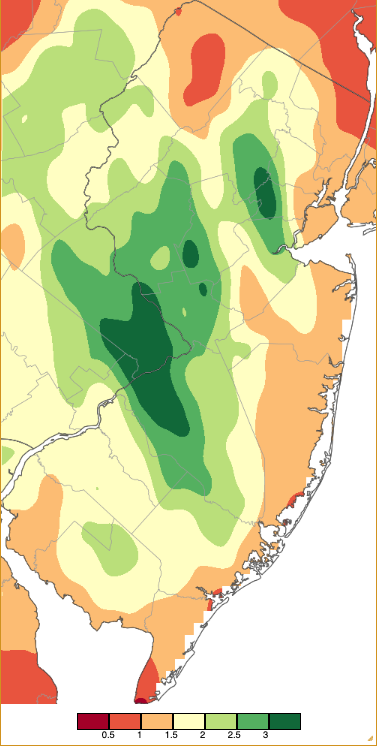
Figure 4. Precipitation across New Jersey from 8 AM on May 12th through 8 AM May 14th based on a PRISM (Oregon State University) analysis generated using NWS Cooperative, CoCoRaHS, NJWxNet, and other professional weather station observations.
Scattered showers and thundershowers during the afternoon of the 15th generated a 1.58” total in Southampton Township (Burlington), Hamilton Township (Atlantic) 1.29”, and Maurice River Township (Cumberland) 1.10”. A line of thunderstorms raced from west to east across the entire state from late morning to mid-afternoon on the 16th. They generated totals up to 2.06” in Millville (Cumberland), Washington Township (Gloucester) 1.92”, Fairfield Township (Cumberland) 1.85”, Sewell (Gloucester) 1.74”, 1.00”–1.65” at 34 locations, and 0.50”–0.99” at 69 sites (Figure 5). One storm generated the first NJ tornado of the year. The National Weather Service rated the twister EF-1, with estimated peak winds of 90–95 mph. It originated at 12:42 PM in Williamstown (Gloucester) and traveled 8.6 miles before dissipating 11 minutes later in Collings Lake (Atlantic; Figure 6). There were no deaths or injuries reported, and damage was mostly limited to a tree on a home, downed wires, and other tree damage.
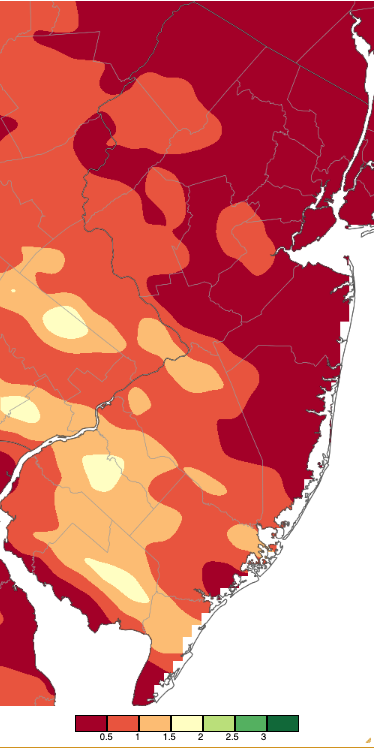
Figure 5. Precipitation across New Jersey from 8 AM on May 16th through 8 AM May 17th based on a PRISM (Oregon State University) analysis generated using NWS Cooperative, CoCoRaHS, NJWxNet, and other professional weather station observations.
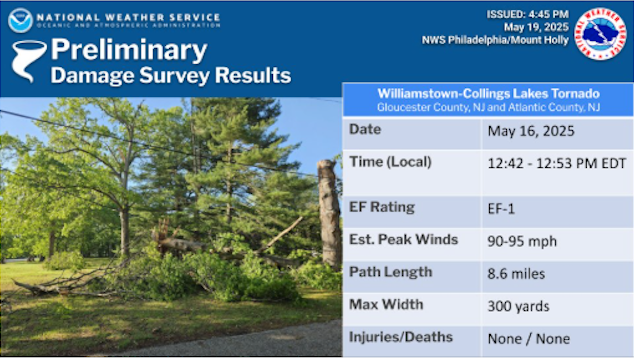
Figure 6. National Weather Service survey report for the EF-1 tornado in Gloucester and Atlantic counties on May 16th.
Pre-dawn rain on the 21st later became occasional throughout the day, became steadier during the evening and continued at a moderate intensity early on the 22nd before diminishing to light rain and drizzle through the day into early on the 23rd. Totals throughout most of NJ were quite uniform, ranging from 1.00”–1.50” (Figure 7). Upwards of 2.00” fell in some central areas. Of 270 CoCoRaHS reports, the largest was 1.90” in Washington Township (Gloucester), followed by Ringwood (Passaic) 1.87”, Warren Township (Somerset) 1.87”, Franklin Township (Hunterdon) and Stafford Township (Ocean) each 1.86”, Hopewell Township (Mercer) 1.81”, and 241 gauges from 1.00”–1.77”. Blairstown Township (Atlantic) at 0.90” received the least.
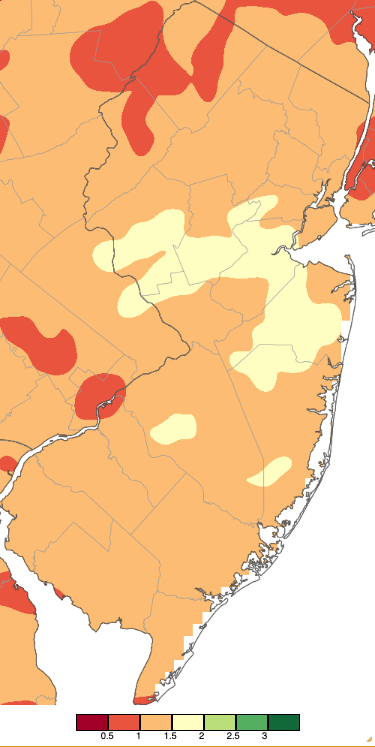
Figure 7. Precipitation across New Jersey from 8 AM on May 20th through 8 AM May 23rd based on a PRISM (Oregon State University) analysis generated using NWS Cooperative, CoCoRaHS, NJWxNet, and other professional weather station observations.
Next up was, for the first time this month, mainly a far southern event. Beginning late on the 27th, rain was moderate to heavy during most of the 28th, slowly transitioning north at lighter intensities into the pre-dawn of the 29th. Three Middle Township (Cape May) gauges caught 2.56”, 2.51”, and 2.31”, Egg Harbor Township received 2.54”, Woodbine (Cape May) 2.41”, Dennis Township (Cape May) 2.35”, and two Millville sites had 2.34” and 2.32” (Figure 8). Of 255 reports, there were 21 from 2.00”–2.56”, 40 from 1.00”–1.99” and 138 from 0.50”–0.99”.
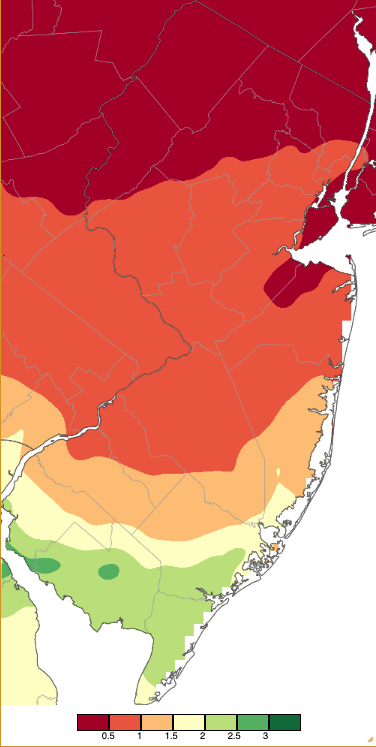
Figure 8. Precipitation across New Jersey from 8 AM on May 27th through 8 AM May 29th based on a PRISM (Oregon State University) analysis generated using NWS Cooperative, CoCoRaHS, NJWxNet, and other professional weather station observations.
Localized heavy showers fell in the far southwest early on the 30th, amounting to 1.23” at Lower Alloways Creek Township (Salem) and 0.63” in Greenwich Township (Cumberland). This preceded an influx of rain during the evening of the 30th that moved from south to north, especially impacting the western half of NJ (Figure 9). The bulk of this rainfall ended before standard post-dawn observation times for CoCoRaHS observers. Only the far northern regions saw rain into mid-morning, and some scattered local showers and thunderstorms fell in the south during the afternoon of the 31st. The afternoon rain was as much as 0.49” at Woodstown (Salem), where pea-size hail was reported, and 0.38” in Medford Township (Burlington). Considering all of this, the great majority of the rainfall shown in Figure 9 fell before the morning observation time on the 31st. Only those totals contributed to the May and spring station precipitation totals found in this report.
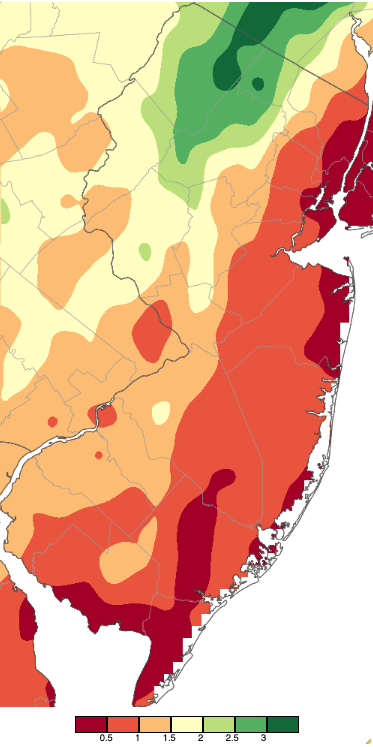
Figure 9. Precipitation across New Jersey from 8 AM on May 30th through 8 AM June 1st based on a PRISM (Oregon State University) analysis generated using NWS Cooperative, CoCoRaHS, NJWxNet, and other professional weather station observations.
By late month, the U.S. Drought Monitor reported the absence of drought throughout NJ. Still, a small area of the Highlands and a good portion of the far south were classified as being abnormally dry. This designation was mainly due to the slow recharge of groundwater in the sandy substrate of the south and a few low well levels in the north. As such, the NJ Department of Environmental Protection chose to continue with a statewide drought warning. The last drought designation (D1: moderate drought) on a weekly Drought Monitor map was found on the May 13th map. This ended a streak of D1 to D3 categorizations in at least portions (or all) of NJ that began with the weekly map of September 10, 2024.
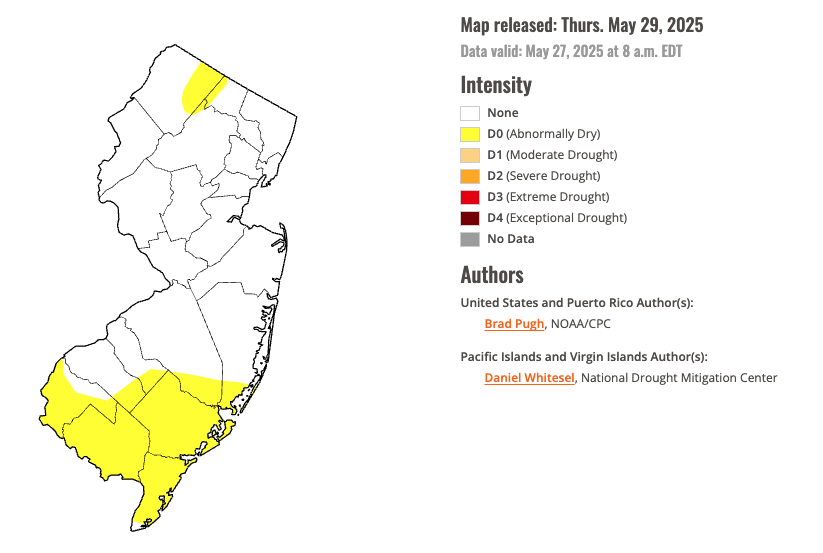
Figure 10. U.S. Drought Monitor map of conditions in NJ as of May 27, 2025.
The highest barometric pressures in May occurred on the 12th and 27th, ranging from 30.30”–30.40”. The storm on the 31st delivered pressures as low as 29.10”–29.25”. It also produced wind gusts as high as 45 mph at Fortescue (Cumberland), 44 mph in Lower Alloways Creek Township, and 40–42 mph gusts at five other NJWxNet stations. Only two other May days saw gusts exceeding 40 mph at a NJWxNet station, namely High Point Monument, with a gust to 41 mph on the 10th and 46 mph on the 19th.
Temperature
May temperatures started off in a whiplash sort of mode. The 1st brought the coldest morning of the month, only to warm up considerably that afternoon, a harbinger of things to come on the 2nd, which proved to have the warmest daytime temperatures of May. More on the low temperatures later, with a look at daily highs first. There were nine afternoons when temperatures peaked at 80° or higher at some Rutgers NJ Weather Network (NJWxNet) stations. The first of these was on the 1st with West Deptford (Gloucester) up to 81° and eight stations at 80°. A sea breeze kept Harvey Cedars (Ocean) and Point Pleasant (Ocean) highs at 60°. The 2nd found Woodland Township (Burlington) at 90°, the first time at that mark in 2025 and ultimately the only 90° May observation. Thirty-eight stations of the 69 NJWxNet stations rose to 85°–89° and 23 from 80°–84° (Figure 11). Atlantic City Marina (Atlantic) at 69° was coolest. Woodland Township made it to 89° on the 3rd, with 28 stations from 85°–88° and 26 from 80°–84°.
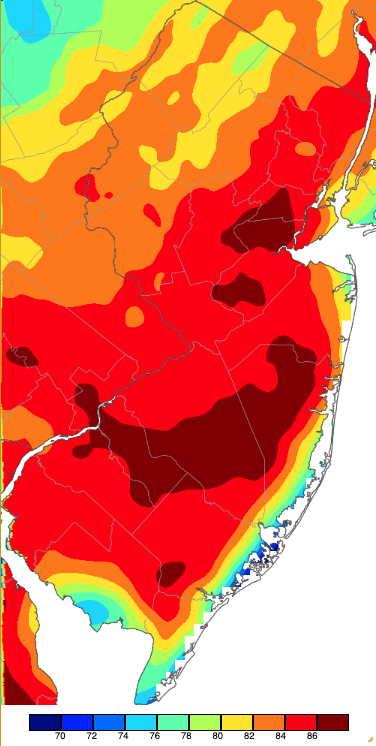
Figure 11. Maximum temperatures on May 2nd based on a PRISM (Oregon State University) analysis generated using NWS, NJWxNet, and other professional weather stations. Note the 2-degree scale beneath the map.
Piney Hollow (Gloucester) and Sewell reached 82° on the 6th, with ten stations from 80°–81°. Sewell was joined by Sicklerville (Camden) at 83° on the 8th, with 25 locations from 80°–82°. An 84° high was reached at five stations on the 11th, with 33 from 80°–83°. Six stations again rose to 84° on the 12th, with 26 from 80°–83°. The upper 80°s made a final monthly appearance on the 17th with Woodland Township at 87°, 31 stations 85°–86°, and 31 sites from 80°–84°.
Colder highs prevailed for much of the remainder of May. In fact, on the 22nd, highs were as low as 43° at High Point Monument and from 45°–50° at eleven NJWxNet stations. The highest that could be achieved was 61° at West Cape May (Cape May), reflecting conditions more likely found in late March than in mid-May. The 30th did manage to break the late-May mold, with Piney Hollow, Sandyston, and Walpack up to 81° and eight stations at 80°.
The daily low of 32° at Walpack on the 1st was accompanied by nine stations from 35°–39° and 25 from 40°–45° (Figure 12). West Cape May was mildest at 57°. Walpack rose to 78° during the afternoon. Of the seven other days where a station fell into the 30°s, Walpack was coldest or tied for that honor on five of them. This included the 11th with Walpack at 37°, two other sites 38° and 39°, and 21 stations from 40°–45°, while Fortescue only fell to 63°. Walpack was 34° on the 12th, with two other stations 36° and 39°. Walpack rose to 80° during the afternoon.
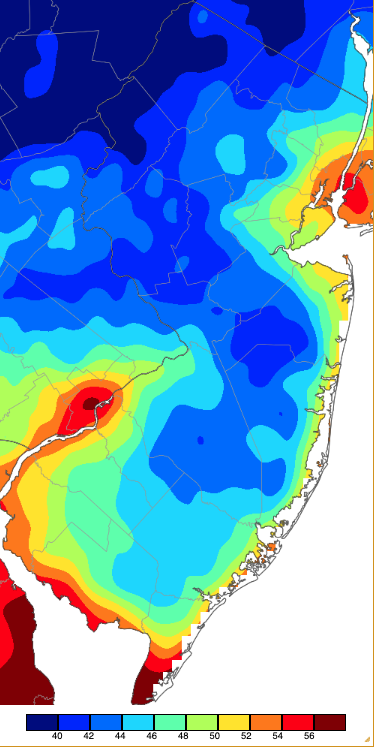
Figure 12. Minimum temperatures on May 1st based on a PRISM (Oregon State University) analysis generated using NWS, NJWxNet, and other professional weather stations.
Walpack was 37° on the 20th, with four stations 38° or 39° and 26 from 40°–45°. High Point Monument reached 39° on the 23rd and Pequest (Warren) 39° on the 24th. Sandyston and Walpack fell to 38° on the 26th, with 24 stations from 40°–45°. Walpack reached 39° on the 27th.
Spring OverviewSpring precipitation was well above normal, with the statewide average total of 14.56” coming in at 2.91” above normal and ranking 17th wettest (Figure 13). This anomaly was mostly the result of the 5th wettest May on record (+3.52”), with March (-0.36”) and April (-0.25”) falling close to normal. The Highlands and Kittatinny Ridge received the most precipitation, running as high as 20.76” at West Milford (Passaic), High Point 20.21” (Sussex), Rockaway Township 19.08”, Mount Arlington (Morris) 19.01”, Mine Hill Township (Morris) 18.90”, Boonton (Morris) 18.65”, and Denville (Morris) 18.63”. Driest, were the northeast, northern coast, and far south. Newark Liberty International Airport (Union) saw the least with 11.78”, followed by Monroe Township (Middlesex) 12.07”, Long Branch (Monmouth) 13.31”, Bound Brook (Somerset) 13.33”, Eatontown (Monmouth) 13.37”, Clark Township (Union) 13.45”, and Old Bridge Township (Middlesex) 13.48”.
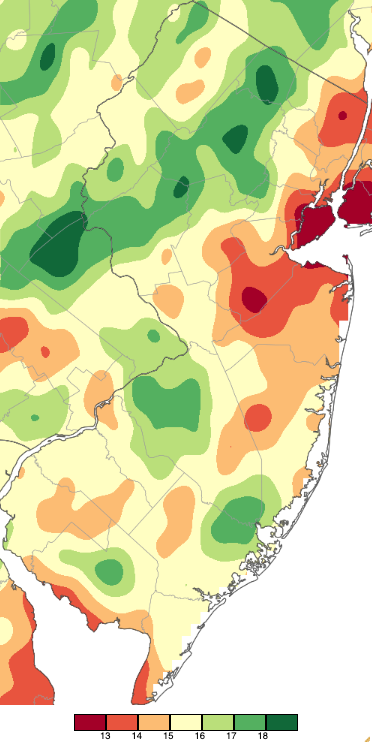
Figure 13. Spring 2025 (March 1st–May 31st) precipitation across New Jersey based on a PRISM (Oregon State University) analysis generated using NWS Cooperative and CoCoRaHS observations. Note the scale in full inches at the bottom of the map. Totals range from 12.00”–12.99” (dark red) to 18.00”–18.99” (dark green).
Statewide, spring snowfall was absent in March, averaged 0.3” in April, and was again absent in May. The northern snow division averaged 1.2” in April, with as much as 6.0” at High Point Monument on the 12th.
Spring began with all of New Jersey in either moderate, severe, or extreme drought according to the U.S. Drought Monitor. Conditions were worse in the south and in the northern Highlands, with about 23% of the state in extreme drought (Figure 14, top). Spring rains greatly reduced drought conditions, with the end of May seeing about 28% of NJ classified as abnormally dry and the rest without water concerns. In large part due to the delayed recharge of groundwater in the Pinelands, the spring ended with the state under a drought warning according to the NJ Department of Environmental Protection.
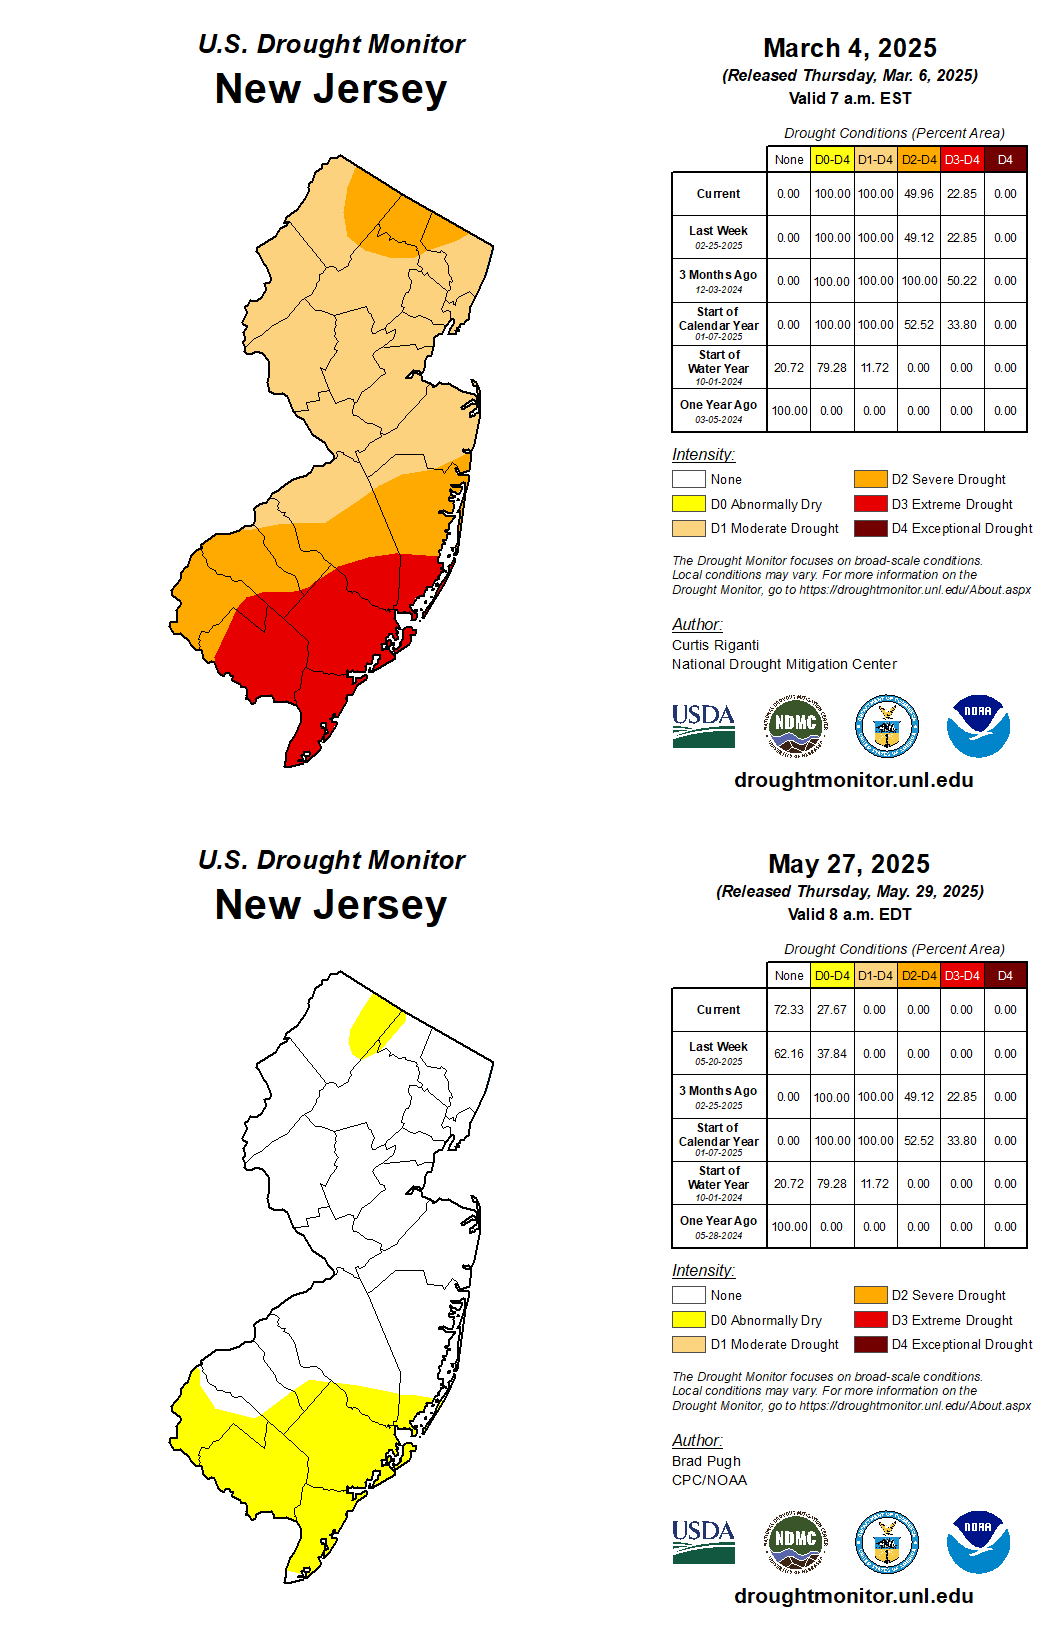
Figure 14. Top: U.S. Drought Monitor map of conditions in NJ as of March 4th, 2025. Bottom: conditions as of May 27th.
March, April, and May all came in with above-average temperatures. March was the 10th mildest since 1895, April tied with two other years for 12th mildest, and May 30th mildest. This persistence resulted in spring 2025 coming in as 6th mildest (Table 2). At 53.7°, temperatures were 2.5° above the 1991–2020 normal.
| Rank | Year | Spring Avg. Temp. |
| 1 | 2012 | 55.8° |
| 2 | 2010 | 55.2° |
| 3 | 1921 | 54.2° |
| 3 | 2024 | 54.2° |
| 5 | 1991 | 53.8° |
| 6 | 2025 | 53.7° |
| 7 | 2004 | 53.6° |
| 8 | 1945 | 53.3° |
| 9 | 1977 | 53.2° |
| 10 | 1998 | 53.0° |
Table 2. The 10 mildest springs across NJ since 1895.
The warmest spring maximum temperatures ranged from the mid to upper 80°s over much of NJ (Figure 15), except the upper 70°s and low 80°s in coastal and higher elevation locations.
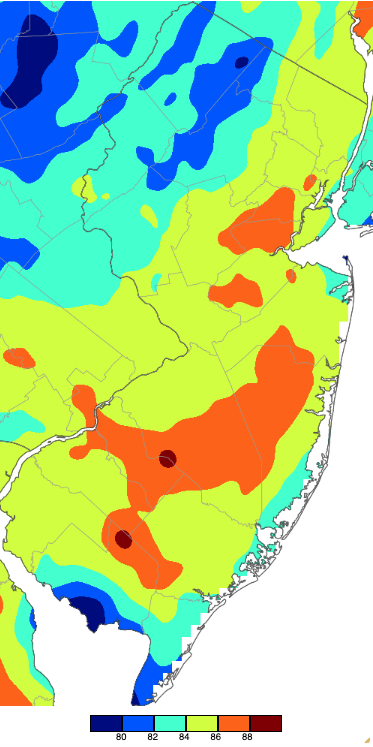
Figure 15. Extreme maximum temperatures during spring 2025 based on a PRISM (Oregon State University) analysis generated using NWS, NJWxNet, and other professional weather stations. The seasonal maximum occurred on different days at different locations.
Extreme minimum temperatures during spring ranged from the low to mid-teens to the low 20°s (Figure 16). The northwest, then moving south through west central and into the Pinelands, had the coldest minimums, with urban and coastal locations having the mildest spring minimum temperatures.
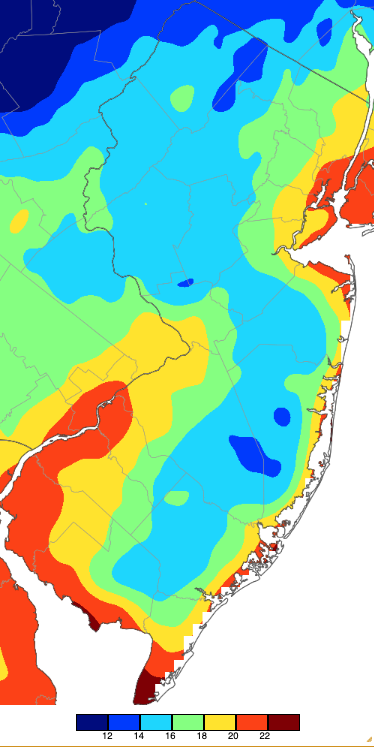
Figure 16. Extreme minimum during spring 2025 based on a PRISM (Oregon State University) analysis generated using NWS, NJWxNet, and other professional weather stations. The seasonal minimum occurred on different days at different locations.
While a surprise June freeze is not unheard of at one of NJ’s coldest spots, let’s assume for now that the state has seen its last freeze. This year, that was on May 1st at Walpack (Sussex) with a low of 32°. The first NJ freeze day last fall was on October 9th, also at Walpack (and at Sandyston [Sussex] too, where the last spring freeze was April 18th). This made for a 205-day freeze season at Walpack, which differs considerably from the shortest freeze season of 100 days at Lower Alloways Creek Township (Salem). There, the first fall freeze was on November 25th (Seaside Heights [Ocean], Harvey Cedars [Ocean], and Atlantic City Marina [Atlantic] too). The last freeze day of the season at Lower Alloways Creek Township was on March 4th (Harvey Cedars and Atlantic City Marina both had their last freeze on March 9th, with Seaside Heights on April 9th).
For those seeking more detailed information on 5-minute, hourly, daily, and monthly conditions, please visit the following Office of the NJ State Climatologist's websites:
Rutgers NJ Weather Network
NJ Community Collaborative Rain, Hail and Snow Network
NJ Snow Event Reports
Interested in receiving our monthly summaries at the end of each month? Send us your e-mail address here to join the mailing list.
Past News Stories

