Seeking Identities:
December 2022 and Annual 2022 Recaps
New Jersey State Climatologist
Center for Environmental Prediction, School of Environmental and Biological Sciences/NJAES
Rutgers University
January 6, 2023
December Overview
As has so often been the situation in 2022, December’s weather never settled into any persistent pattern. Unless, of course, a pattern of frequent variations constitutes persistence! In any case, it seems appropriate to co-label this combined monthly and annual report as intervals in search of identities!
Looking first at December, the statewide average temperature of 35.5° is 1.1° below the 1991–2020 normal. This ranks as the 44th mildest December dating back to 1895. The statewide average maximum temperature of 44.9° is 0.1° below normal and ranked 31st mildest. The average minimum was 26.1°, which is 2.1° below normal and ranks 54th mildest. North Jersey averaged 33.3° (-0.8°, 36th mildest), south Jersey 36.8° (-1.3°, 49th mildest), and the Jersey coast 37.7° (-1.4°, 50th mildest).
Statewide precipitation averaged 4.76”, which is 0.49” above normal and ranks 35th wettest. North Jersey averaged 4.93” (+0.68”, 32nd wettest), south Jersey 4.68” (+0.40”, 37th wettest), and the Jersey coast 4.49” (+0.13”, 43rd wettest). The wettest locations were in the northeast and along the northern coast, while the northwest and much of the south were on the drier side (Figure 1).
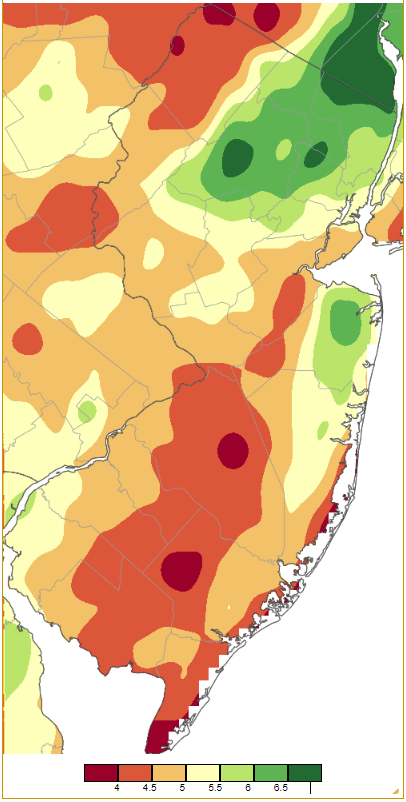
Figure 1. December 2022 precipitation across New Jersey based on a PRISM (Oregon State University) analysis generated using NWS Cooperative and CoCoRaHS observations from 7 AM on November 30th to 7 AM on December 31st. Note the scale in full inches at the bottom of the map. Totals range from 3.50”–4.00” (dark red) to 6.50”–7.00” (dark green).
December snowfall averaged 0.6” across the state, with measurable snowfall (0.1” or more) occurring in portions of the ONJSC northern and central snow divisions. Statewide, the snowfall deficit was 3.7”, ranking as the 44th least snowy December since the 1894/1895 snow season. The northern division (Warren, Morris, and Essex counties northward) averaged 2.4”. This is 3.7” below normal and ranks as the 25th least snowy December back to 1895. The central division (Hunterdon, Mercer, Somerset, Middlesex, Union, Monmouth counties) averaged 0.4”, which is 4.4” below normal and ranks 19th least snowy The southern division (Burlington and Ocean counties southward) had no measurable snow, joining 22 other Decembers in that position.
Precipitation and Storms
There was an over two-fold difference in December precipitation between the wettest and driest NJ locations based on CoCoRaHS and NJWxNet observations. Mine Hill Township (Morris County) received the most with 7.43” of rain and melted snow. Runners up include Red Bank (Monmouth) at 7.31”, Roxbury Township (Morris) 7.28”, Randolph Township (Morris) 7.06”, and Verona (Essex) 6.89”. West Cape May (Cape May) was the driest location, receiving 2.85”. It was considerably drier than the next driest location, that being Sea Isle City (Cape May) with 3.77”, followed by Buena Vista (Atlantic) 3.81”, New Brunswick (Middlesex) 3.82” (also 3.94” at a second station), and Lower Township (Cape May) and Ventnor (Atlantic) each at 3.94”.
Monthly snowfall totaled as much as 10.7” in Vernon Township (Sussex), with Wantage (Sussex) at 8.7”, Sparta (Sussex) 6.4”, Frelinghuysen Township (Warren) 5.9”, and two Jefferson Township (Morris) sites with 5.8” and 5.3”.
The first precipitation event of the month actually occurred during the afternoon and evening of November 30th. As mentioned in these reports many times in the past, precipitation observations from CoCoRaHS and NWS Cooperative volunteers are almost always taken close to 7–8 AM. Convention is that once a daily observation is taken, the next day begins. Thus, the rain that fell later on the 30th was recorded at observation time on December 1st. As you will see at the end of this section of the report, rain that fell after observation time on December 31st will be recorded as January 1st precipitation, and of course included in 2023 totals! A small “price to pay” when the benefits of having such dedicated citizen scientist participants are enormous!
In any case, the 30th rain amounted to as much as 1.09” in both Montclair (Essex) and Mine Hill Township, with 15 CoCoRaHS stations registering from 1.00”–1.09” and 175 of the 261 CoCoRaHS observers reporting 0.50”–0.99”. Behind this storm, winds on the 1st gusted to 49 mph at High Point Monument (HPM; Sussex), 46 mph in Seaside Heights (Ocean), and 40–41 mph at six other NJWxNet stations. Next up was rain from predawn into the afternoon of the 3rd. The top total was 0.72” at both Middlesex (Middlesex) and Roxbury, with White Township (Warren) 0.71”. Winds gusted to 44 mph at Atlantic City Marina (Atlantic) and 40–42 mph at three other stations.
Light rain commenced on the morning of the 6th, becoming steady and moderate during the second half of the day before tapering off to light rain and drizzle during the morning of the 7th. The most rain fell from Warren and Hunterdon counties northeast to Bergen and Hudson counties (Figure 2). Peapack-Gladstone (Somerset) received the most with 1.72”, followed by Harding Township (Morris) 1.69”, Mendham (Morris) 1.65”, and 1.63” at both Morris and Chester townships in Morris County. 88 stations caught 1.00”–1.72”, with 111 from 0.50”–0.99”.
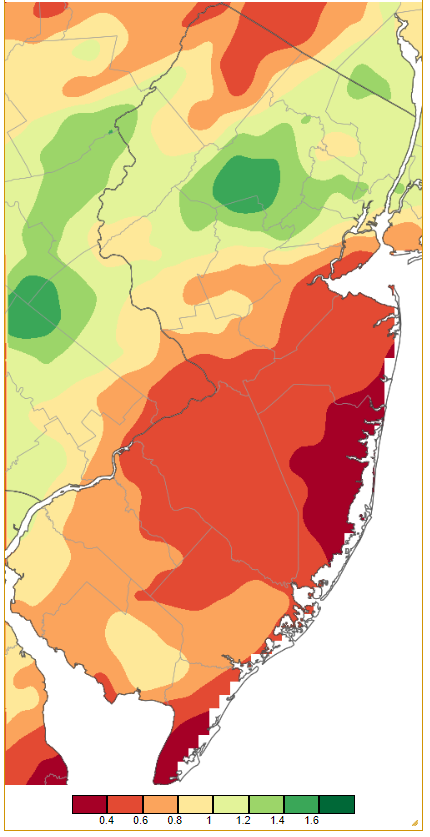
Figure 2. Precipitation across New Jersey from 7 AM on December 6th through 7 AM December 7th based on a PRISM (Oregon State University) analysis generated using NWS Cooperative and CoCoRaHS observations. Note the scale in inches beneath the map.
Snow entered the equation for the next event. Scattered flurries fell in central and northern NJ on the morning of the 11th. Most areas changed over to light to moderate rain during the afternoon and evening while some of the north saw up to several inches of snow accumulate (Figure 3). Rainfall totaled as much as 1.33” in Red Bank, Long Branch (Monmouth) 1.02”, and Neptune (Monmouth) 1.01”, although most locations in the state saw under 0.40”. Measurable snowfall was observed at locations in nine northern counties, accumulating to 1.0” or more in six counties, with those same ones also having at least one report of 2.0” or more. Montague (Sussex) topped the list with 3.8”, followed by 3.6” at Highland Lakes (Sussex) and 3.4” in Wantage.
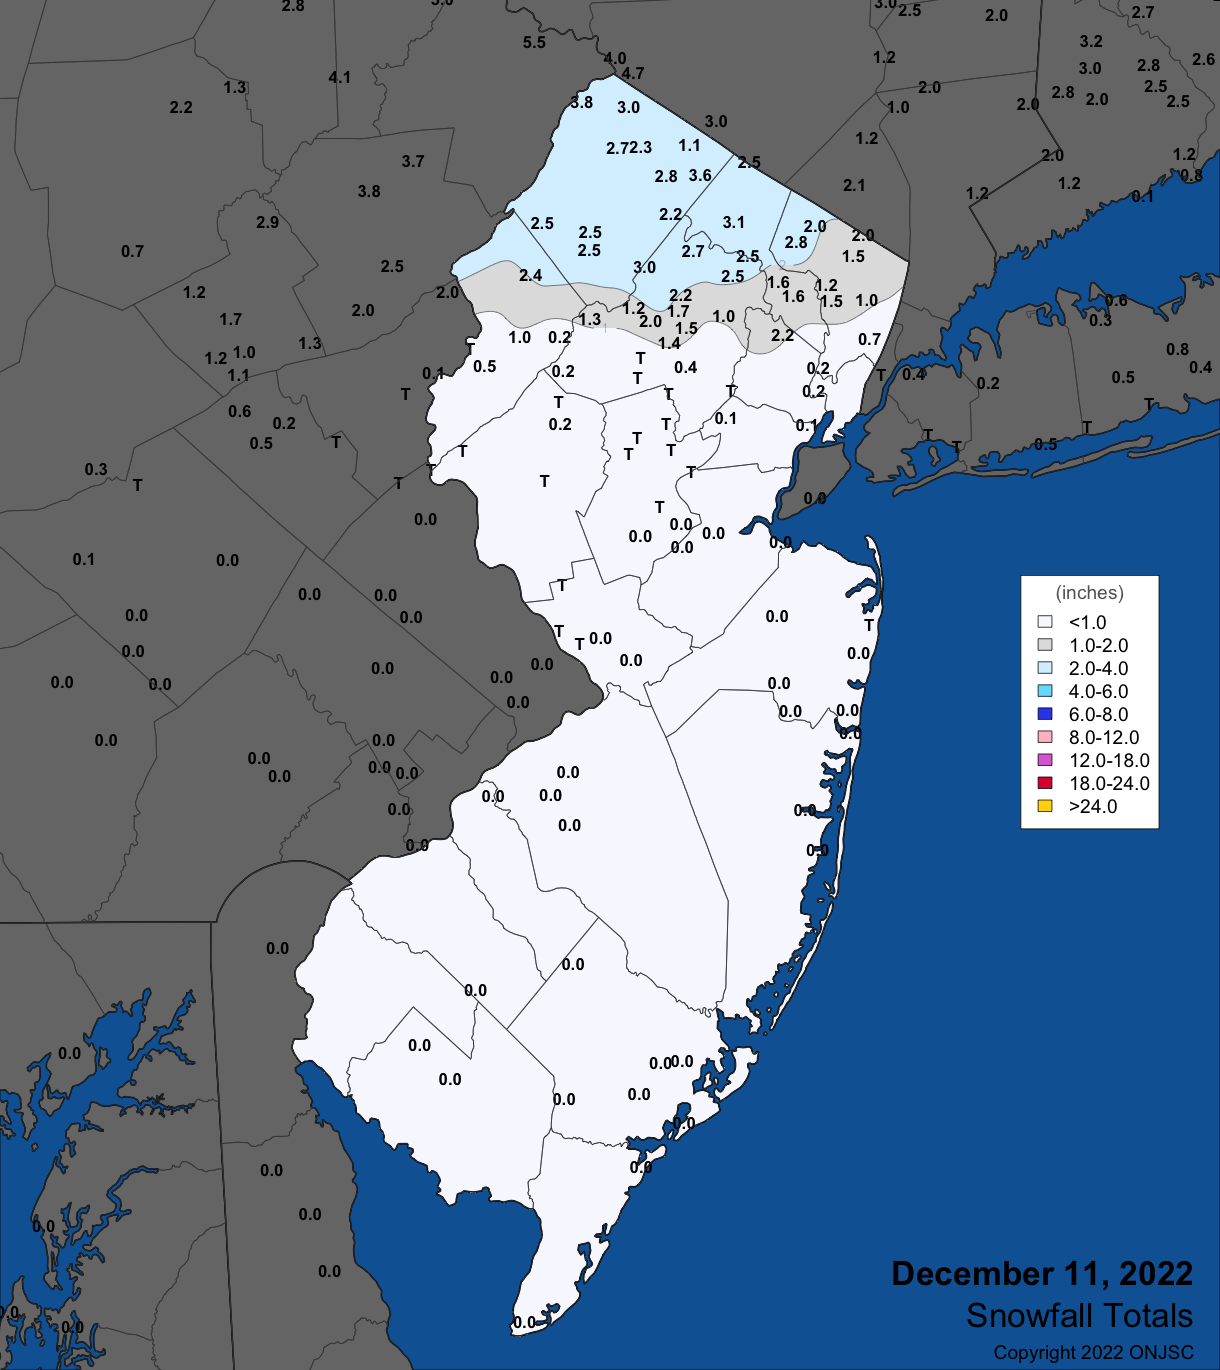
Figure 3. Snowfall on December 11th. Observations are from CoCoRaHS, NWS Cooperative Observer, and NWS trained spotter reports.
Next up was another mixed precipitation event beginning from south to north during midday on the 15th. Mostly rain throughout the state, higher elevations in the northwest ended up with more snow than in the previous event. Wind entered the picture with the heavier precipitation during the PM hours and thunder accompanied the rain in some southern locations. The precipitation tapered off early on the 16th, with some remnant flurries persisting in the north. Rainfall was the greatest of the month along the coast, with Toms River (Ocean) catching 2.83”, Lakewood (Ocean) 2.80”, Wildwood Crest 2.74”, and Middle Township (Cape May) 2.71”. Some 38 of the 251 CoCoRaHS reports were from 2.00”–2.83”, and 167 from 1.00”–1.99” (Figure 4). Measurable snow fell in six counties with four of them catching 1.0” and three 2.0” or more (Figure 5). The top total was 7.0” at Highland Lakes, followed by 7.2”, 5.3”, and 3.0” at declining elevations in Wantage, Knowlton Township (Warren) 3.8”, and Vernon Township 3.5”. Windy conditions brought gusts to 45 mph at Sea Girt (Ocean) and Atlantic City Marina, 40–44 mph at five NJWxNet locations on the 15th, and up to a 51-mph gust at Harvey Cedars (Ocean), 48 mph in Seaside Heights, 46 mph at Little Egg Harbor Township (LEHT) (Ocean), and 44 mph at two stations on the 16th.
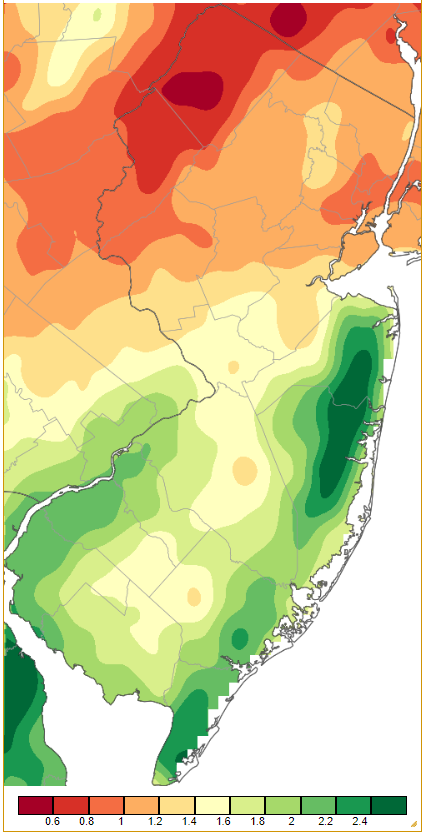
Figure 4. Precipitation across New Jersey from 7 AM on December 15th through 7 AM December 16th based on a PRISM (Oregon State University) analysis generated using NWS Cooperative and CoCoRaHS observations. Note the scale in inches beneath the map.
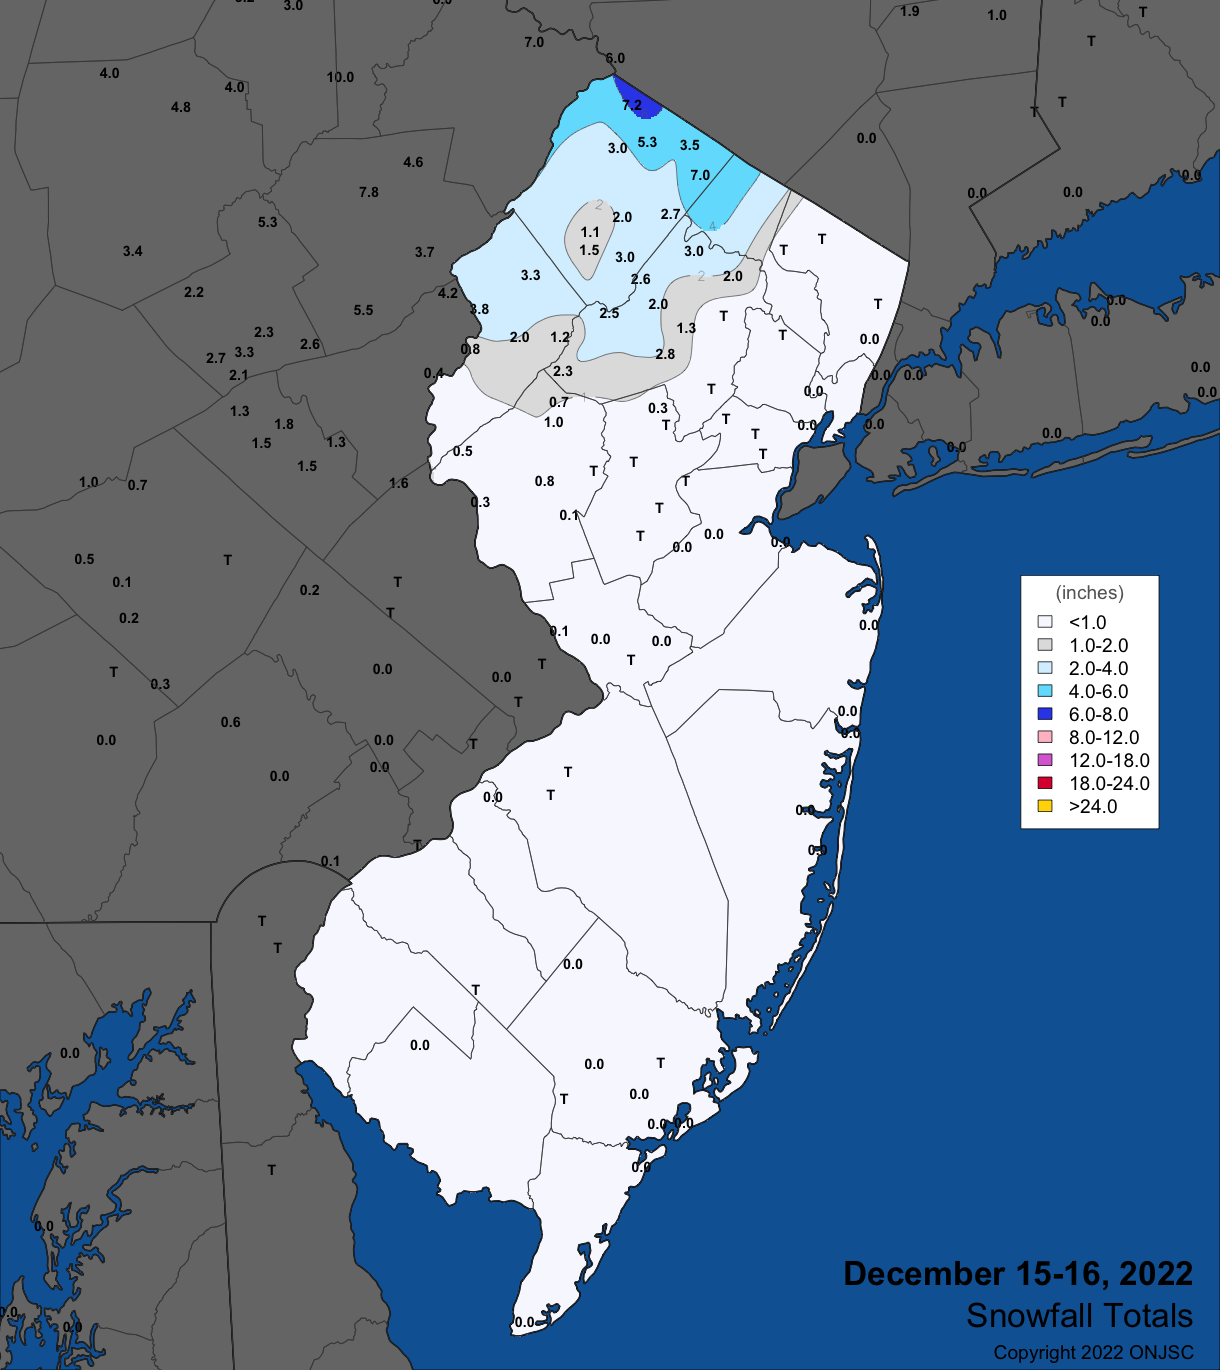
Figure 5. Snowfall on December 15th–16th. Observations are from CoCoRaHS, NWS Cooperative Observer, and NWS trained spotter reports.
A major newsworthy weather event impacted a huge portion of the US during the week prior to Christmas. This involved severe weather, quickly-changing temperatures leading to brutal cold and wind chills, inland and coastal flooding, and localized lake effect blizzard conditions that turned tragic. While NJ did not suffer the worst of the weather, impacts were felt on the 22nd into what proved to be one of the coldest holiday weekends on record. Temperatures will be covered in the next section of the report. Here, the concentration is on other storm aspects. This includes heavy rain that fell, particularly in the northeast, early on the 23rd following moderate rain that moved from south to north during the daylight hours of the 22nd. The overnight storminess produced a 58-mph wind gust at Lyndhurst (Bergen). A cold front blasted through the state midday on the 23rd, accompanied by up to pea-size hail, thunder, and heavy rain in some areas. As the temperatures tumbled, the rain changed over to squally snow during the afternoon prior to rather quick clearing.
Event precipitation amounted to 2.32” at Mine Hill Township, Vernon Township 2.30”, Hawthorne (Passaic) 2.29”, and Montvale (Bergen) and Randolph Township each 2.26”. Some 28 stations received 2.00”–2.51”, and 166 of the CoCoRaHS reports were from 1.00”–1.99” (Figure 6). Top snow totals were 0.8” at both Mount Olive (Morris) and Liberty Township (Warren). Rainfall was quick and plentiful enough to raise some streams and rivers to minor flood or action stages in northern and central areas.
Post-frontal wind gusts made it to 60 mph at Fortescue (Cumberland), Atlantic City Marina 57 mph, Harvey Cedars 56 mph, both Seaside Heights and LEHT 52 mph, Lower Alloways Creek Township (LACT; Salem) 51 mph, and 22 other NJWxNet stations from 40–49 mph (Figure 8). Strong winds continued into the 24th with Fortescue up to 48 mph, LEHT 41 mph, and LACT 40 mph.
Easterly winds ahead of the front and a new moon were enough to raise water levels along beaches and adjacent waters. Water levels at Sandy Hook (Monmouth) and several other northern coastal locations rose to their highest levels since Sandy in 2012 (Figure 8). Fortunately, this was just for one tidal cycle and the water height at Sandy Hook was over 5 feet lower than in Sandy.
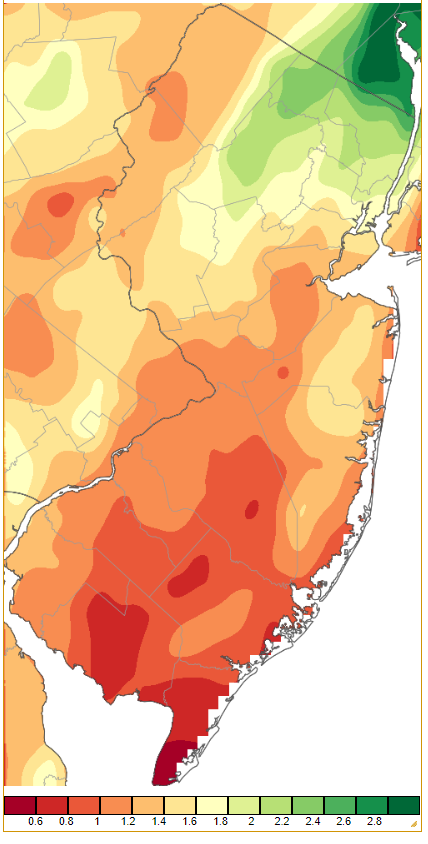
Figure 6. Precipitation across New Jersey from 7 AM on December 22nd through 7 AM December 24th based on a PRISM (Oregon State University) analysis generated using NWS Cooperative and CoCoRaHS observations. Note the scale in inches beneath the map.
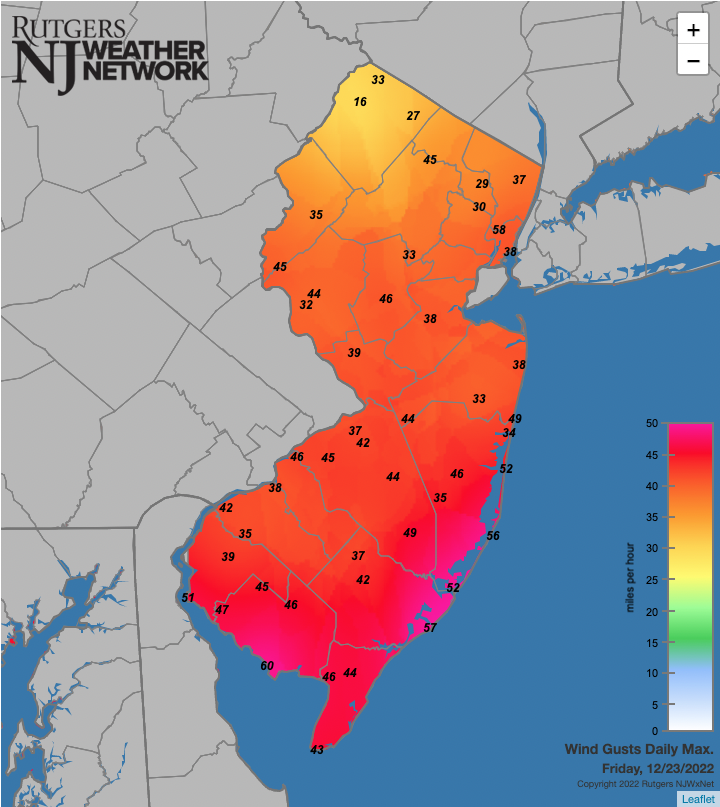
Figure 7. Maximum wind gusts at Rutgers NJ Weather Network stations on December 23rd. Note that sheltered locations in some northern locations result in lower gusts. Also, malfunctioning anemometers at two high-elevation stations (HPM, Vernon Township) resulted in no observations from these locations in the northwest.
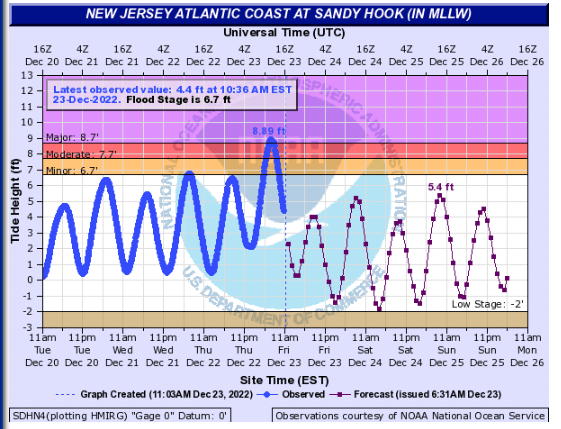
Figure 8. Tide height at the Sandy Hook gage from 11 AM on December 20th to 11 AM on December 23rd (blue line) and projected heights onward to December 26th (red line). (NOAA National Ocean Service).
The aforementioned event on the 31st deposited as much as several tenths of an inch of rain prior to observation time, however, the bulk of the rain fell in the afternoon into the evening, some still lingering in the north as the New Year arrived. More on this event in the January report, though briefly, Brigantine (Ocean) received the most with 1.48” and 16 southeastern stations caught over 1.00”. Most NJ locations saw from 0.20”–0.60”.
The highest barometric pressures of the month were observed on the 1st and 21st with each day at 30.45”–30.55”. The storm on the 23rd caused the pressure to drop to a monthly low of 29.00”–29.15”. Other than the six days reported above, there were no other days with 40 mph or greater gusts during the month, keeping in mind that the often-windy HPM station was out of commission after the 15th.
At month’s end, the US Drought Monitor showed abnormally dry conditions persisting in the northern Highlands and in Cape May County. The NJ Department of Environmental Protection ended the statewide drought watch on December 27th that had been in place since August 9th.
Temperature
December temperatures flipped back and forth from a mild first week to cooler second, then mild again prior to a very cold early holiday week, and finally ending with abnormal warmth. There were nine days where the high temperature at more than one NJWxNet station exceeded 55° and ten days where the low temperature was 15° or colder. This includes the 23rd when both criteria were met!
Looking first at 55° plus maximum temperatures, the 2nd found both Cape May Court House (Cape May) and Mannington (Salem) at 60°. Of the 65 NJWxNet stations, 25 got to 60° and 28 from 55°–58°. Toms River hit 60° on the 6th with 50 stations from 55°–59°. The 7th saw Howell (Monmouth) reach 61°, nine stations make it to 60°, and 46 from 55°–59°. Even HPM reached 52°. LEHT and Cape May Court House made it to 58° on the 8th. After a two-week pause, five stations reached 57° on the 22nd, and 23 either 55° or 56°. On this day, HPM only managed a high of 35°.
The warm side of the front on the 23rd found Mannington and Pennsauken (Camden) each up to 60° early in the morning. An impressive 55 other NJWxNet stations maxed from 55°–59°, while Wantage and HPM were coolest at 48°.
A blast of mild air arrived to end 2022. Berkeley Township (Ocean) made it to 59° and 18 stations 55°–58° on the 29th. Temperatures on the morning of the 30th hinted at considerable warm air aloft, as higher elevations were substantially milder than at lower elevations in north Jersey, even with some clouds present (Figure 9). Clear skies in the south led to lower temperatures than in northern valleys but were destined to rise rapidly as dawn broke. By the afternoon of the 30th, temperatures rose into the 60°s up the spine of the state and into the upper 50°s in the Delaware Valley (Figure 10). Meanwhile, cooler ocean waters helped suppress thermometers near the coast to the upper 40°s and low 50°s. In fact, all areas were well above normal. This is reflected in the high temperature map for the day (Figure 11) and seeing NJWxNet stations topping out as high as 67° in Howell, 65°–66° at nine sites, and 60°–64° at 39 other locations. Atlantic City Marina at 49° was the only station not to reach 50°.
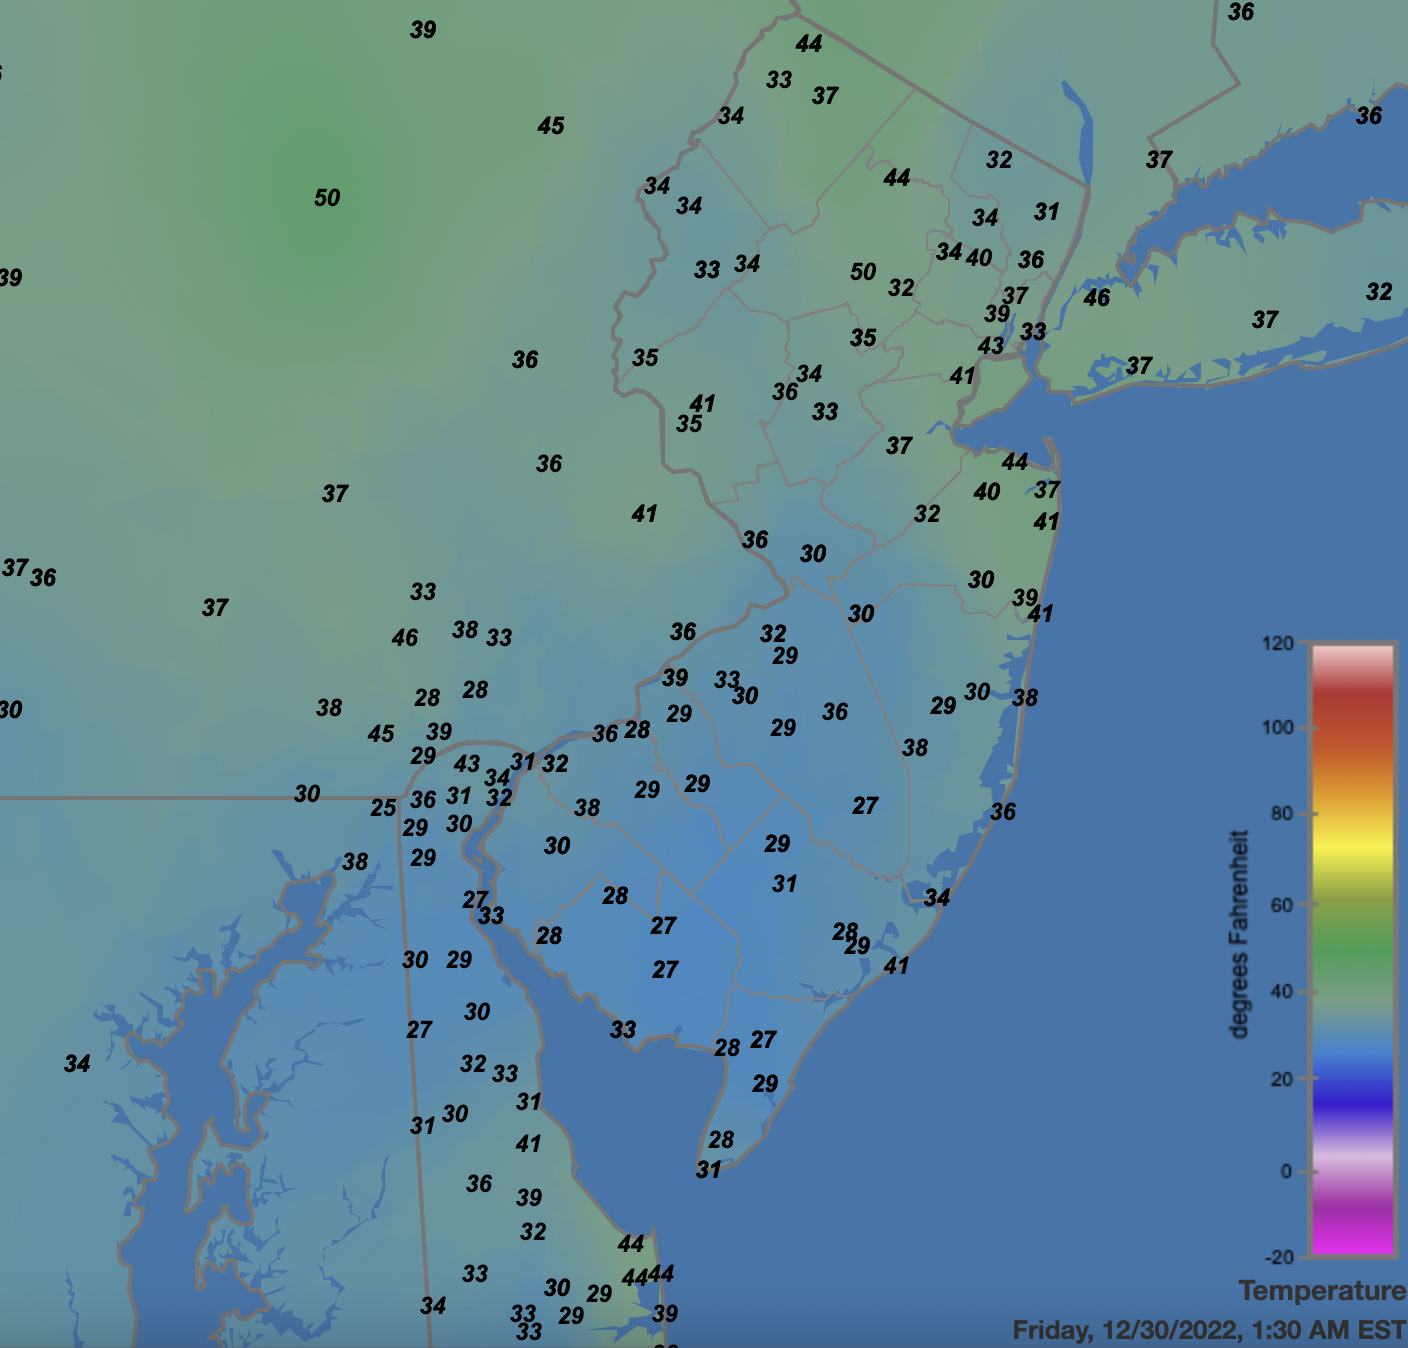
Figure 9. Surface air temperatures across NJ and nearby states at 1:30 AM on December 30th. Observations are from automated Rutgers NJ Weather Network, National Weather Service airport, Shrewsbury Weather Network, and Delaware Environmental Observing System weather stations.
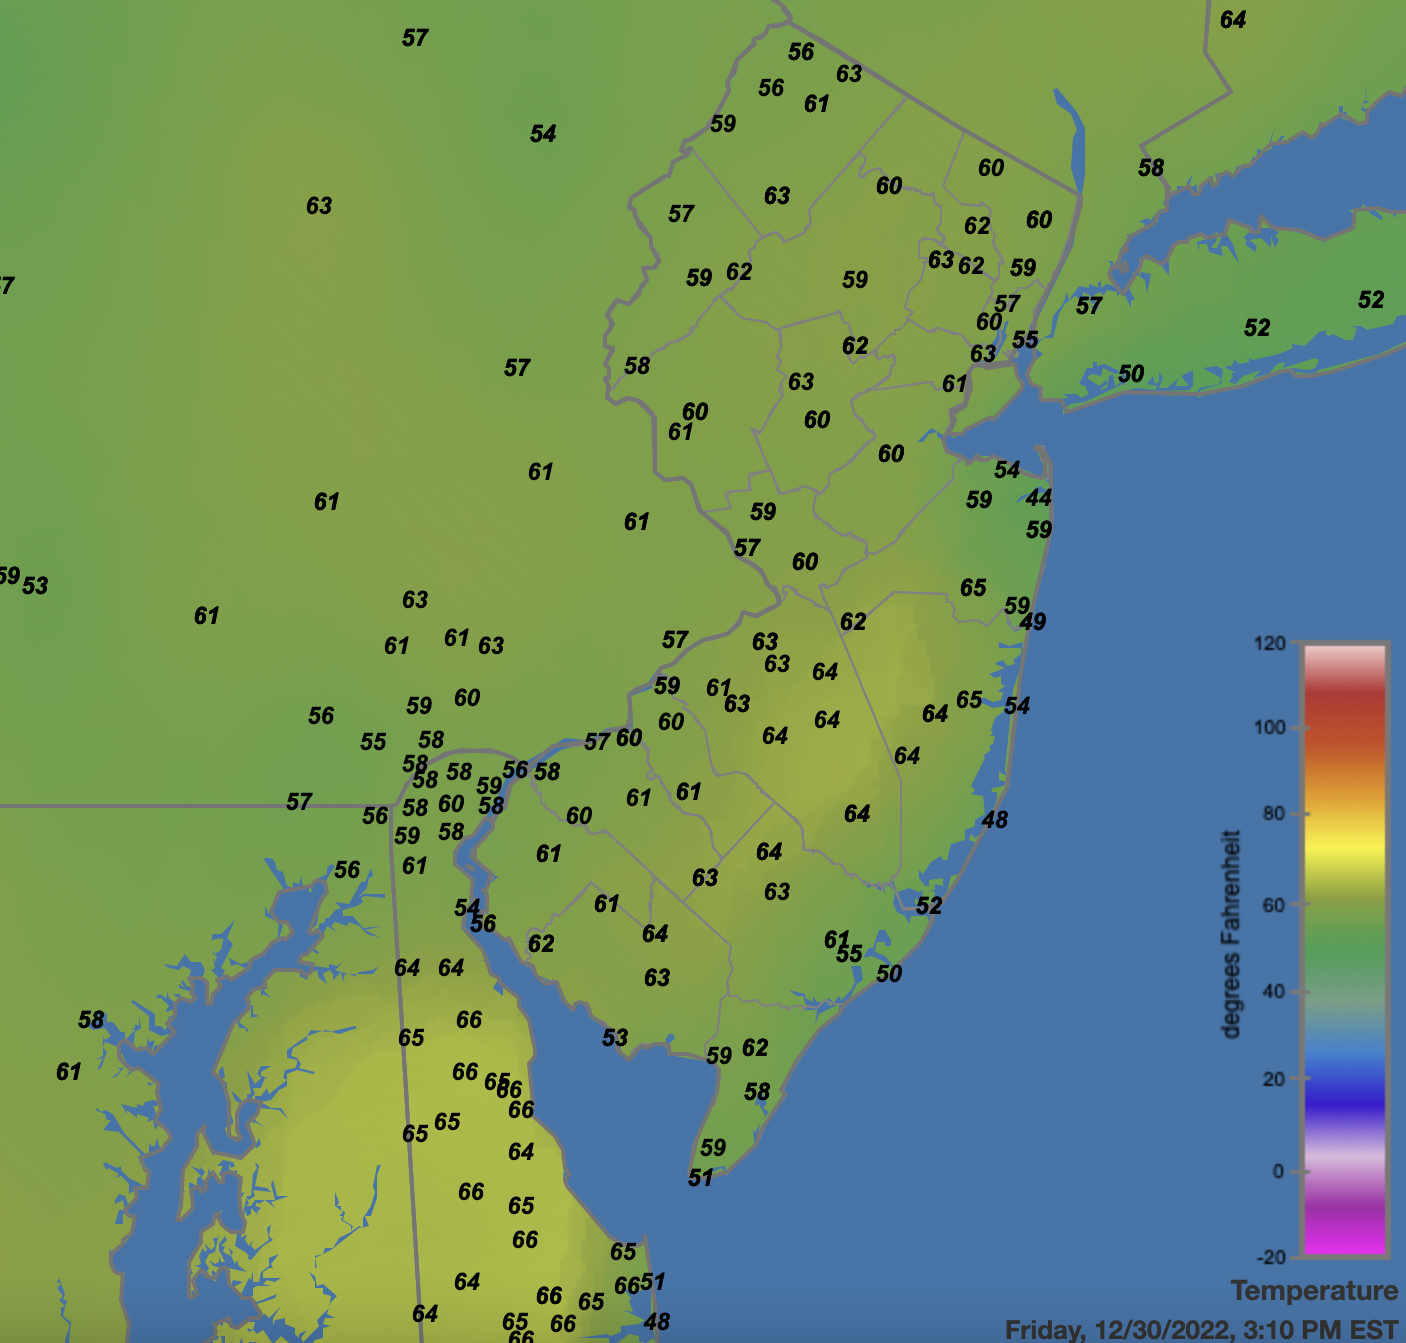
Figure 10. Surface air temperatures across NJ and nearby states at 3:10 PM on December 30th. Observations are from automated Rutgers NJ Weather Network, National Weather Service airport, Shrewsbury Weather Network, and Delaware Environmental Observing System weather stations.
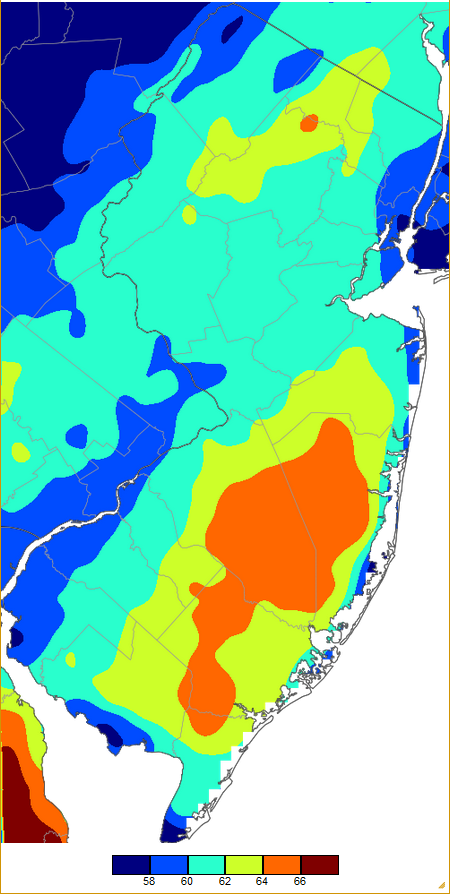
Figure 11. Maximum temperatures on December 30th based on a PRISM (Oregon State University) analysis generated using NWS, NJWxNet, and other professional weather stations. Note the 2-degree increment scale beneath the map.
The first sub-15° day of December was the 5th when Walpack (Sussex) fell to 13°. This cold-air drainage location dropped to 15° on the 10th, to 11° on the 13th when HPM was 12°, and to 15° on the 14th. Cold air returned on the 21st with Walpack down to 12°, Sandyston (Sussex) 13°, and Pequest (Warren) 13°.
The warmup ahead of and the storminess accompanying the cold front on the 23rd have been covered previously. Here, focus is on the abrupt drop in temperature and subsequent extreme cold following passage. Midday temperatures dropped several tens of degrees within minutes to a few hours. By late afternoon, temperatures were in the teens and low 20°s statewide, while to the northeast the front had yet to fully advance into New England, and to the west subzero readings were found (Figure 12). By midnight, NJ temperatures had fallen to -3° at HPM, -2° at the slightly lower High Point (Sussex) station, 1° further down the east side of the ridge in Wantage, 2° at Charlotteburg (Passaic), and 2° in Parsippany (Morris), all among the milder locations at elevation in Figure 9 above. Some 47 other NJWxNet stations fell to 3°–10°, with West Cape May “mildest” at 14°. Numerous stations experienced a 50° or greater drop in temperature on the 23rd. Topping the list were four sites with 53° diurnal ranges, including Pennsauken (60° to 7°), Kingwood (Hunterdon; 57° to 4°), and both Pittstown (Hunterdon) and Pequest (56° to 3°). Tack on several more degrees for 24-hour declines by the time lows were reached near dawn on the 24th.
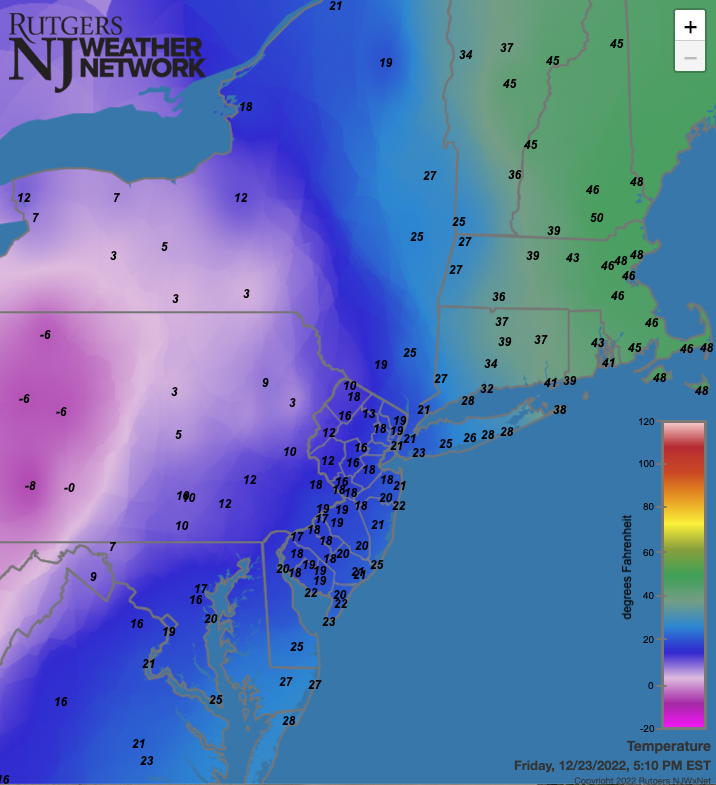
Figure 12. Temperatures at 5:10 PM on December 23rd from Rutgers NJ Weather Network and National Weather Service airport stations.
The influx of polar air into NJ continued into the 24th, with daily minimums of -4° at HPM, High Point -3°, Sandyston and Wantage each 0°, 18 stations from 1°–5°, and 50 from 6°–10° (Figure 13). Fortescue was mildest at 12°. Daytime highs on the 24th only made it to 5° at HPM and to 22° at West Cape May, for the coldest day of 2022. The cold began to release its grip on the 25th, though HPM still fell to 3°, High Point 4°, a surprisingly cold 4° in Woodbine (Cape May), and 17 stations from 6°–10°, with four sites as mild as 17°. Sandyston took low honors on the 26th at 4°, with 16 stations from 6°–10°. The Berkeley Township station in the Pinelands was lowest at 14° on the 28th.
The only December day where every NJWxNet station remained above freezing for the full 24 hours was the 7th, when Basking Ridge (Somerset) was coolest at 44°.
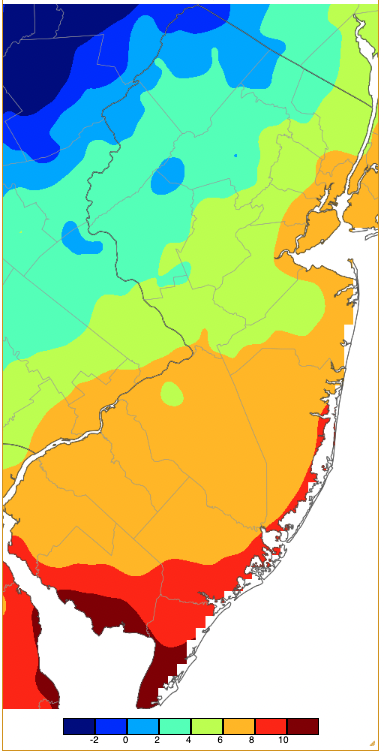
Figure 13. Minimum temperatures on December 24th based on a PRISM (Oregon State University) analysis generated using NWS, NJWxNet, and other professional weather stations. Note the 2-degree increment scale beneath the map.
Annual Overview
The statewide average 2022 temperature of 54.3° was 0.7° above the 1991–2020 average and tied with 2019 and 2002 as the 12th warmest since 1895 (Table 1). This century has included 16 of the 21 warmest years of the past 128, with eight within the past ten years. The 2022 average is 2.4° above the average from 1895–2021. Seven months averaged above normal and five below. This included the warmest August, the 9th warmest July, and the 3rd warmest summer (June–August). The average maximum of 64.7° is 1.2° above average (1991–2020), ranking 8th warmest (2.7° above 1895–2022). The average minimum of 43.9° is 0.3° above average, ranking 14th warmest (2.2° above 1895–2022). The northern climate division averaged 52.3° (+0.8°, 12th warmest), the southern division 55.5° (+0.7°, 12th warmest), and coastal division 55.7° (+0.8°, 13th warmest).
| Rank | Year | Annual Avg. Temp. |
| 1 | 2012 | 55.9° |
| 2 | 2020 | 55.5° |
| 3 | 1998 | 55.2° |
| 4 | 2021 | 55.1° |
| 5 | 2016 | 55.0° |
| 5 | 2006 | 55.0° |
| 7 | 2011 | 54.9° |
| 8 | 2010 | 54.7° |
| 9 | 2017 | 54.6° |
| 10 | 1990 | 54.5° |
| 11 | 1991 | 54.4° |
| 12 | 2022 | 54.3° |
| 12 | 2019 | 54.3° |
| 12 | 2002 | 54.3° |
| 15 | 2018 | 54.2° |
| 16 | 1999 | 54.1° |
| 17 | 2015 | 53.9° |
| 17 | 1949 | 53.9° |
| 19 | 2008 | 53.6° |
| 19 | 2007 | 53.6° |
| 19 | 2001 | 53.6° |
Table 1. The twenty-one mildest years across NJ since 1895.
The highest temperatures of the year at stations throughout NJ and adjacent areas are used to generate Figure 14. The map does not depict temperatures on a single day, rather it displays the highest temperatures achieved on the hottest day during the year at many dozens of stations. It shows that the entire state apparently made it to 90° or higher at least once during the year. In fact, the High Point Monument (Sussex County) NJWxNet station failed to do so, reaching 89° on three July days and one day in August. All other annual highs were in the 90°s, except, again not depicted, there were highs of 102° at Hillsborough-Duke (Somerset) and the NWS Newark Airport (Union) stations on July 24, when seven NJWxNet stations touched 100°. Note the high 90°s that made it to the northern coast on one or more days.
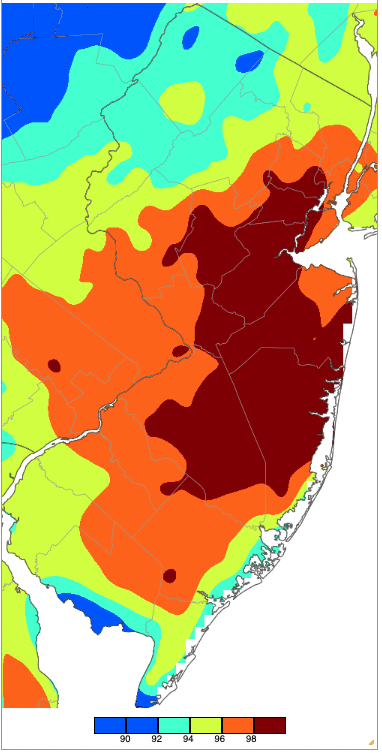
Figure 14. Annual maximum temperatures across NJ during 2022 based on a PRISM (Oregon State University) analysis generated using NWS, NJWxNet, and other professional weather stations. Note the 2-degree increment scale beneath the map.
The coldest temperatures of the year are depicted in Figure 15. Note that this map has similarities to Figure 13 above, as December 24th was the coldest day of the year in many locations. However, not so for all locations, with the year’s coldest temperature of -10° at Sandyston (Sussex) on January 22nd.
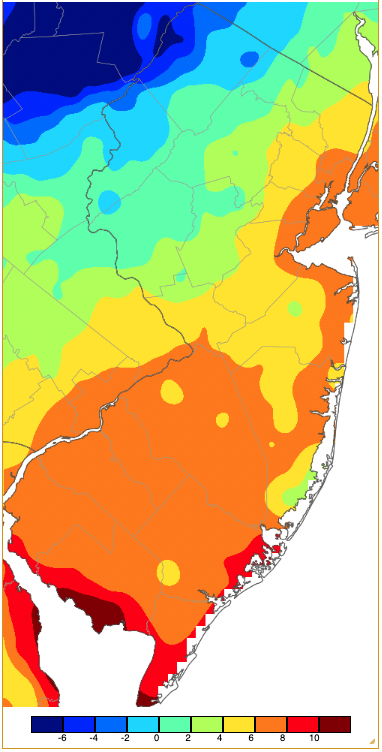
Figure 15. Annual minimum temperatures across NJ during 2022 based on a PRISM (Oregon State University) analysis generated using NWS, NJWxNet, and other professional weather stations. Note the 2-degree increment scale beneath the map.
Annual precipitation averaged 44.02”, which is 3.54” below the 1991–2020 normal and ranks 54th driest since 1895. Eight months had below-average precipitation and four above. This resulted in the 4th driest summer, the driest since 1966. Fortunately, the 10th wettest October began to ameliorate the summer drought conditions, with drought conditions absent from NJ to end the year. Central and northern coastal areas, the northeast, and the Delaware Valley were wettest, while the northern Highlands, Pinelands, and far south were driest (Figure 16). The northern climate division averaged 44.87” (-3.85”, 51st driest), the southern division 43.47” (-3.41, 54th driest), and coastal division 43.99 (-2.59”, 66th driest).
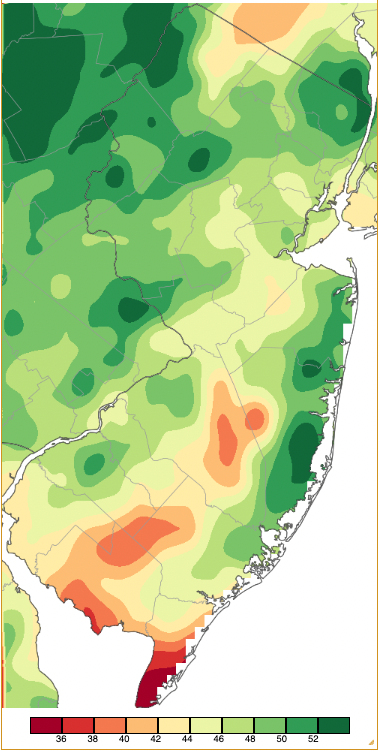
Figure 16. Annual 2022 precipitation across New Jersey based on a PRISM (Oregon State University) analysis generated using NWS Cooperative and CoCoRaHS observations. NJ totals ranged from 34.00”–35.99” (red) to 52.00”–53.99” (dark green).
Annual precipitation at individual CoCoRaHS stations reached a maximum of 56.63” in Chester Township (Morris), followed by Tenafly (Bergen) 54.81”, Howell (Monmouth) 54.37”, Galloway Township (Atlantic) 54.34”, Mine Hill Township (Morris) 53.84”, Mount Olive (Morris) 53.32”, Stillwater Township (Sussex) 52.98”, and Berkeley Township (Ocean) 52.85”. The driest location was Ocean City (Cape May) with 41.33”, followed by East Windsor (Mercer) 41.83”, Upper Deerfield (Cumberland) 41.95”, Bernards Township (Somerset) 42.48”, Franklin Township (Gloucester) 42.96”, and Franklin Township (Somerset) 44.01”.
Please take a look at the ONJSC annual top 10 list for more specifics concerning the weather and climate highlights of 2022, a year in search of an identity!
For those seeking more detailed information on 5-minute, hourly, daily, and monthly conditions, please visit the following Office of the NJ State Climatologist's websites:
Rutgers NJ Weather Network
NJ Community Collaborative Rain, Hail and Snow Network
NJ Snow Event Reports
Interested in receiving our monthly summaries at the end of each month? Send us your e-mail address here to join the mailing list.
Past News Stories

