Dry Conditions Persist: December 2021 Recap
Another Warm One: Annual 2021 Recap
New Jersey State Climatologist
Center for Environmental Prediction, School of Environmental and Biological Sciences/NJAES, Rutgers University
January 7, 2022
December Overview
Following a cooler-than-normal November, it was back to the mild side in December, the ninth such month in 2021. However, much like November, the last month of 2021 was a top 10 dry one. An annual recap follows the December report where more will be said regarding annual temperature and precipitation.
Statewide precipitation in December was 1.29”. This is 2.98” below the 1991–2020 normal and ranks as the 6th driest since records commenced in 1895 (Table 1). It was the driest December since 1989, which happened to be the coldest December on record. The west-central area received the most precipitation, exceeding 1.80” in some locations, but this was still well below normal (Figure 1). The far south was driest, most places receiving less than an inch. The northern division averaged 1.46”, which is 2.79” below normal and ranked 10th driest. The southern division came in with 1.20”, which is 3.08” below normal and ranks 5th driest. The coastal division with 1.09” was 3.27” below normal and ranked 4th driest.
| Rank | Year | Dec. Avg. Precip. |
| 1 | 1955 | 0.40” |
| 2 | 1989 | 0.81” |
| 2 | 1980 | 0.81” |
| 4 | 1988 | 0.95” |
| 5 | 1896 | 1.21” |
| 6 | 2021 | 1.29” |
| 7 | 1998 | 1.34” |
| 8 | 2017 | 1.46” |
| 9 | 1943 | 1.48” |
| 10 | 1939 | 1.50” |
Table 1. The ten driest Decembers across NJ since 1895.
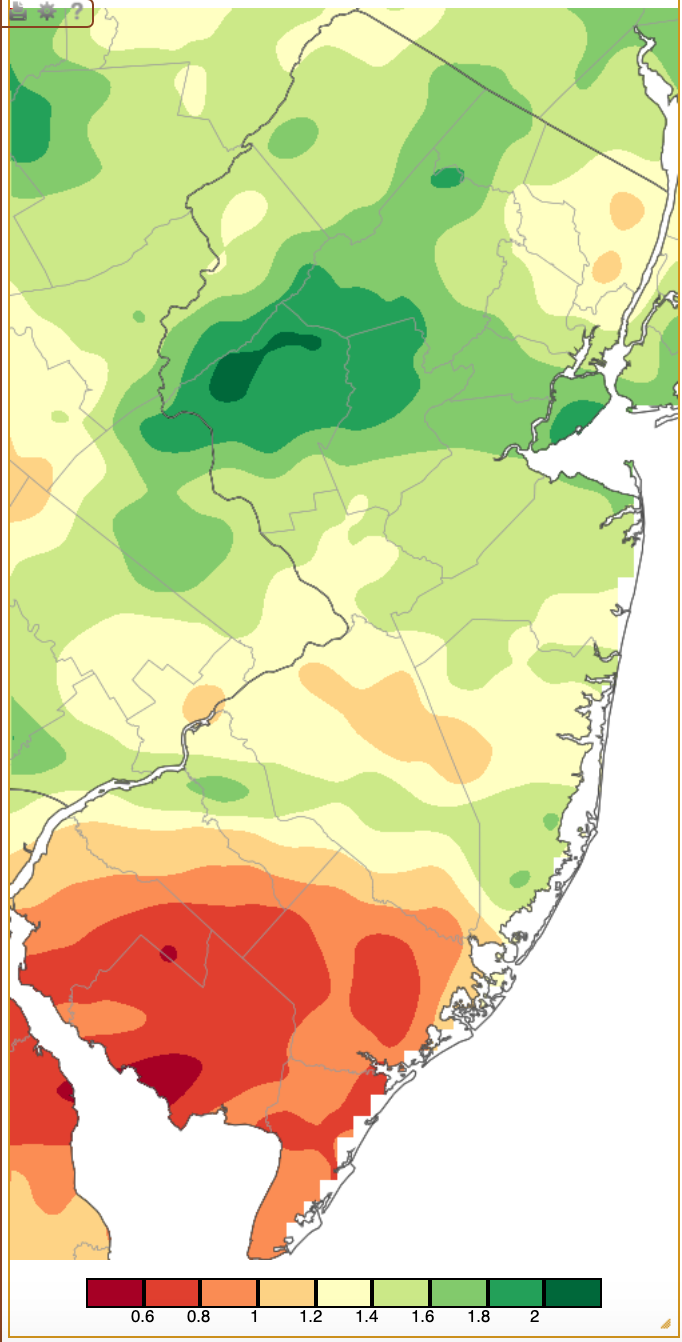
Figure 1. December 2021 precipitation across New Jersey based on a PRISM (Oregon State University) analysis generated using NWS Cooperative and CoCoRaHS observations from 7 AM on November 30th to 7 AM on December 31st. Note the scale in two-tenths of an inch at the bottom of the map. Totals range from 0.40”–0.60” (dark red) to 2.00”-2.20” (dark green).
Cumulatively, November and December came in with 2.32” statewide. This is 5.31” below normal and is as the driest such interval in the 127-year record book (Table 2). Nine decades are represented in the top 10 driest.
| Rank | Year | Nov.–Dec. Avg. Precip. |
| 1 | 2021 | 2.32” |
| 2 | 1998 | 2.69” |
| 3 | 1955 | 2.70” |
| 4 | 1976 | 3.00” |
| 5 | 1965 | 3.10” |
| 6 | 1931 | 3.15” |
| 7 | 2017 | 3.16” |
| 8 | 1939 | 3.20” |
| 9 | 2001 | 3.22” |
| 10 | 1917 | 3.41” |
Table 2. The ten driest November–Decembers combined across NJ since 1895.
Much of New Jersey saw an absence of measurable snowfall, defined as 0.1” or more. The state climate office divides the NJ into northern, central, and southern divisions for snow, and monthly averages are generated from station data within each region. While no measurable snow fell in the south in December, the central area averaged 0.1” and the north 0.9”. For the central area, this is 4.7” below average and ties with three other years for the 12th least snowy since records commenced in 1895. In the north the departure was 5.2” below normal, making it the 22nd least snowy December, tied with four other years.
The statewide average December temperature of 41.5° was 3rd warmest on record, 4.9° above the 1991–2020 normal, and a much larger 7.8° margin above the 1895–present normal. This was only 2.3° colder than the most recent mild November. In fact, 32 previous Novembers have been colder than December 2021 and only four previous years have had mean temperatures between the two months differ by less than 2.7° (2015, 2012, 1996, and 1923).
| Rank | Year | Dec. Avg. Tmp. |
| 1 | 2015 | 48.0° |
| 2 | 2006 | 41.7° |
| 3 | 2021 | 41.5° |
| 4 | 2001 | 41.1° |
| 5 | 2012 | 40.6° |
| 6 | 2011 | 40.5° |
| 7 | 1984 | 40.2° |
| 8 | 1998 | 40.0° |
| 9 | 1982 | 39.7° |
| 10 | 1923 | 39.5° |
Table 3. The ten mildest Decembers across NJ since 1895.
The statewide average maximum of 49.7° was 4.7° above the 1991–2020 normal, ranking 5th mildest. The average minimum of 33.2° was 5.0° above normal and ranked 2nd. It is only one of three Decembers with minimum temperatures averaging above the freezing mark.
Temperature
There were nine December days when high temperatures at one or more NJWxNet stations reached or exceeded 60°, just two fewer than in November. The 2nd found Cape May Court House (CMCH; Cape May County) up to 65° and 36 of the 65 NJWxNet stations from 60°–64°. High Point Monument (HPM; Sussex) only reached 47°. Woodbine (Cape May) made it to 60° on the 3rd. The 6th saw 67° maximums at Mannington (Salem), Red Lion (Burlington), and West Deptford (Gloucester), with 12 stations at 66°, and 38 from 60°–65°.
The 11th was a record-setting day for warmth at some long-term stations around NJ, such as New Brunswick (Middlesex). Most of interior southern, all of central, and northeastern NJ saw highs of at least 64° (Figure 2). This included 69° at Mansfield (Burlington), 68° at 13 stations, and 49 stations from 60°–67°. Coolest was coastal Harvey Cedars (Ocean) and HPM, each at 58°.
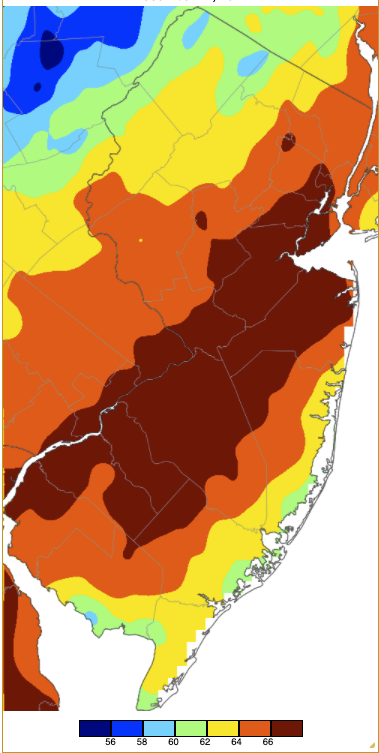
Figure 2. Maximum temperatures on December 11th based on a PRISM (Oregon State University) analysis generated using NWS, NJWxNet, and other professional weather stations. Note the 2 ° increment scale beneath the map.
A four-day run of 60°+ weather ensued on the 16th with CMCH at 68°, West Creek (Ocean) 67°, and 57 stations from 60°–66°. Harvey Cedars and Fortescue (Cumberland) were lowest at 56°. Sicklerville (Camden) and West Creek each reached 63° on the 17th, with 35 locations from 60°–62°. CMCH was alone at 60° on the 18th, while CMCH was 63° and both West Cape May (Cape May) and Woodbine 60° on the 19th. While no station reached 60° on the 24th, there was a 27° spread in high temperatures across NJ, with 56° maximums at Woodbine, West Creek, and CMCH, while HPM only reached 29°. Warm air surged further north on the 25th with Vineland (Cumberland) and Greenwich (Cumberland) each hitting 65° and 14 stations getting to 60°–64°. A few local spots in the north failed to get into the warmth, with Haworth (Bergen) on the low end at 42°.
While all but four December days found one or more NJWxNet station falling below freezing, only six days had lows of 20° or lower. The first was on the 9th when Walpack (Sussex) cooled to 17° and three stations to 20°. On the 15th Pequest (Warren) and Walpack hit 20° while Seaside Heights (Ocean) only fell to 49°. On the 19th, HPM dropped to 18°, High Point (Sussex) 19°, and both Pequest (Warren) and Vernon Township (Sussex) hit 20°. This was one of the rare days when all NJWxNet stations fell below freezing. This also occurred on the 20th, the coldest day of the month. Walpack bottomed out at 13°, Hopewell Township (Mercer) and Sandyston (Sussex) both were at 14°, and 32 stations were from 15°–20°. Seaside Heights was least cold at 28°. As seen in Figure 3, coastal and urban areas saw the mildest minimums. The 21st brought a low of 15° to both Pequest and Hopewell Township, with 15 stations from 16°–20°. Kingwood (Hunterdon), Pequest, Sandyston, and HPM were all 20° on the 23rd.
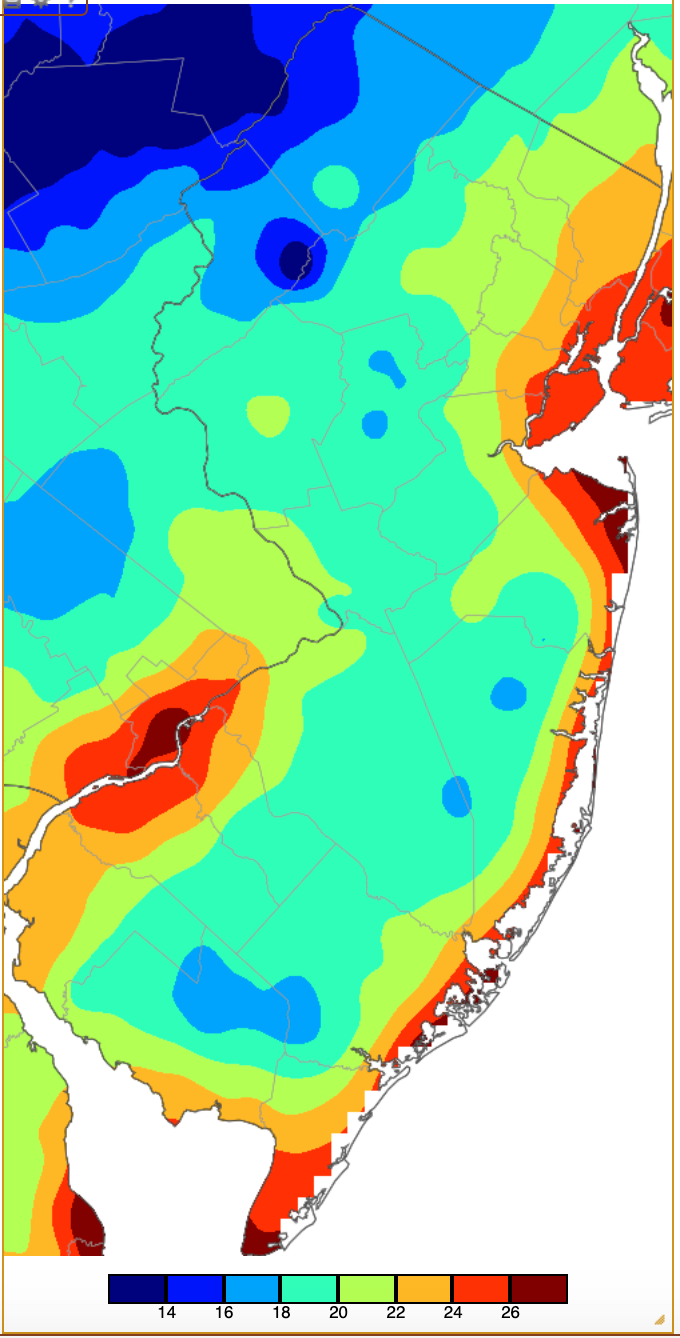
Figure 3. Minimum temperatures on December 20th based on a PRISM (Oregon State University) analysis generated using NWS, NJWxNet, and other professional weather stations. Note the in 2 °F increment scale beneath the map.
The four days without a freeze anywhere in the state included the 2nd (all stations 34° or milder), 11th (none colder than 35°), and to finish the month and year, the 30th (lowest 36° at the higher elevations of HPM, High Point, and Vernon Township), and the 31st, which was only as cold as 41° at the cold-air drainage lower elevations of Walpack and Berkeley Township (Ocean).
Precipitation and Storms
Not one NJWxNet or NJ CoCoRaHS station picked up more than a half to three quarters of an inch of rain or melted snow in any “storm” event in December. This, of course, explains the low monthly totals, though there were enough events for some stations to accumulate a little more than 2.00” during the month. This includes Bethlehem (Hunterdon) that topped the state with 2.28”. Other totals in the two-inch range included Clinton (Hunterdon) 2.17”, Greenwich (Warren) 2.11”, Holland Township (Hunterdon) 2.08”, and Frenchtown (Hunterdon) 2.00”. The driest locations in the south included Deerfield (Cumberland) with 0.47”, Upper Deerfield (Cumberland) 0.53”, Franklin Township (Gloucester) 0.65”, Buena Vista (Atlantic) and Egg Harbor City (Atlantic) each with 0.68”, and 0.76” in Egg Harbor Township (Atlantic), Northfield (Atlantic), Ocean City (Cape May), and Dennis Township (Cape May).
A pre-dawn event on the 6th brought Red Bank (Monmouth) 0.58”, Absecon (Atlantic) 0.48”, and Eatontown (Monmouth) 0.44”. That evening, a squall line zipped through the state, with strong winds and brief downpours. Kearny (Hudson) saw 0.26” and Woodbridge (Middlesex) 0.24” while winds gusted to 53 mph at HPM, 51 mph at Sea Girt (Monmouth), and 40–49 mph at 18 NJWxNet locations. Another squall line blew through NJ on the evening of the 11th. Most of the state saw at least 0.10” of rain with the most in Cape May County where three Lower Township stations caught 0.55”, 0.51”, and 0.39”, and three Middle Township stations 0.45”, 0.44”, and 0.34”.
Morning rain on the 18th brought 0.37” to Lacey Township (Ocean), 0.36” at Southampton (Burlington), and 0.34” to Montague (Sussex). Rain began falling late on the 21st and ended close to dawn on the 22nd. At times in the north, it was mixed with snow. Holland Township received 0.43” of rain and melted snow, Franklin Township (Warren) 0.42”, and Washington Township (Warren) 0.42”.
Measurable snow fell across northwest NJ and in some central and northeast locations early on the 24th. No location picked up more than 0.16” of melted precipitation, while snowfall amounted to as much as 2.1” in Frelinghuysen Township (Warren), 2.0” at Blairstown (Warren), and 1.7” in Jefferson Township (Morris). The final precipitation event of 2021 began late in the afternoon of the 28th and was off and on into the 30th. This was a cloudy, at times foggy end-of-year period that also saw some locations receive a little sleet. Precipitation totaled as much as 0.78” in Bethlehem, 0.70” at Clinton, 0.69” in Flemington (Hunterdon), and 0.67” in Bridgewater (Somerset). The southern third and northern quarter of NJ received less than 0.30”, with a swath from southern Warren County east to Union and northern Middlesex counties receiving over 0.50” (Figure 4).
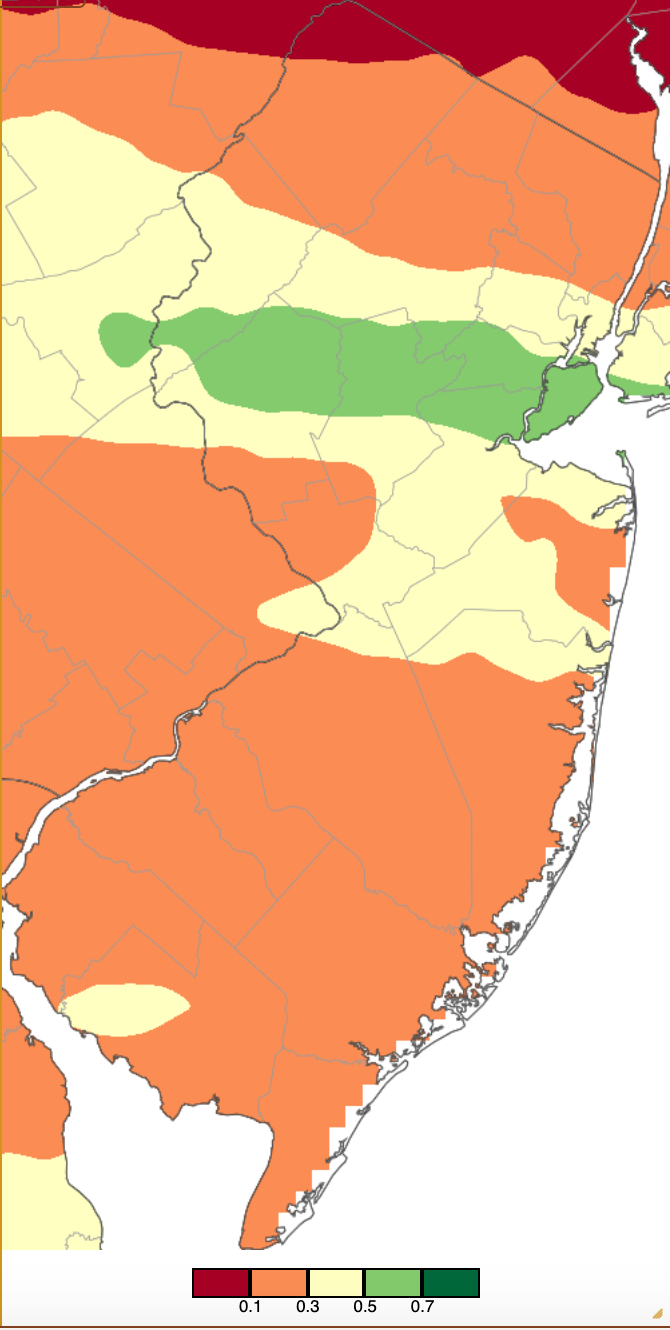
Figure 4. Precipitation across New Jersey from 7 AM on December 28th through 7 AM on December 30th based on a PRISM (Oregon State University) analysis generated using NWS Cooperative and CoCoRaHS observations. Note the scale in inches beneath the map.
The highest barometric pressure of December was reached on the 15th with readings across NJ in the 30.60”–30.70” range. The lowest pressure was 29.45”–29.50” on the 25th. In addition to the wind gusts mentioned in the squall on the 6th, ten other days saw NJWxNet stations gusting over 40 mph. The High Point Monument station, the rooftop of NJ if you will, was included on all but one of these days. HPM reached 51 mph on the 2nd, with four stations from 42–43 mph. The 3rd found HPM up to 52 mph while at sea level, Harvey Cedars peaked at 44 mph. The 7th saw Harvey Cedars up to 54 mph, Mullica (Atlantic) 41 mph, and Little Egg Harbor Township (Ocean) 40 mph.
The strongest monthly gust of 63 mph hit HPM on the 12th, with nine locations 40–44 mph. HPM reached 43 mph on the 17th and 53 mph on the 19th, without another station over 39 mph. A windy 22nd saw HPM at 53 mph, Harvey Cedars, and Lower Alloways Creek Township (Salem) each at 41 mph, and Fortescue 40 mph. HPM reached 43 mph on the 23rd and 44 mph on the 26th.
Annual OverviewThe statewide annual temperature of 55.2° was 1.6° above the 1991–2020 average and tied as the third warmest since 1895 (Table 4). This century has included 15 of the 20 warmest years of the past 127, with eight within the past ten years. The 2021 average is 3.4° above the average from 1895–2021. The average maximum of 64.9° is 1.4° above average (1991–2020), ranking 7th warmest (2.9° above 1895–2021). The average minimum of 45.5° is 1.9° above average, ranking 3rd warmest (3.8° above 1895–2021).
| Rank | Year | Annual Avg. Temp. |
| 1 | 2012 | 55.9° |
| 2 | 2020 | 55.5° |
| 3 | 2021 | 55.2° |
| 3 | 1998 | 55.2° |
| 5 | 2016 | 55.0° |
| 5 | 2006 | 55.0° |
| 7 | 2011 | 54.9° |
| 8 | 2010 | 54.7° |
| 9 | 2017 | 54.6° |
| 10 | 1990 | 54.5° |
Annual precipitation averaged 47.98”, which is 0.42” above the 1991–2020 normal and ranks 40th wettest. The southern portion of NJ (Middlesex to Mercer and all counties south of there, excepting coastal areas east of the Garden State Parkway) averaged 45.71” for 2021. This is 1.17” below average and ranks as the 53rd wettest on record. Looking more closely within that region, the far southeast and southwest areas were the driest, with the central coast and northern fringe wettest (Figure 5). The northern division averaged 51.64”. This is 2.92” above average and ranks as the 32nd wettest year out of the past 127. The coast averaged 46.14”, which is 0.44” below normal and ranks 47th wettest.
The eight wettest stations in the NJ CoCoRaHS network are found in eight different counties in the north. They include Cranford (Union) 63.64”, Bedminster (Somerset) 63.45”, Flemington (Hunterdon) 62.90”, Mine Hill Township (Morris) 62.59”, Hackettstown (Warren) 62.50”, Cedar Grove (Essex) 62.40”, Harrison (Hudson) 62.25”, and Ringwood (Passaic) 62.08”. The eight driest stations are located in four southern counties and include Wildwood Crest (Cape May) 37.89”, Upper Deerfield (Cumberland) 38.20”, Woodstown (Salem) 38.47”, Lower Township (Cape May) 39.29” and 39.39” (two stations), Franklin Township (Gloucester) 40.04”, South Harrison (Gloucester) 41.03”, and Maurice River Township (Cumberland) 41.55”.
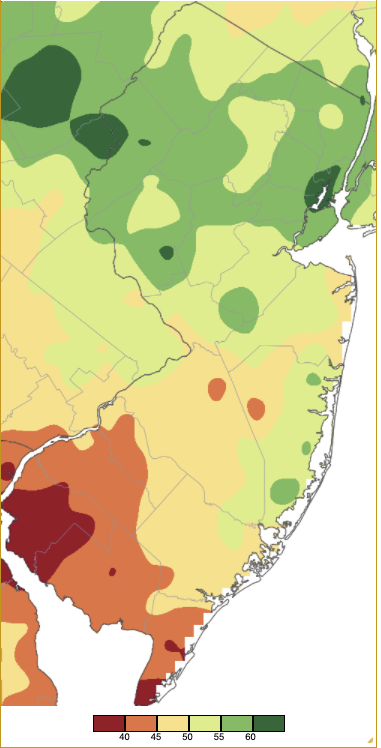
Figure 5. Annual 2021 precipitation across New Jersey based on a PRISM (Oregon State University) analysis generated using NWS Cooperative and CoCoRaHS observations. NJ totals ranged from 35.00”–40.00” (red) to 60.00”–65.00” (dark green).
For the 13th consecutive year, we in the NJ state climate office have compiled what we feel were the most significant and impactful 10 weather and climate events of 2021. Click here to view the list.
For those seeking more detailed information on 5-minute, hourly, daily, and monthly conditions, please visit the following Office of the NJ State Climatologist's websites:
Rutgers NJ Weather Network
NJ Community Collaborative Rain, Hail and Snow Network
NJ Snow Event Reports
Interested in receiving our monthly summaries at the end of each month? Send us your e-mail address here to join the mailing list.
Past News Stories

