Ida Remnants Strike New Jersey
New Jersey State Climatologist
Center for Environmental Prediction, School of Environmental and Biological Sciences/NJAES, Rutgers University
October 6, 2021
Overview
Post tropical storm Ida moved across the Garden State during the afternoon of September 1st into the early hours of the 2nd. It brought with it torrential rainfall, leading to flash and river flooding that took the lives of approximately 30 individuals and the rescue of countless more from raging waters. Additionally, it brought three tornadoes to southwestern and central areas, including the first EF-3 twister to strike New Jersey in 31 years. There were only minor injuries and no deaths from the tornadoes.
Ida’s Path
Ida developed in the Caribbean, being named a tropical storm on August 26th (Figure 1). From there, it moved northwestward, attaining hurricane status on the 27th as it passed over extreme western Cuba and moved into the Gulf of Mexico. It maintained a steady course as it strengthened into a major category 4 hurricane, making landfall in Louisiana on the 29th with sustained one-minute wind speeds as high as 150 mph. Once inland, winds diminished rather quickly but rainfall associated with the tempest remained heavy as the storm began to curve toward the northeast. This track remained quite steady as the storm weakened to a tropical depression on the 30th and became an extratropical low-pressure system as it approached the central Appalachians. On September 1st, Ida’s remnants merged with an advancing cold front as the system entered the Mid-Atlantic and crossed New Jersey before moving into southeast New England on the 2nd. Figure 2 shows the location of the low-pressure system and the associated warm and cold fronts during the late afternoon of the 1st. Tornadoes had already started to develop in Maryland and southeastern Pennsylvania, close to and just to the southeast of the low in the warm sector of the system. As the low moved across central NJ there was a disparity of temperature exceeding 10 degrees over a short distance north and south of the front (Figure 3).
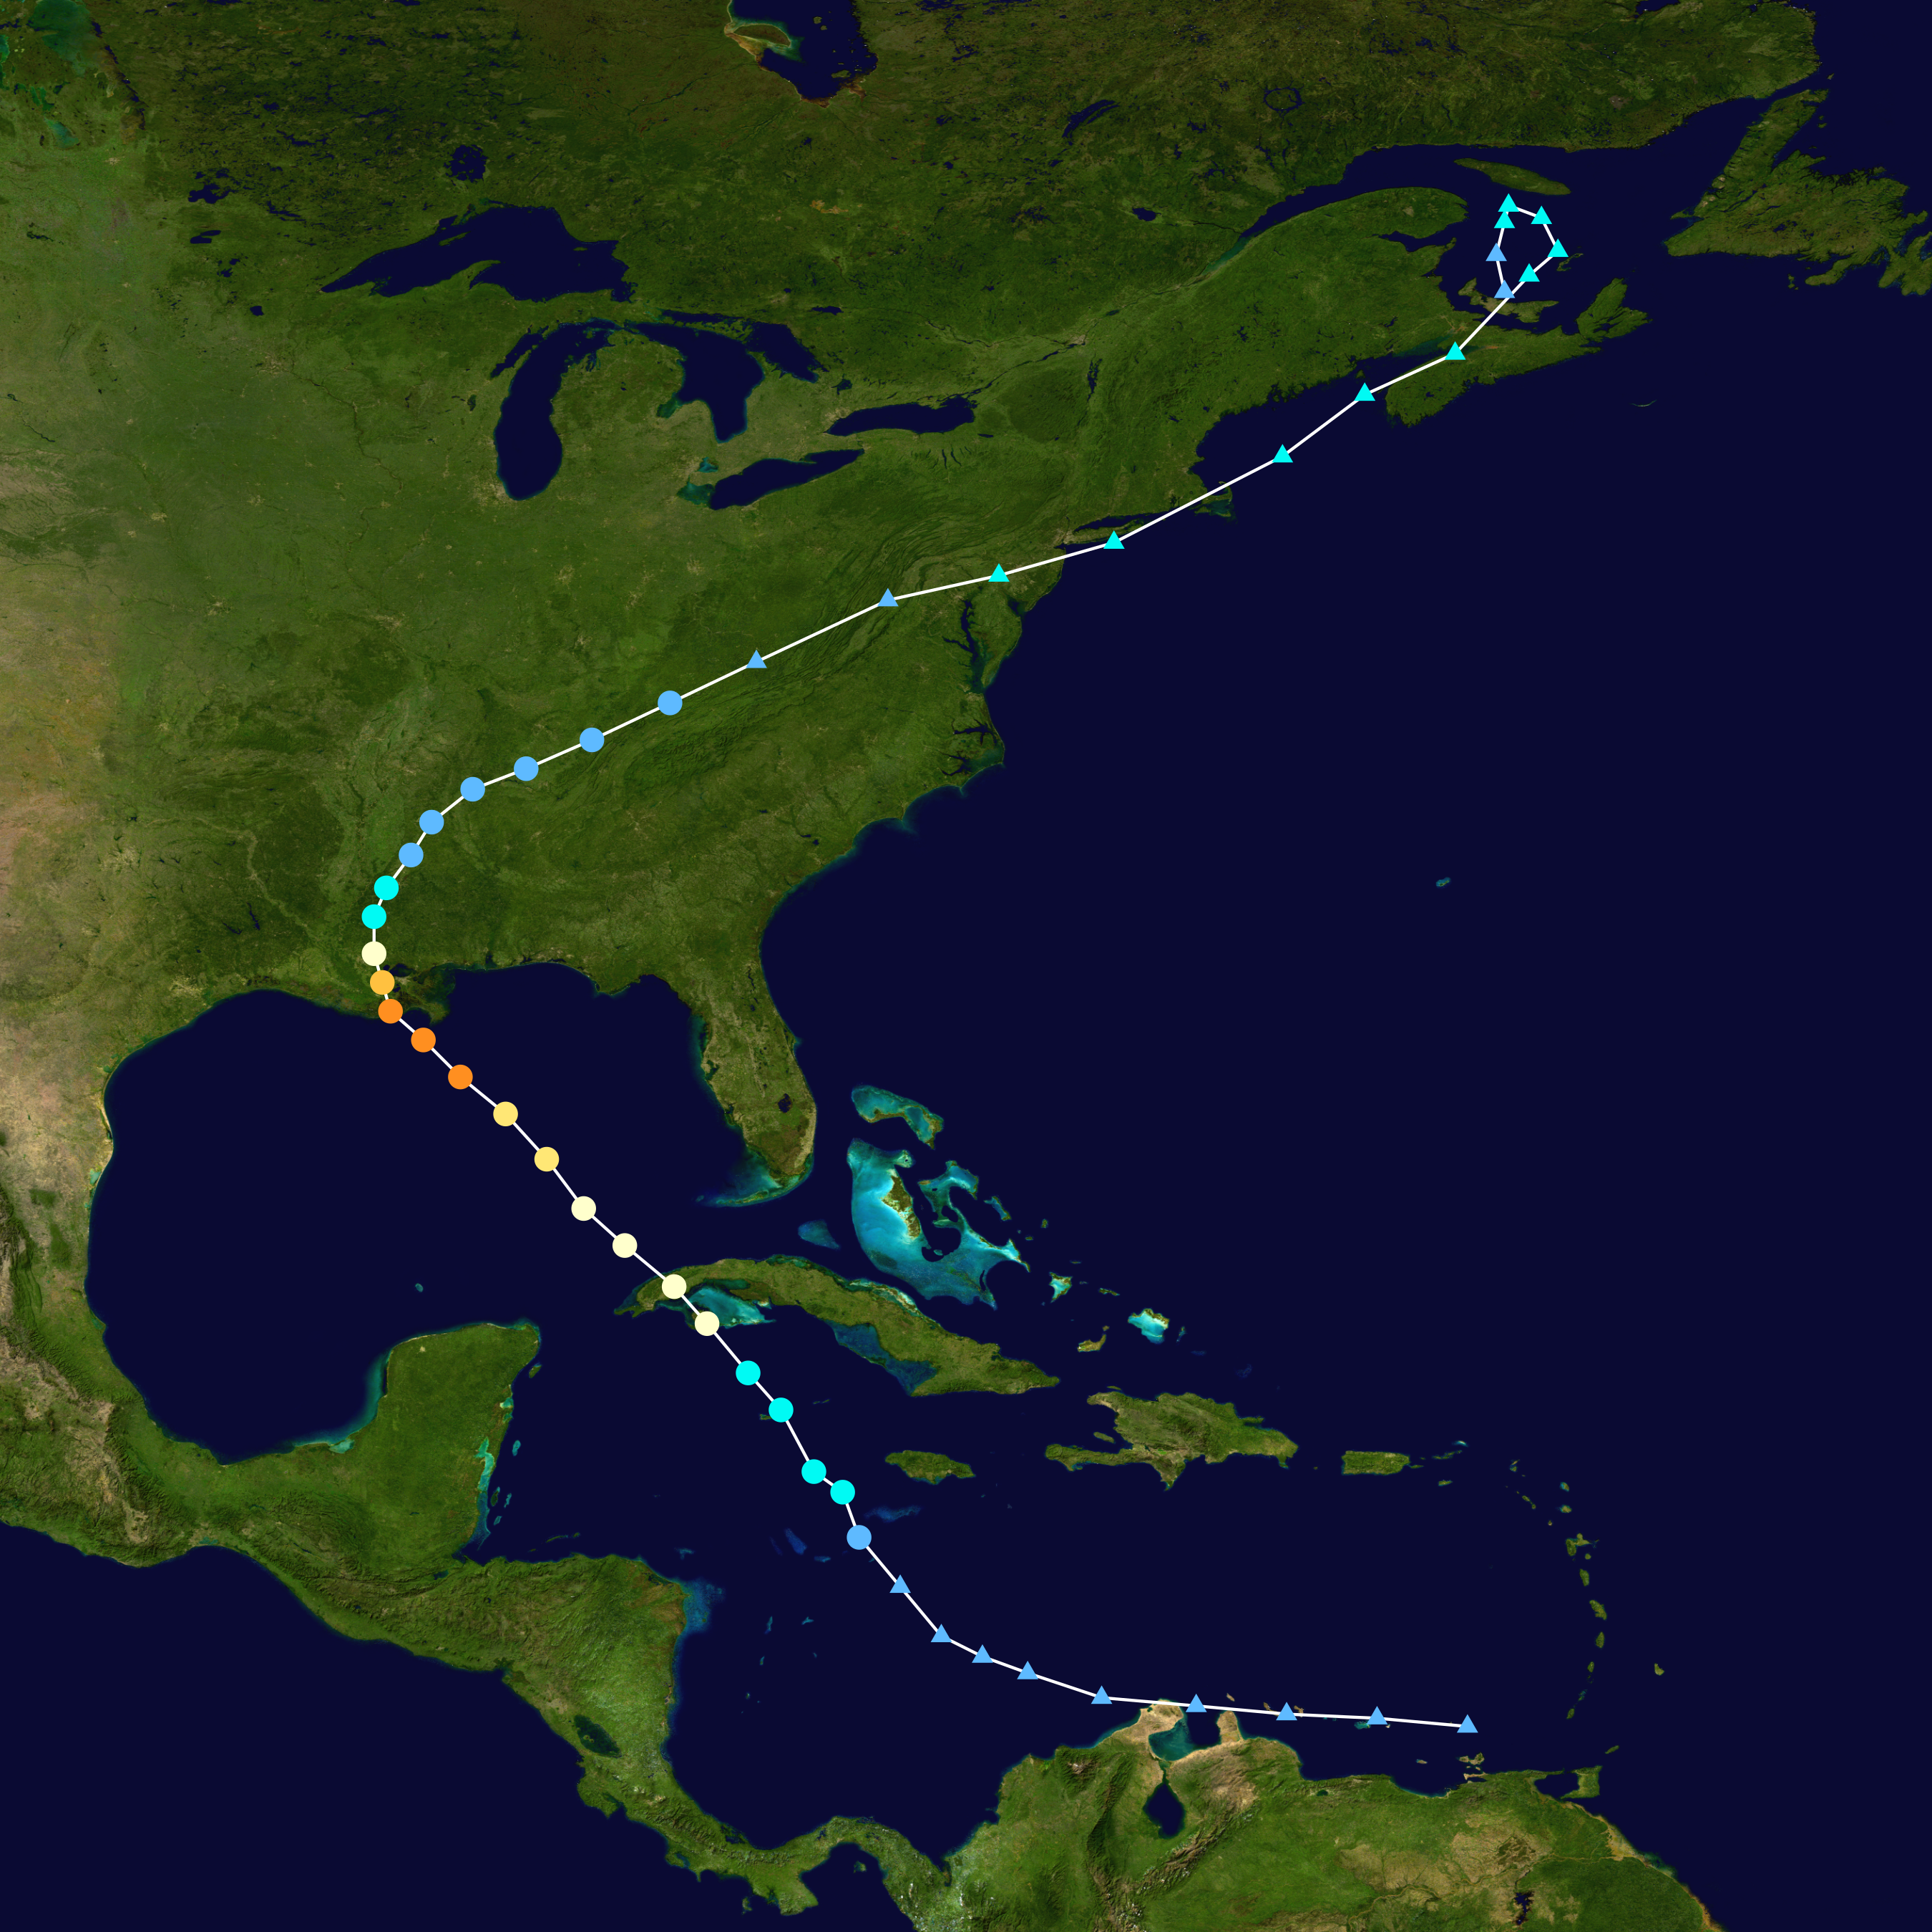
Figure 1. The path of Ida from the Caribbean into Atlantic Canada from August 23rd to September 4th. The larger circles depict locations where the system was at tropical storm or hurricane strength. The yellow and orange circles show where it was at hurricane strength, the darker orange at category 4 level (source: Wikipedia).
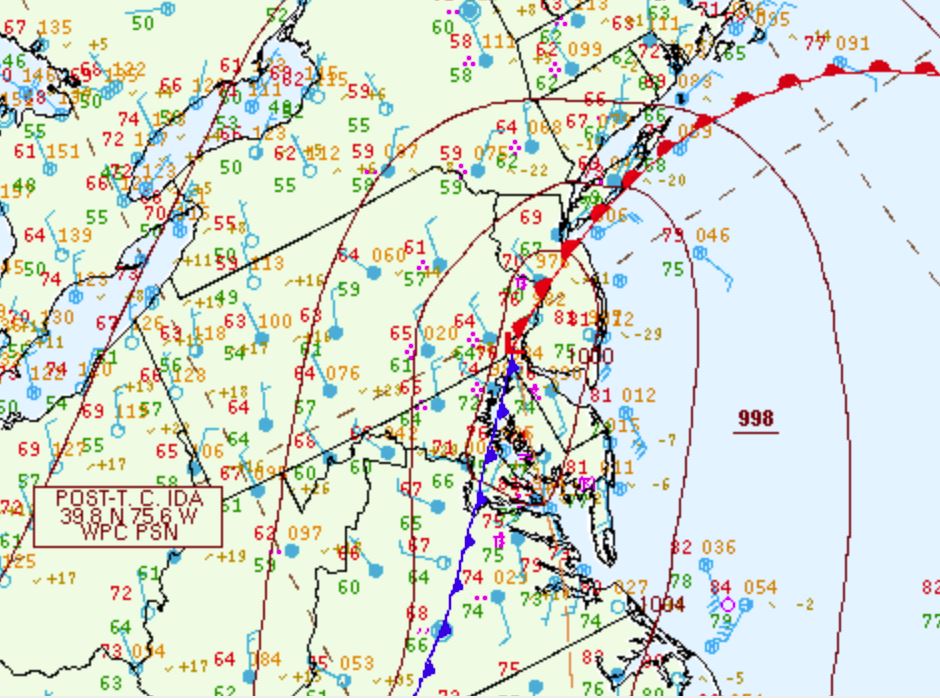
Figure 2. The location of the subtropical low (Ida remnants; red L) in the early evening of the 1st (00Z, 8:00 PM EDT). The associated warm front is in red and cold front is blue. (source: NOAA Weather Prediction Center Surface Archive Page).
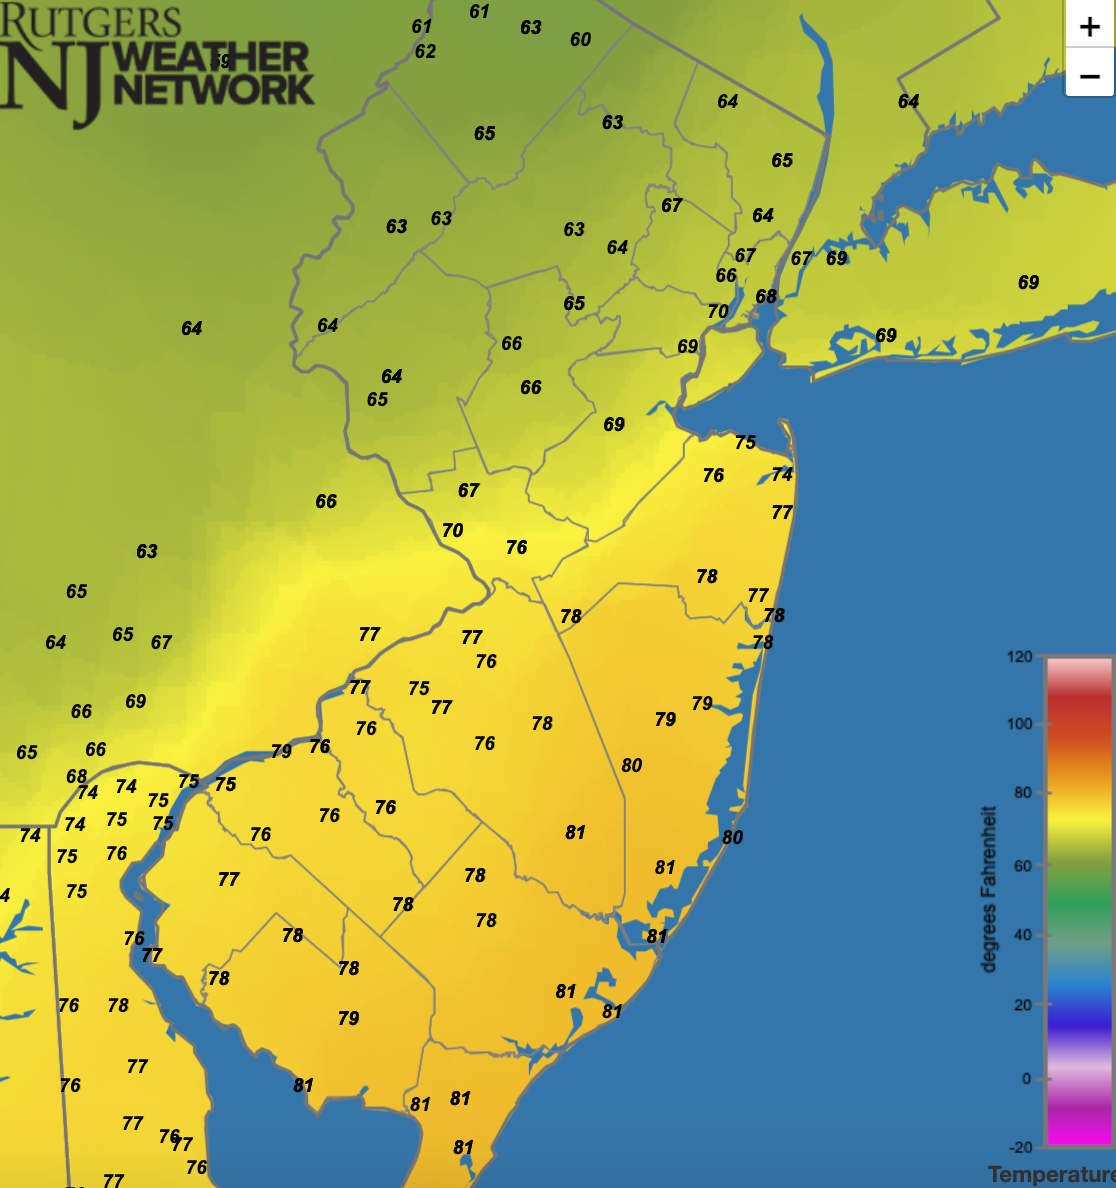
Figure 3. Surface air temperatures at 8:10 PM EDT on September 1st as the low was located directly in the center of the state and the heaviest rains were falling just to the north of the warm front in Somerset County (source: Rutgers NJ Weather Network).
NJ Tornadoes
The first of the three confirmed tornadoes to strike New Jersey during the evening of the 1st touched down in Gloucester County at 6:10 PM. It remained on the ground for 20 minutes along a 12.6-mile path. Moving northeast from Harrisonville to Deptford, it was at its strongest in the Mullica Hill vicinity where it injured two people and destroyed multiple homes (Figures 4-6). Attaining EF-3 strength with winds peaking at an estimated 150 mph, it was New Jersey’s first EF-3 (F-3) tornado since one struck Montgomery Township (Somerset) on October 18, 1990, and only the fifth since complete records commenced in 1950 (see “Tornadoes in New Jersey: 1950 to Present”).
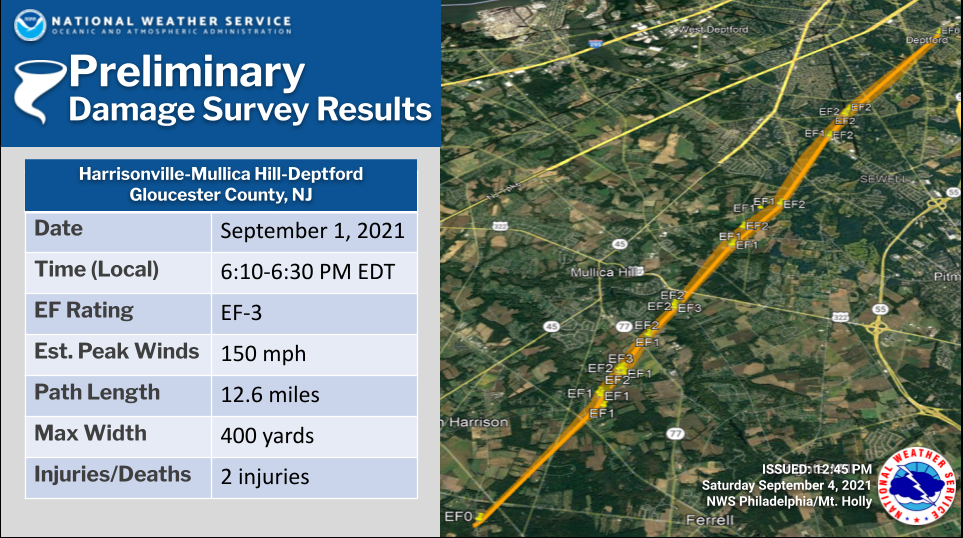
Figure 4. Preliminary National Weather Service report for the Gloucester County tornado.
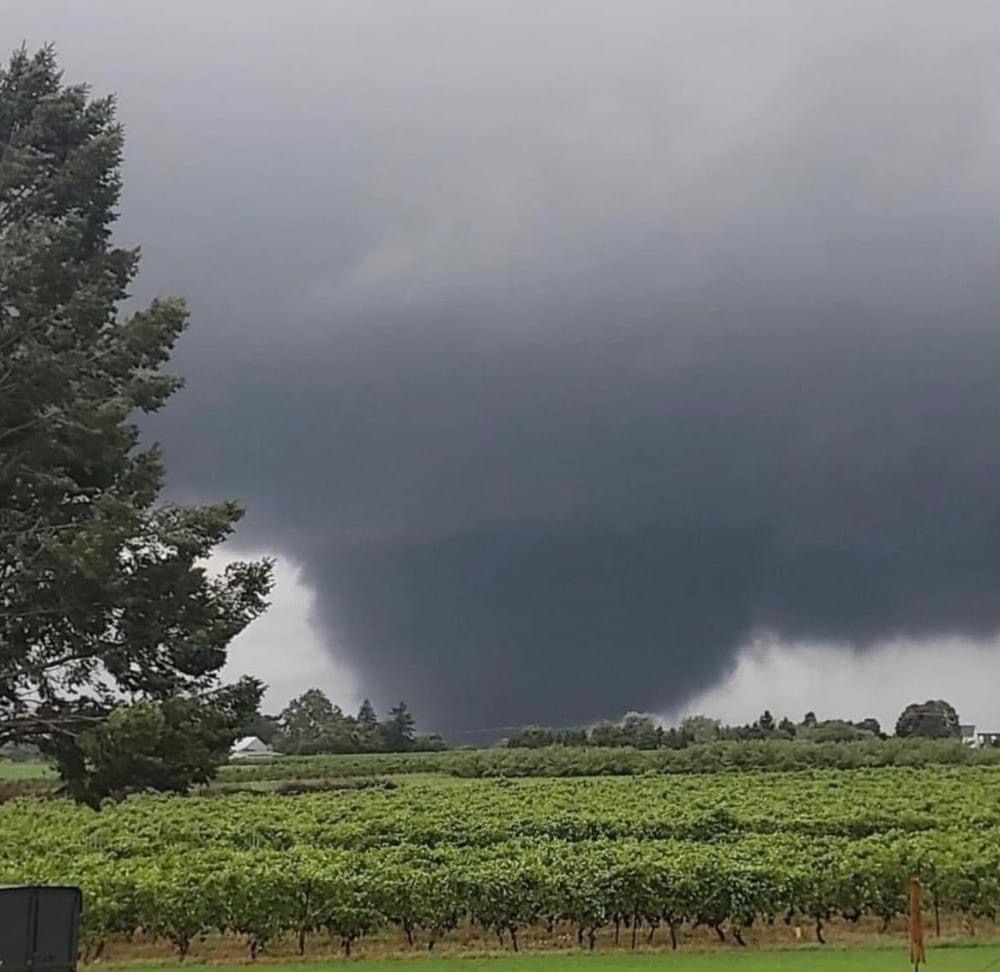
Figure 5. The September 1st Gloucester County tornado seen from the William Heritage Winery in Mullica Hill (photo credit: Anna Weis, from @NashWX).
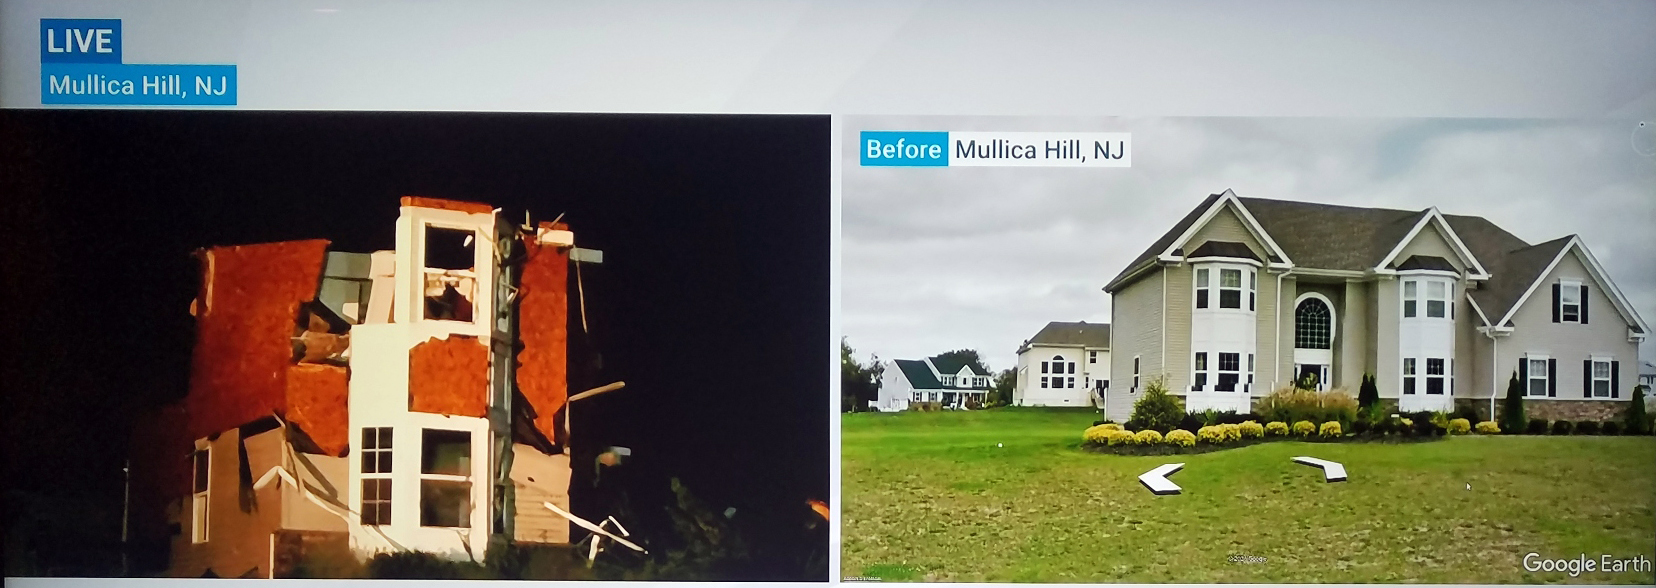
Figure 6. On the left, the remains of a home in the area of Mullica Hill where the EF-3 damage occurred earlier in the evening. The photo on the right shows the home prior to its destruction (source: The Weather Channel).
The second tornado touched down in Burlington Township (Burlington County) at 6:59 PM. It moved northeast into Burlington (Burlington) before crossing over the Delaware River and Burlington-Bristol Bridge and dissipating in Bucks County, PA at 7:04 PM (Figure 7). No injuries were reported from this EF-1 twister that had estimated peak winds of 90 mph.
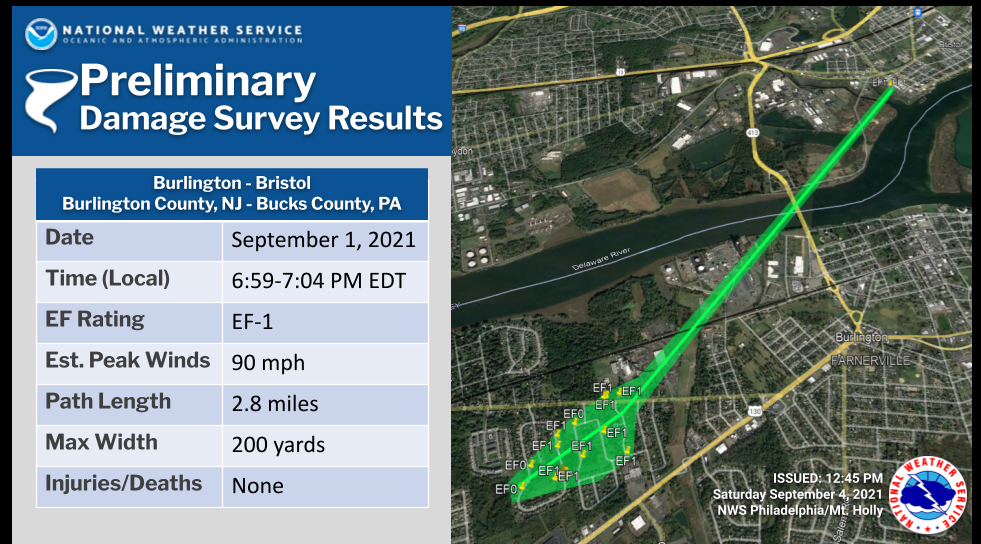
Figure 7. Preliminary National Weather Service report for the Burlington County tornado.
The third New Jersey tornado was rated EF-0 with estimated peak winds of 75 mph. It moved through a portion of West Windsor Township (Mercer) from 7:32–7:35 PM (Figure 8). No injuries were reported along its 2.73-mile path.
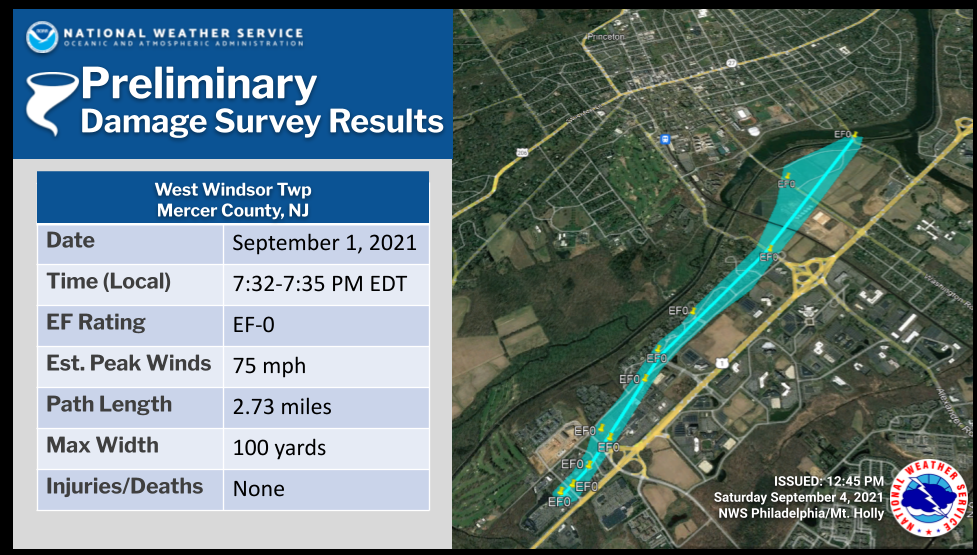
Figure 8. Preliminary National Weather Service report of the Mercer County tornado.
Outside of the three tornadoes associated with the storm, straight-line winds gusted to 53 mph at Hillsborough, 47 mph in Fortescue (Cumberland), 46 mph at Harvey Cedars (Ocean), 45 mph in Berkeley Township (Ocean), and 40–44 mph at nine other NJWxNet stations. There were no reports of damage or power outages associated with these winds.
NJ Rainfall
All of the state received rainfall from Ida, with every county having at least one station recording 1.98” (Woodstown, Salem County) or more, with the exception of Cape May County where Dennis Township received a county maximum of 0.98” (Figure 9, Table 1). All of NJ within and north of the Route 1 corridor received at least 4.00”. The heaviest band extended from northern Mercer and most of Hunterdon counties northeast to northern Middlesex County and up through most of Bergen County. Here, peak totals exceeded 8.00” within eight counties, including 9.13” in Hopewell Township (Mercer), Flemington (Hunterdon) 9.20”, Hillsborough (Somerset) 9.45”, New Brunswick (Middlesex) 8.44”, Newark Airport (Union) 8.44”, Maplewood (Essex) 8.39”, Harrison (Hudson) 8.72”, and North Arlington (Bergen) 9.02”. A table of the nearly 370 rainfall observations gathered across New Jersey and passing quality assessment may be accessed here.
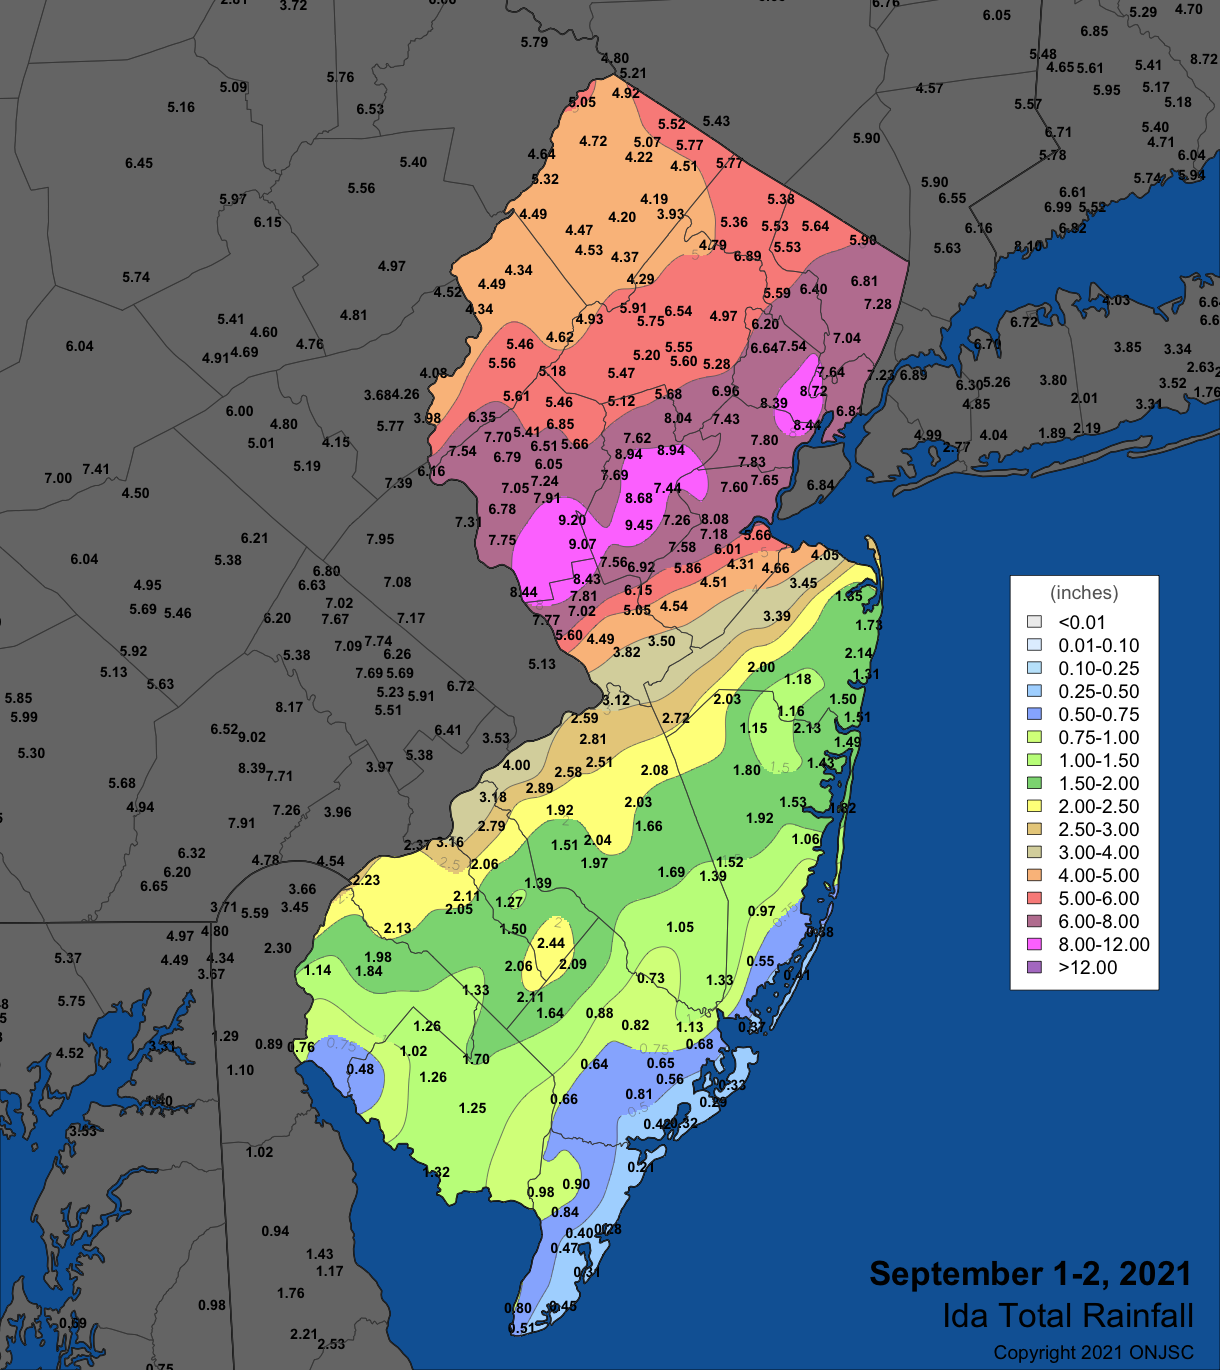
Figure 9. September 1st–2nd rainfall in NJ and surrounding states based on observations from Rutgers NJ Weather Network, NJ CoCoRaHS, National Weather Service Cooperative stations, and observations from several other networks. Around 370 NJ observations were used to generate the map. Not all observations that went into the colored contouring in NJ are shown to avoid overlapping values.
| County | Location | Rainfall |
| Atlantic | Hammonton | 2.22” |
| Bergen | North Arlington | 9.02” |
| Burlington | Riverside Township | 4.00” |
| Camden | Pennsauken | 3.49” |
| Cape May | Dennis Township | 0.98” |
| Cumberland | Deerfield Township | 1.71” |
| Essex | Maplewood | 8.39” |
| Gloucester | West Deptford | 3.16” |
| Hudson | Harrison | 8.72” |
| Hunterdon | Flemington | 9.20” |
| Mercer | Hopewell Township | 9.13” |
| Middlesex | New Brunswick | 8.44” |
| Monmouth | Middletown | 4.05” |
| Morris | Long Hill Township | 7.65” |
| Ocean | Toms River | 2.66” |
| Passaic | Little Falls | 7.14” |
| Salem | Woodstown | 1.98” |
| Somerset | Hillsborough | 9.45” |
| Sussex | Vernon Township | 5.77” |
| Union | Newark Airport | 8.44” |
| Warren | Greenwich Township | 6.63” |
Table 1. The heaviest rainfall observed from on September 1st–2nd in all NJ counties based on observations from Rutgers NJ Weather Network, NJ CoCoRaHS, National Weather Service Cooperative stations, and observations from several other networks.
Not only were the totals in the north equal to one to two times the normal rainfall for the entire month of September, but the bulk of the rain at individual locations fell within a six-hour interval. Maps and tables follow that report the peak one-hour, two-hour, three-hour, and six-hour rainfall totals at some point during the storm as recorded at Rutgers New Jersey Weather Network (NJWxNet) stations and the National Weather Service (NWS) Newark Airport (Union) station. These maps do not depict a specific hour across the state as a whole; the totals show the most that fell during a selected interval at each station at any time during the event. They are based on analyses of data gathered at five-minute intervals, thus calculated from the largest consecutive 12, 24, etc. 5-minute observations. Additional information is also provided for one-hour and three-hour maxima.
Peak one-hour rainfall exceeded 2.50” at 10 stations, the largest total of 3.65” observed at Newark Airport (Figure 10, Table 2). These totals fell to below an inch within 10 to 20 miles to the northwest and south of the heaviest band through the aforementioned central to northeast zone, with the exception of some 1.00”+ totals in the southwest. The average recurrence interval (ARI, also referred to as “return period”) of the 2.50”+ observations was estimated using NOAA Atlas 14. This was done by selecting the closest mid-point of the 90% confidence intervals for a given duration and using its ARI estimate (or including a range of ARIs if a given precipitation amount fell exactly between two mid-points, such as for Basking Ridge’s 2.27” hourly total). ARI values ranged from 1,000 years at Newark to 25 years at Ramsey (Bergen), with five of the ten stations exceeding 100 years. Within the 2.50”+ band, there was an approximate three-hour difference in the timing of the peak hourly value, ranging from 5:45–6:45 PM in the west at Kingwood (Hunterdon) to 9:05–10:05 PM in the northeast at Haworth (Bergen). The table was designed to show the progressive sequence of timing from west to east. This is also depicted in map form in Figure 11.
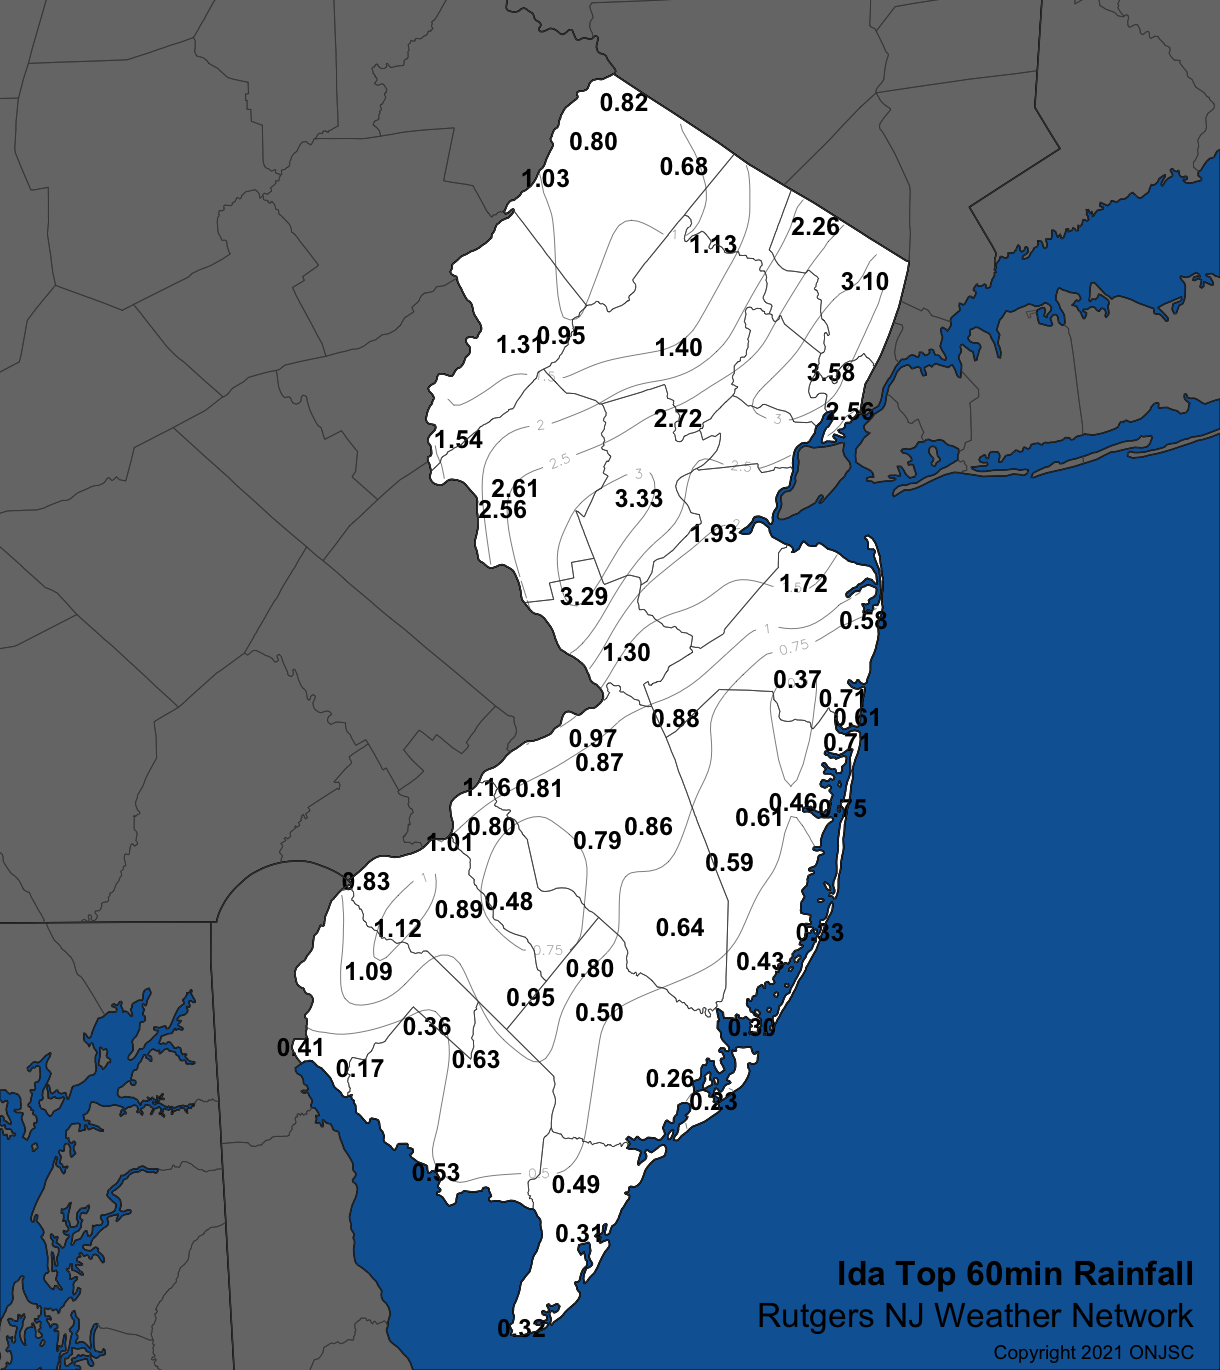
Figure 10. Peak one-hour rainfall across NJ based on observations from Rutgers NJWxNet stations and the Newark Airport NWS station. See the text for further explanation of how values were calculated.
| Station | County | Peak 1-hr precip | Hour ending | ARI |
| Kingwood | Hunterdon | 2.56" | 6:45 PM | 50 yrs |
| Pittstown | Hunterdon | 2.61" | 6:55 PM | 50 yrs |
| Hopewell Twp. | Mercer | 3.29" | 7:55 PM | 200 yrs |
| Hillsborough-Duke | Somerset | 3.33" | 8:40 PM | 500 yrs |
| Basking Ridge | Somerset | 2.72" | 8:55 PM | 50-100 yrs |
| Newark Airport | Union | 3.65" | 9:10 PM | 1000 yrs |
| Ramsey | Bergen | 2.26" | 9:20 PM | 25 yrs |
| Lyndhurst | Bergen | 3.58" | 9:30 PM | 500 yrs |
| Jersey City | Hudson | 2.56" | 9:55 PM | 50 yrs |
| Haworth | Bergen | 3.10" | 10:05 PM | 200 yrs |
Table 2. Peak one-hour rainfall totals at Rutgers NJWxNet stations and the Newark Airport NWS station that had a total exceeding 2.00”. Also included is the ending time of the last five-minute interval of the hour and the average recurrence interval (ARI).
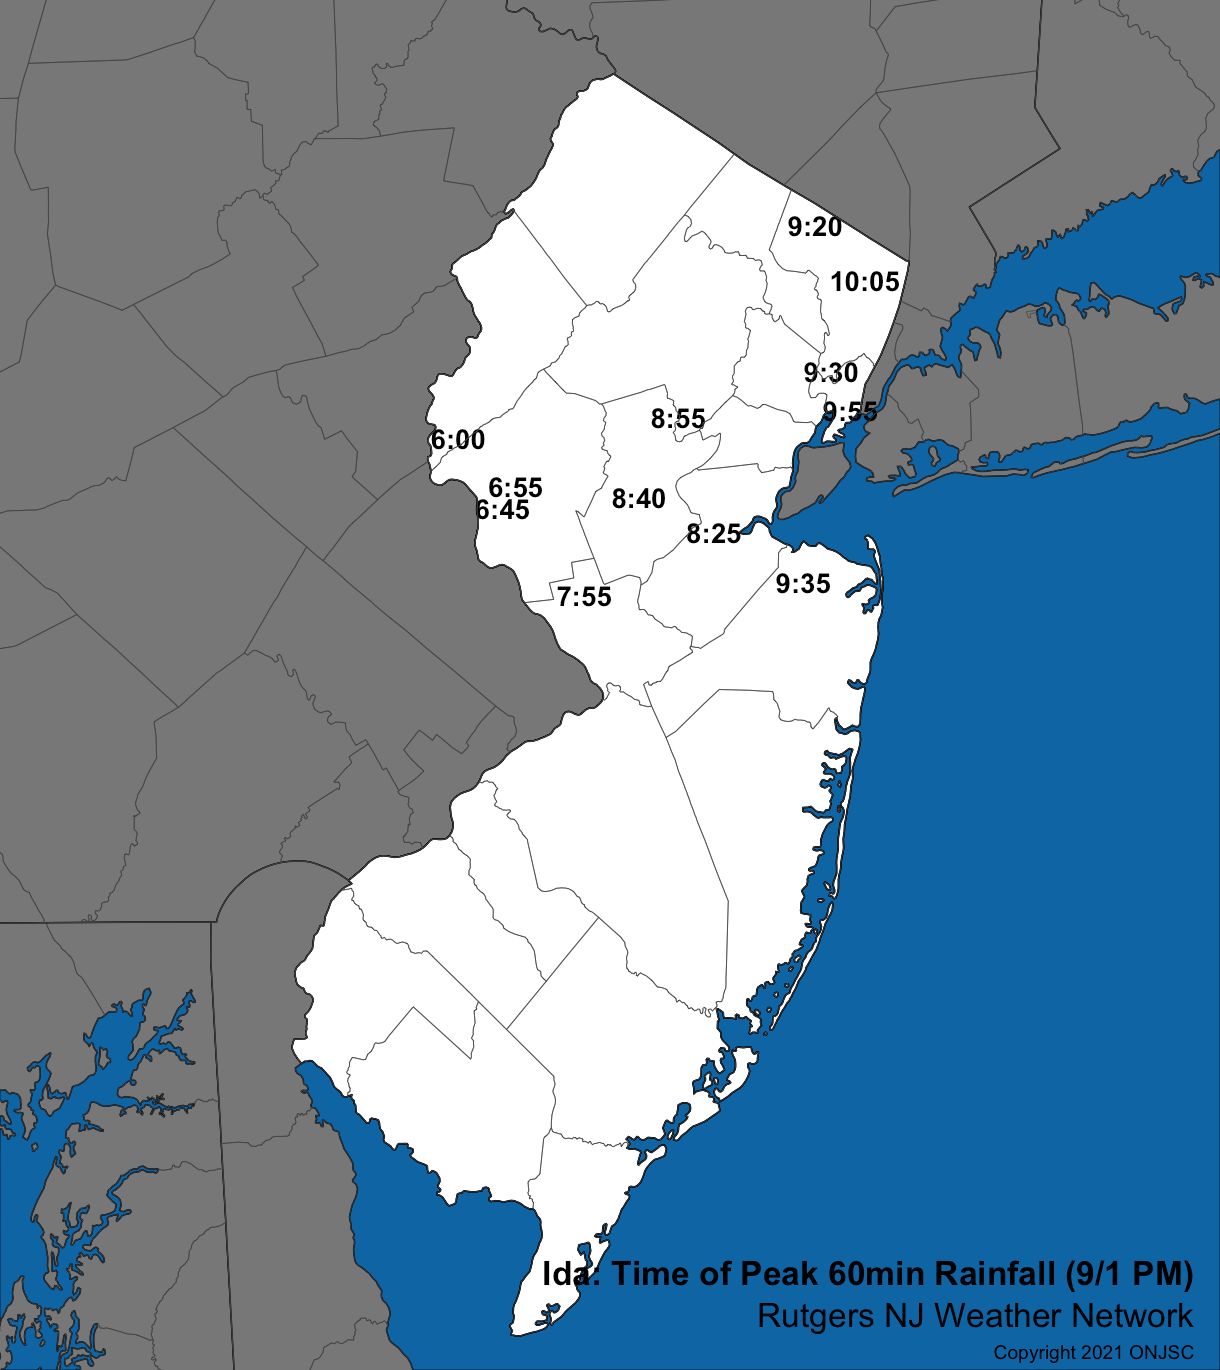
Figure 11. Time (PM) of the end of the heaviest hourly rainfall total at NJWxNet stations that received at least 1.50” in an hour.
Peak two-hour totals exceeded 3.00” at 11 stations (Figure 12, Table 3). Totals were above 1.00” at most other locations away from the coast and far south. Six of the top eleven exceeded 4.00”, or approximately a month or more of normal rainfall in this short interval. There was a narrow band exceeding 5.00” from Hopewell Township (Mercer) to Hillsborough-Duke (Somerset) to Newark Airport. These three stations had ARIs of at least 1,000 years, with the other 11 running from 50 to 500 years. As with the hourly timing, there was a west-to-east progression of the timing differing by upwards of four hours.
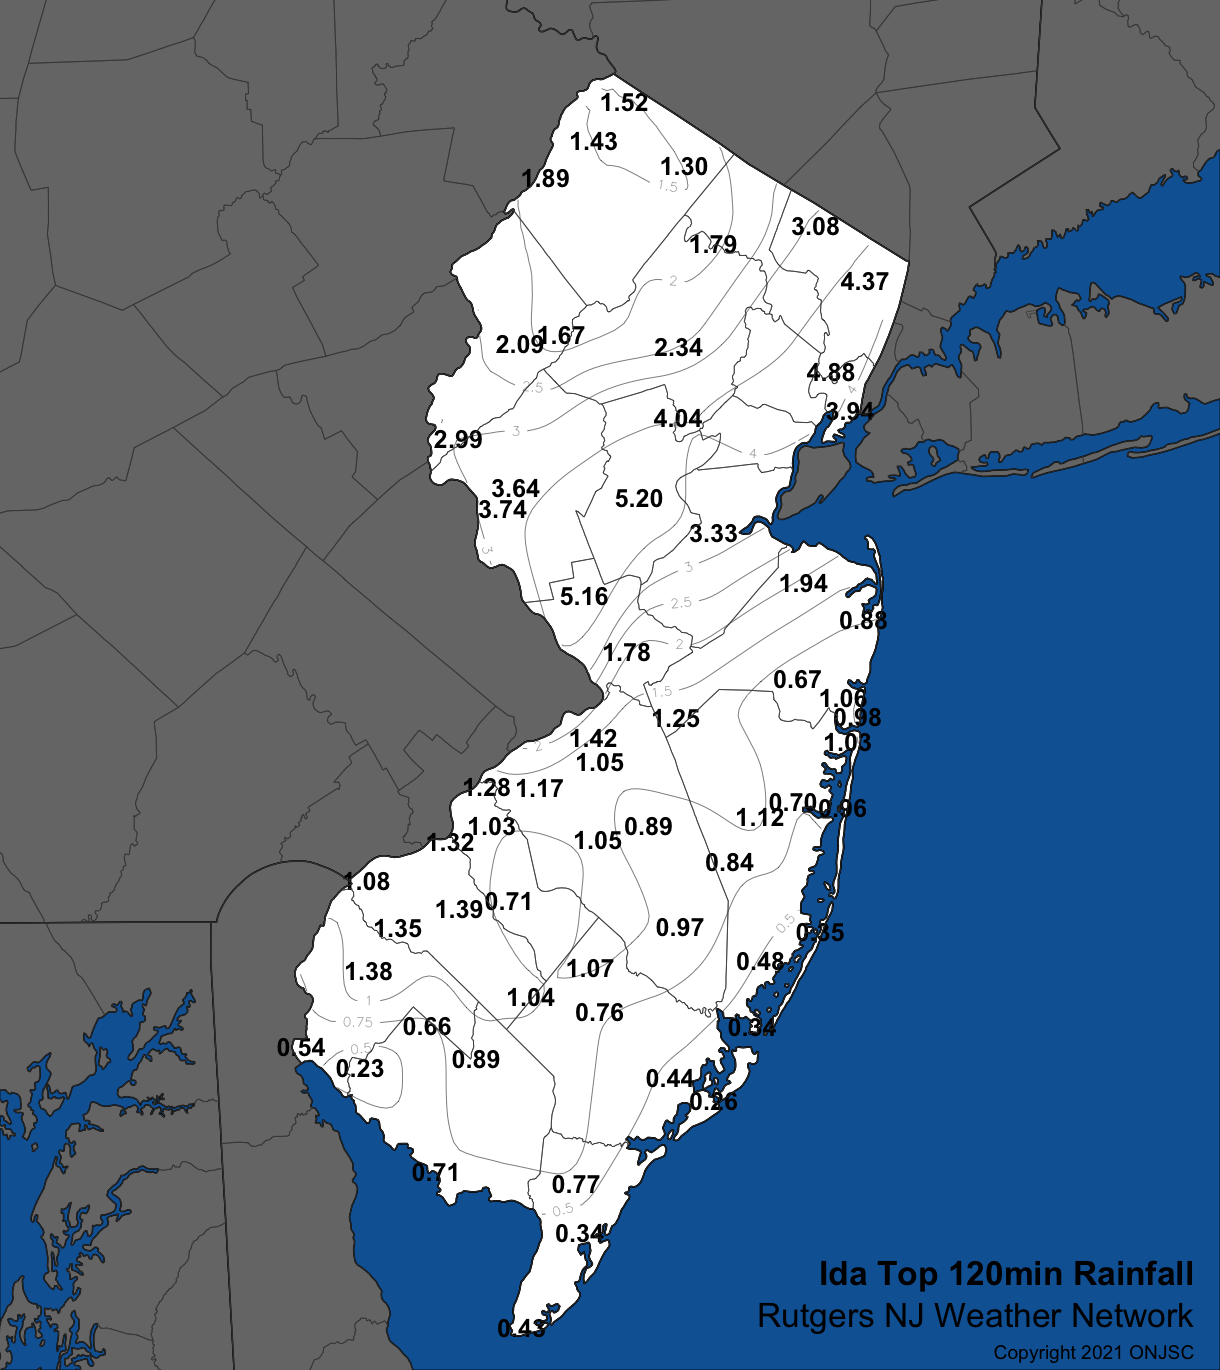
Figure 12. Peak two-hour rainfall across NJ based on observations from Rutgers NJWxNet stations and the Newark Airport NWS station. See the text for further explanation of how values were calculated.
| Station | County | Peak 2-hr precip | Hour ending | ARI |
| Kingwood | Hunterdon | 3.74" | 7:00 PM | 100 yrs |
| Pittstown | Hunterdon | 3.64" | 7:15 PM | 100 yrs |
| Hillsborough-Duke | Somerset | 5.20" | 8:40 PM | 1000 yrs |
| Hopewell Twp. | Mercer | 5.16" | 8:40 PM | 1000 yrs |
| Basking Ridge | Somerset | 4.04" | 8:55 PM | 200 yrs |
| Newark Airport | Union | 5.47" | 9:25 PM | 1000+ yrs |
| Lyndhurst | Bergen | 4.88" | 9:30 PM | 500 yrs |
| New Brunswick | Middlesex | 3.33" | 9:40 PM | 50 yrs |
| Ramsey | Bergen | 3.08" | 9:50 PM | 50 yrs |
| Haworth | Bergen | 4.37" | 10:20 PM | 500 yrs |
| Jersey City | Hudson | 3.94" | 10:55 PM | 200 yrs |
Table 3. Peak two-hour rainfall totals at Rutgers NJWxNet stations and the Newark Airport NWS station that had a total exceeding 3.00”. Also included is the ending time of the last five-minute interval of the two hours and the average recurrence interval (ARI).
The relentless nature of the deluge was apparent in the massive three-hour accumulations that exceeded 3.50” at 13 stations (Figure 13, Table 4). Six of these locations came in at 4.98” or higher, led by Hillsborough-Duke with 6.50” and Newark Airport with 6.43”. Recurrence intervals were 500 years or higher at these six (Table 4). Three-hour totals exceeding 2.00” were only observed in an area just to the south of the heaviest band and over almost all of the region to its northwest. A NWS map of three-hour exceedance probabilities across the Mid-Atlantic and southern New England illustrates that while New Jersey was the focal point of the heaviest totals, southeastern Pennsylvania, New York City, Westchester County, NY, and portions of coastal Connecticut also experienced recurrence intervals of 500 years or greater (Figure 14).
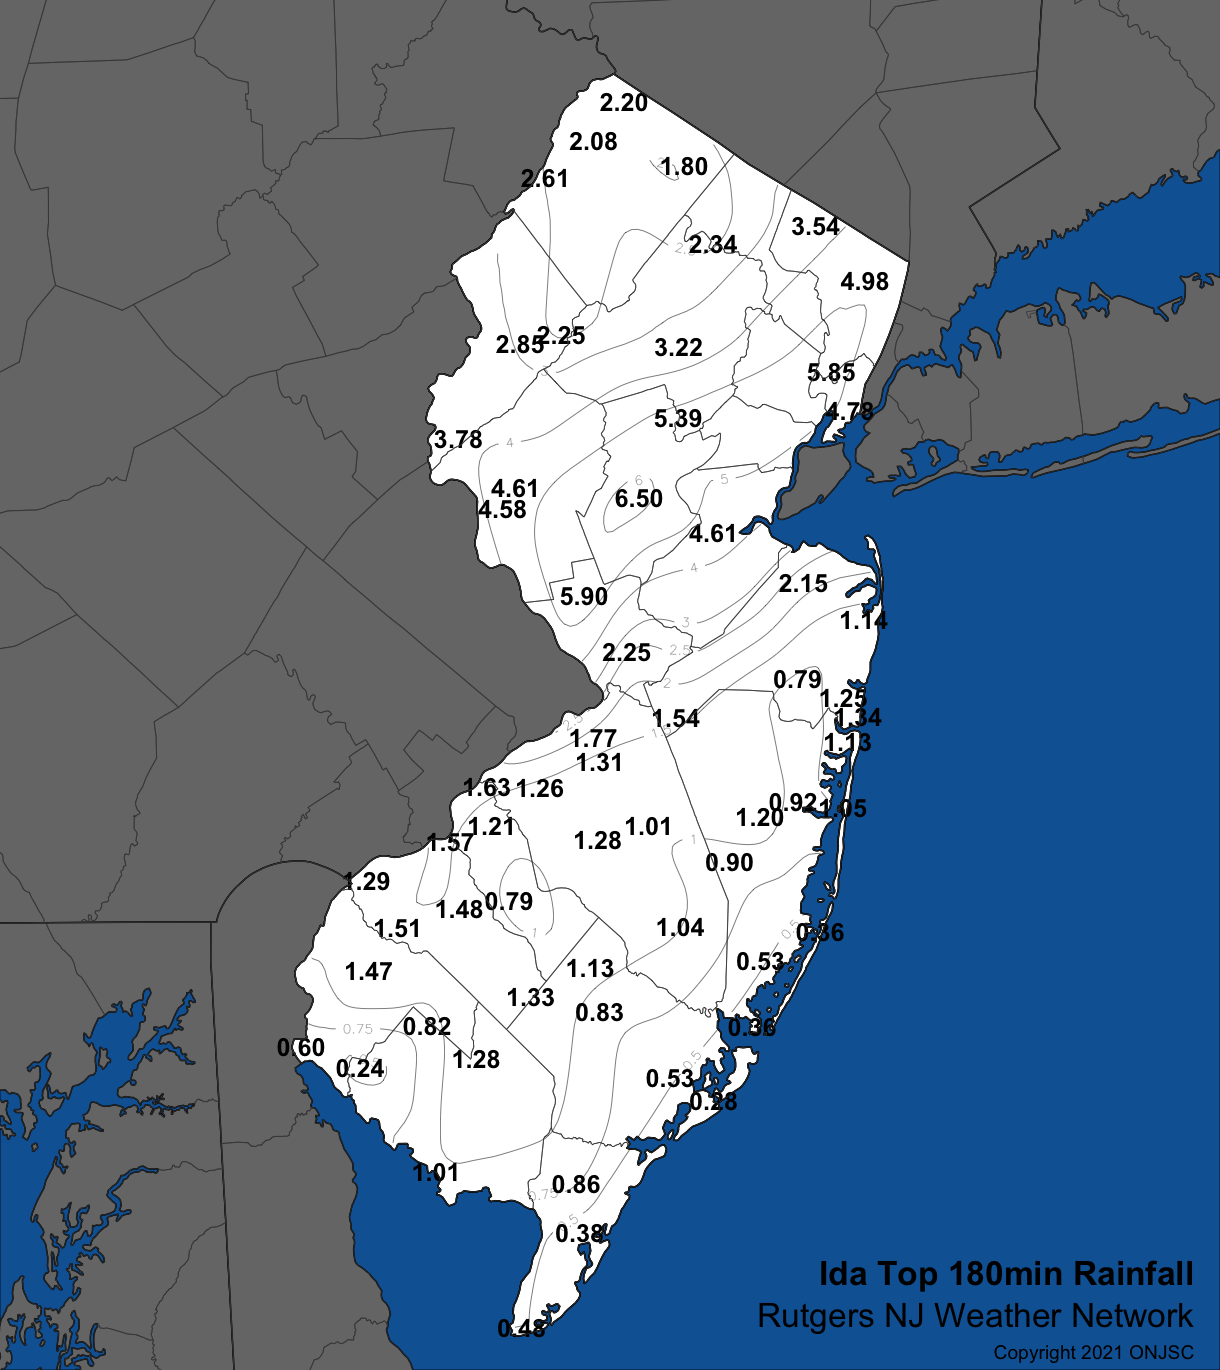
Figure 13. Peak three-hour rainfall across NJ based on observations from Rutgers NJ Weather Network stations and the Newark Airport NWS station. See the text for further explanation of how values were calculated.
| Station | County | Peak 3-hr precip | Hour ending | ARI |
| Stewartsville | Warren | 3.78" | 7:50 PM | 50 yrs |
| Kingwood | Hunterdon | 4.58" | 7:55 PM | 200 yrs |
| Pittstown | Hunterdon | 4.61" | 8:05 PM | 200 yrs |
| Hopewell Twp. | Mercer | 5.90" | 8:55 PM | 1000 yrs |
| Hillsborough-Duke | Somerset | 6.50" | 9:10 PM | 1000+ yrs |
| Basking Ridge | Somerset | 5.39" | 9:25 PM | 500 yrs |
| Newark Airport | Union | 6.43" | 9:30 PM | 1000+ yrs |
| New Brunswick | Middlesex | 4.61" | 9:45 PM | 200 yrs |
| East Brunswick | Middlesex | 4.09" | 9:50 PM | 100 yrs |
| Lyndhurst | Bergen | 5.85" | 9:55 PM | 1000 yrs |
| Haworth | Bergen | 4.98" | 10:20 PM | 500 yrs |
| Ramsey | Bergen | 3.54" | 10:40 PM | 50 yrs |
| Jersey City | Hudson | 4.78" | 10:55 PM | 200 yrs |
Table 4. Peak three-hour rainfall totals at Rutgers NJWxNet stations and the Newark Airport NWS station that had a total exceeding 3.50”. Also included is the ending time of the last five-minute interval of the three hours and the average recurrence interval (ARI).
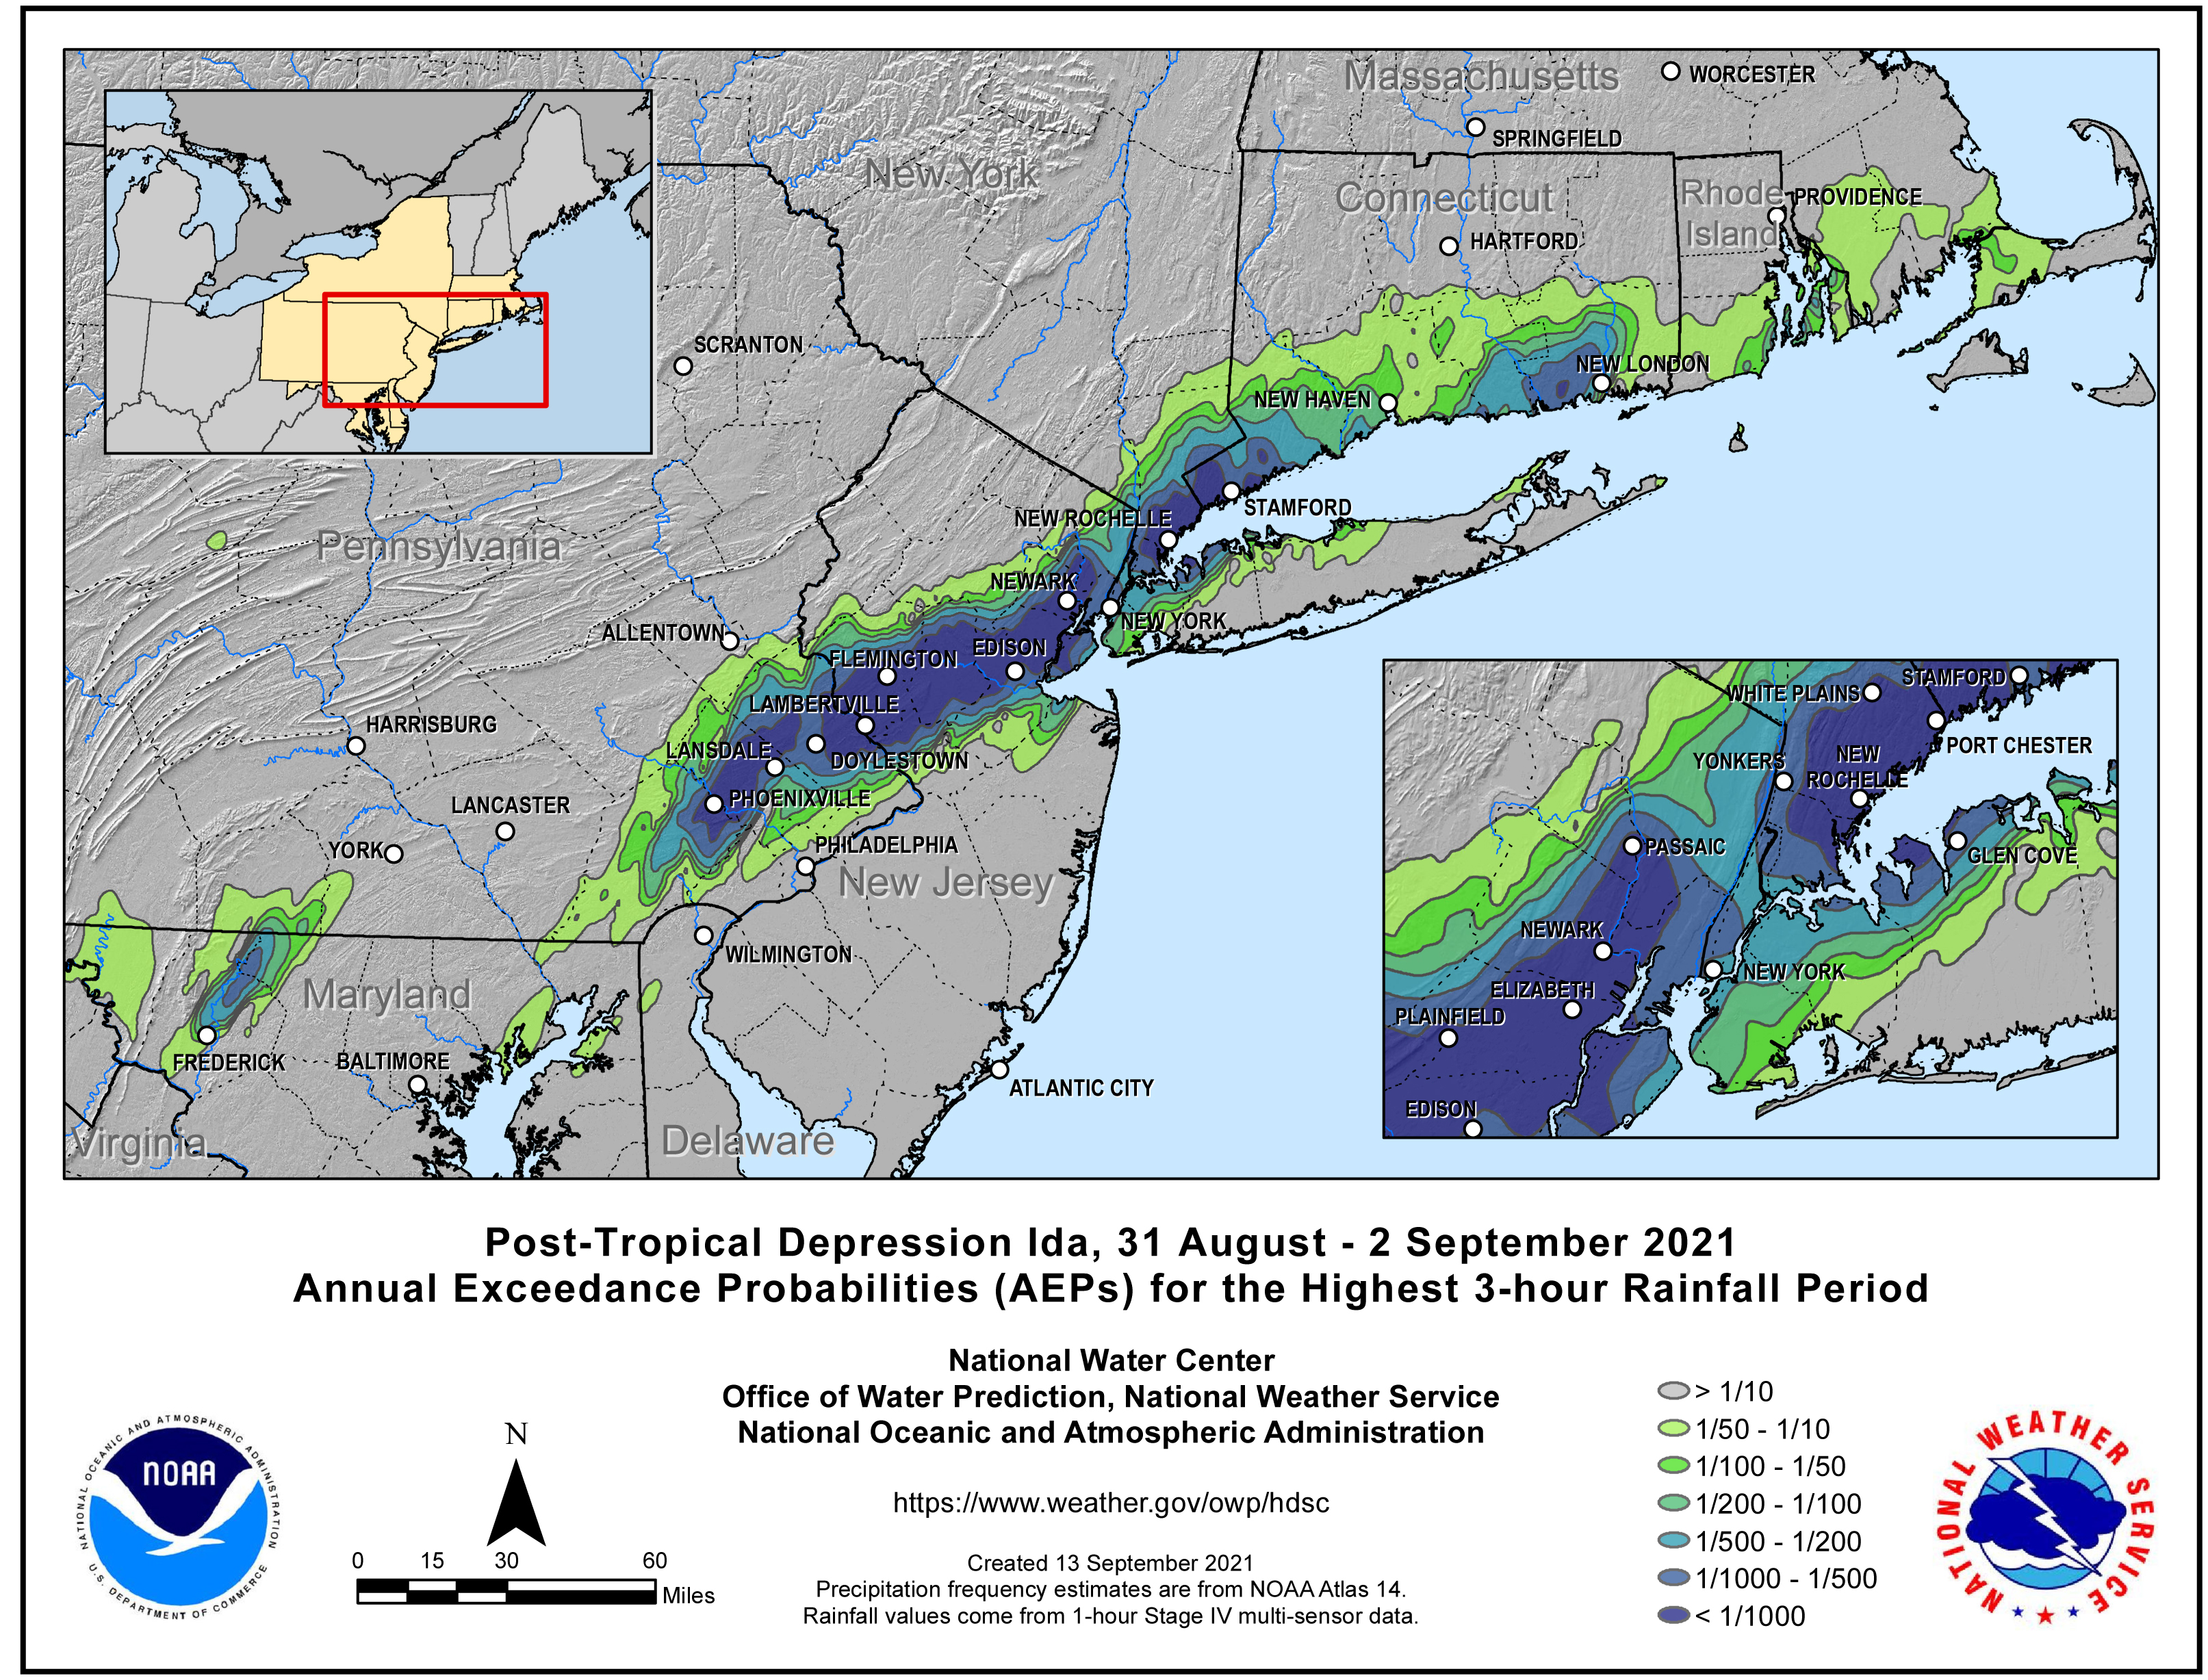
Figure 14. Annual exceedance probabilities (the same as ARI, except showing the probability of such an event occurring in a given year) for the highest three-hour rainfall interval as mapped by the National Weather Service.
As mentioned previously, the bulk of the storm’s rainfall occurred over a six-hour interval. Thus, six-hour totals shown in Figure 15 are similar to those found in Figure 9. The largest six-hour totals included 13 stations exceeding 5.00”, all but one with recurrence intervals of 200 years or greater (Table 5). Again, it was Hillsborough-Duke (8.10”) and Newark Airport (7.98”) topping the list, each with a 1,000-year recurrence expectation. Timing of the ending of this interval was more tightly packed than the shorter intervals, ranging from 10:15 PM in the west to midnight in the northeast.
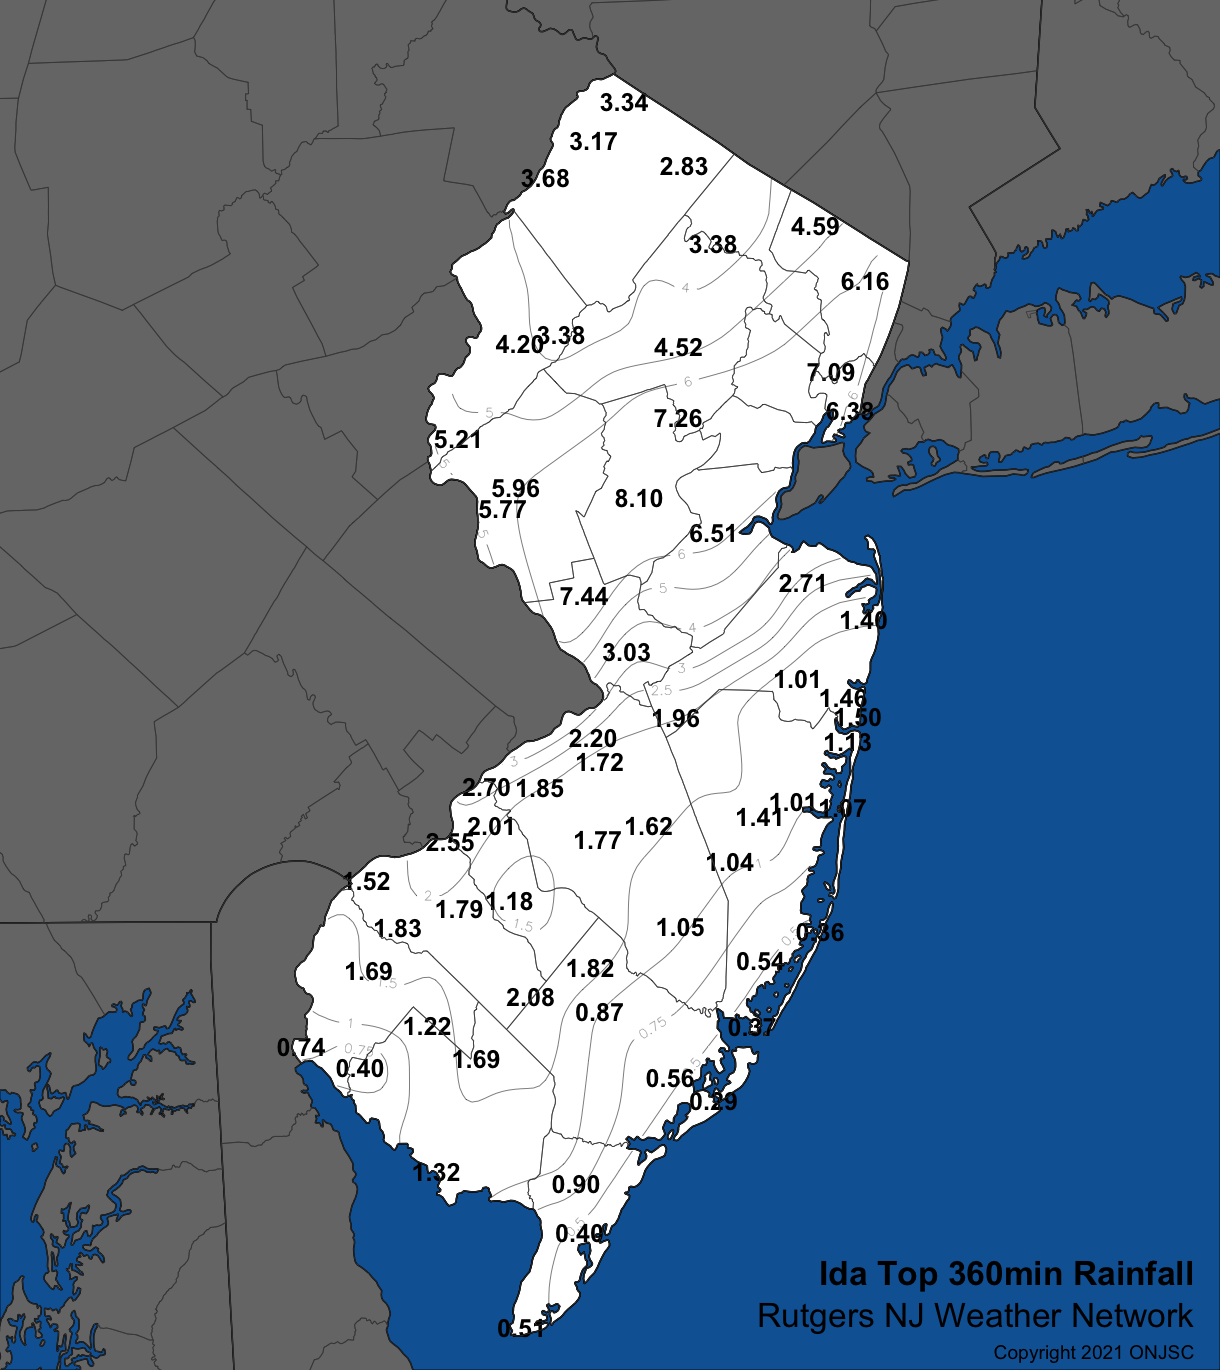
Figure 15. Peak six-hour rainfall across NJ based on observations from Rutgers NJ Weather Network stations and the Newark Airport NWS station. See the text for a further explanation of how values were calculated.
| Station | County | Peak 6-hr precip | Hour ending | ARI |
| Stewartsville | Warren | 5.21" | 10:15 PM | 100 yrs |
| Hopewell Twp. | Mercer | 7.44" | 10:35 PM | 500 yrs |
| Pittstown | Hunterdon | 5.96" | 10:35 PM | 200 yrs |
| Kingwood | Hunterdon | 5.77" | 10:40 PM | 200 yrs |
| New Brunswick | Middlesex | 6.51" | 10:55 PM | 500 yrs |
| Hillsborough-Duke | Somerset | 8.10" | 11:05 PM | 1000 yrs |
| Newark Airport | Union | 7.98" | 11:15 PM | 1000 yrs |
| Basking Ridge | Somerset | 7.26" | 11:20 PM | 500 yrs |
| East Brunswick | Middlesex | 6.31" | 11:25 PM | 200 yrs |
| Lyndhurst | Bergen | 7.09" | 11:50 PM | 500 yrs |
| Jersey City | Hudson | 6.38" | 11:50 PM | 200 yrs |
| Haworth | Bergen | 6.16" | 12:00 AM | 200 yrs |
Table 5. Peak six-hour rainfall totals at Rutgers NJWxNet stations and the Newark Airport NWS station that had a total exceeding 3.50”. Also included is the ending time of the last five-minute interval of the six hours and the average recurrence interval (ARI).
NJ Flooding
The rapid accumulation of extreme rainfall amounts led to unprecedented flash flooding and ultimately larger river flooding over the course of minutes to a day or more. This report is not intended to be a full accounting of the hydrological aspects of the storm, as that is better left to professional hydrologists at the US Geological Survey, the National Weather Service, and the NJ Department of Environmental Protection. Here, graphs are shown that illustrate the timing and magnitude of streamflow, and, in three locations, the relationship of stream discharge time series with the rate of precipitation accumulation at nearby weather stations.
The rapidity in which the discharge on streams in smaller drainage areas increased in relationship to rainfall accumulation is shown in Figures 16–18. It is certainly expected that rain falling with the intensity seen at all three gauges will be quickly followed by rapid increases in stream discharge. It is worth noting that in these three examples there was a delay in stream response to rainfall. Royce Brook, at 8 square miles and the smallest drainage basin upstream of its gaging station, experienced a lag of approximately 45 minutes to an hour between the rain accumulation and discharge increases. The lag was approximately 1.5 hours for the Elizabeth River (16.9 square mile basin) station. The Stony Brook basin, considerably larger at 44 square miles, experienced a two-hour delay in stream rise early in the event that lengthened to four hours as the brook crested that long after the rain had stopped five miles upstream at Hopewell Township. Both the smaller basin gages reported crests within one (Royce Brook) and two (Elizabeth) hours of the culmination of the heaviest rain. Discharge also declined much quicker at these locations than at the Stony Brook gage. These are just a few examples of how pairings of rainfall and discharge can assist in gage projections, timing, and warnings.
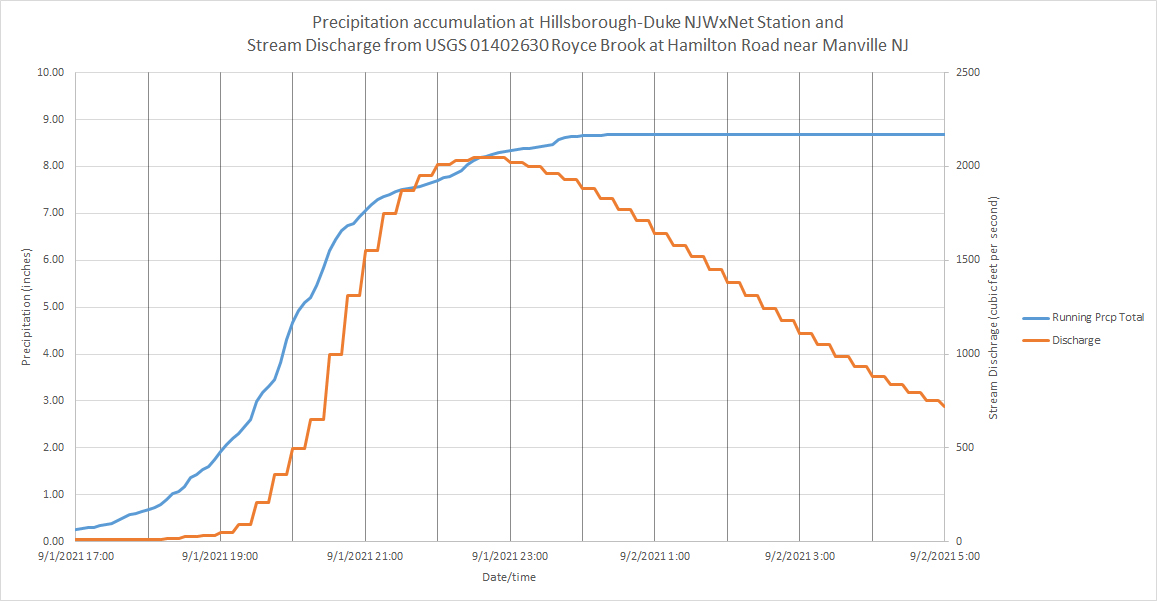
Figure 16. The accumulation of rainfall at the Hillsborough-Duke NJWxNet station from late afternoon on September 1st into early September 2nd plotted along with the discharge on the nearby Royce Brook over the course of this interval. The two measurement locations are 2.4 miles apart in Hillsborough Township. The size of the drainage basin upstream from the gaging station is 8 square miles. (Click image for larger view).
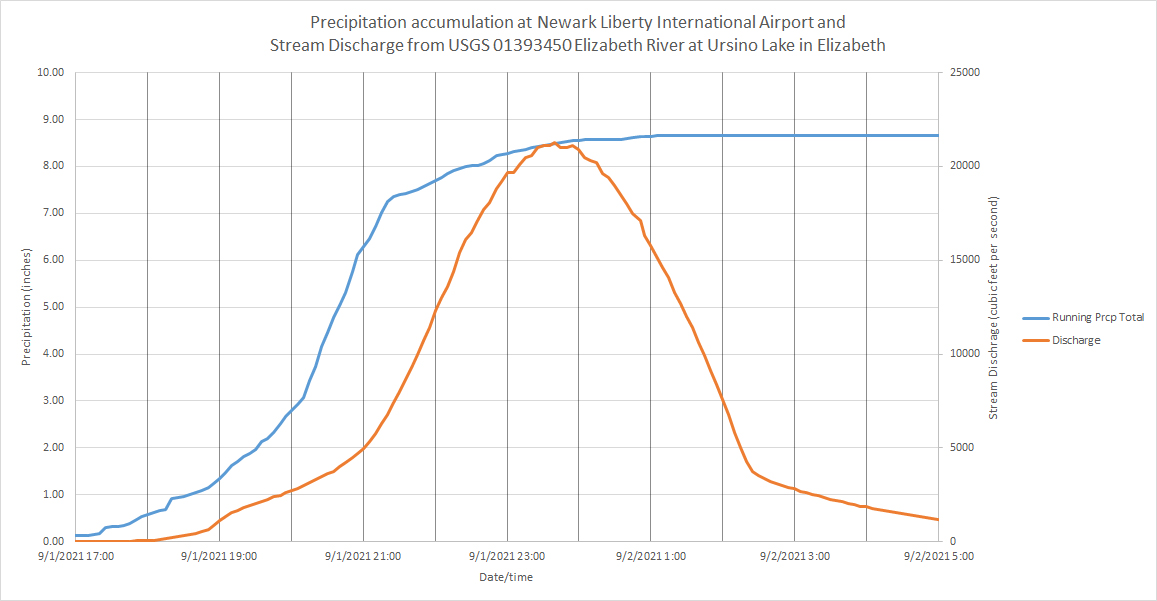
Figure 17. The accumulation of rainfall at the Newark Airport NWS station from late afternoon on September 1st into early September 2nd plotted along with the discharge on the nearby Elizabeth River over the course of this interval. The two measurement locations are 2.8 miles apart in Elizabeth. The size of the drainage basin upstream from the gaging station is 16.9 square miles. (Click image for larger view).
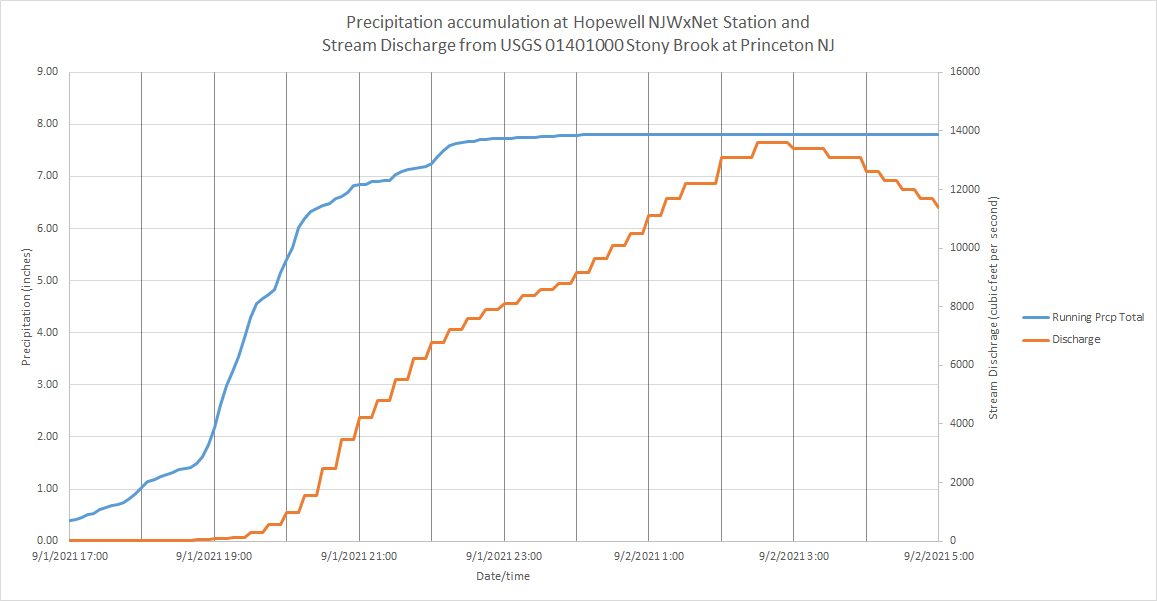
Figure 18. The accumulation of rainfall at the Hopewell Township NJWxNet station from late afternoon on September 1st into early September 2nd plotted along with the discharge on the Stony Brook in Princeton (Mercer) over the course of this interval. The two measurement locations are 5.0 miles apart. The size of the drainage basin upstream from the gaging station is 44 square miles. (Click image for larger view).
Following the local flash flooding, attention next turned to the larger rivers within the basins receiving multiple inches of rain. This included rivers such as the Raritan and its major tributary, the Millstone. Other rivers, such as in the Passaic Basin, experienced flooding, but it was the Raritan Basin that bore the brunt of the greatest river flooding. Figures 19-21 show the response of the Raritan upstream of its confluence with the Millstone, the lower reaches of the Millstone at Blackwells Mills (Somerset), and the Raritan downstream of the confluence with the Millstone at Bound Brook. In each case, the flood crest was exceedingly close to that of Hurricane Floyd in September 1999 and Tropical Storm Irene in August 2011. At Manville (Somerset), the Raritan crest was a record. It may not be possible to determine if that was the case on the Raritan at Bound Brook (Somerset), as the gage malfunctioned prior to the crest being achieved, thus river flow had to be estimated before the gage began to function again some time following the crest. Suffice it to say that Floyd, Irene, and Ida will be inextricably linked when it comes to documenting the three largest floods within the Raritan Basin, certainly over the past century, and perhaps back at least as far as the Colonial period (P. Wacker, Professor, Dept. Geography, Rutgers University, personal communication in 1999).
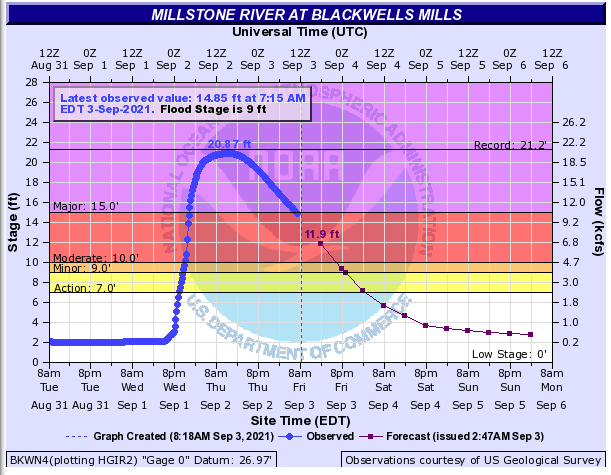
Figure 19. The stage height and discharge of the Millstone River at Blackwells Mills (Somerset). The blue diamonds depict conditions from 8 AM on August 31 to 8 AM on September 3, and the purple boxes depict predicted values over the subsequent several days. Stony Brook flows into the Millstone well upstream of this gage. Note the linear scale for stage (left axis) and the non-linear discharge scale for flow (right axis). (Figure produced by NOAA and based on USGS observations and NWS predictions).
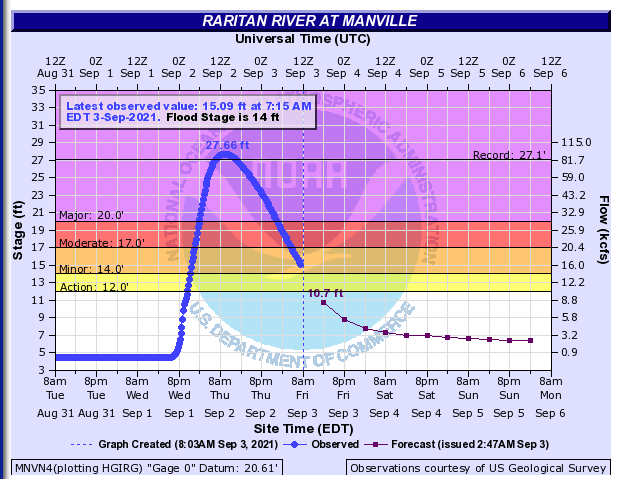
Figure 20. The stage height and discharge of the Raritan River at Manville. This gage is downstream of the confluence of the north and south branches of the Raritan but upstream from the confluence of the Raritan with the Millstone River. See figure 19 for further explanation. (Figure produced by NOAA and based on USGS observations and NWS predictions).
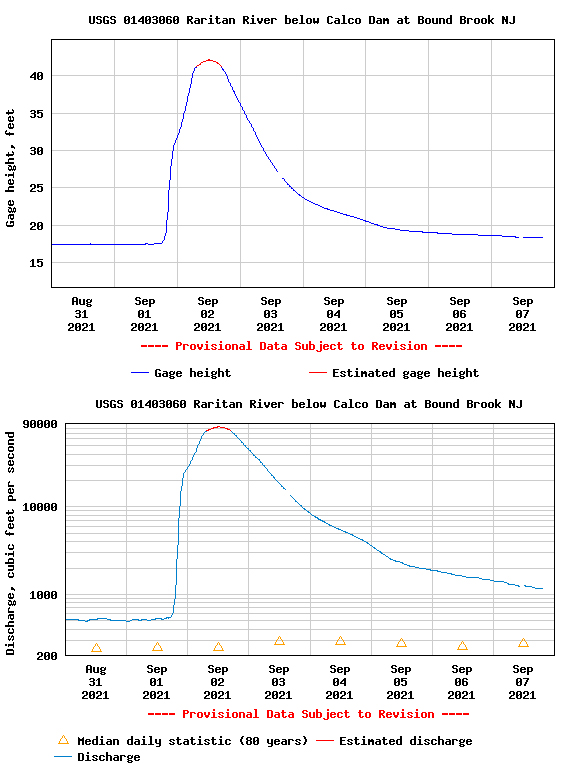
Figure 21. Top: Gage height of the Raritan River at Bound Brook from August 31st to September 7th. Bottom: River discharge at the same location and time. The period in red on the 2nd on both graphs is estimated, as the gage was out of commission during that interval. Note the linear scale (Y axis) for height and non-linear scale for discharge (source: USGS).
NJ Death and Destructive Toll
There is much that has and will continue to be discussed and written concerning the human impacts of Ida within New Jersey. Here, a brief acknowledgment of the tragic loss of life and the devastation the flash and river flooding is presented, as was made mention for the Gloucester tornado. While not definitive, 30 lives were lost as a direct result of Ida flash flooding. Most were due to drowning in or near vehicles or in homes. A map depicting where single or multiple deaths occurred during the storm clearly aligns with the location of the greatest and fastest accumulating rainfall as shown in previous figures (Figure 22). The flash flooding led to considerable property damage, not only to vehicles but to homes and businesses. For instance, over 200 abandoned vehicles were removed from roads just in one central NJ community (Franklin Township, Somerset County) and multiple structures were damaged by raging flood waters in Lambertville (Hunterdon).
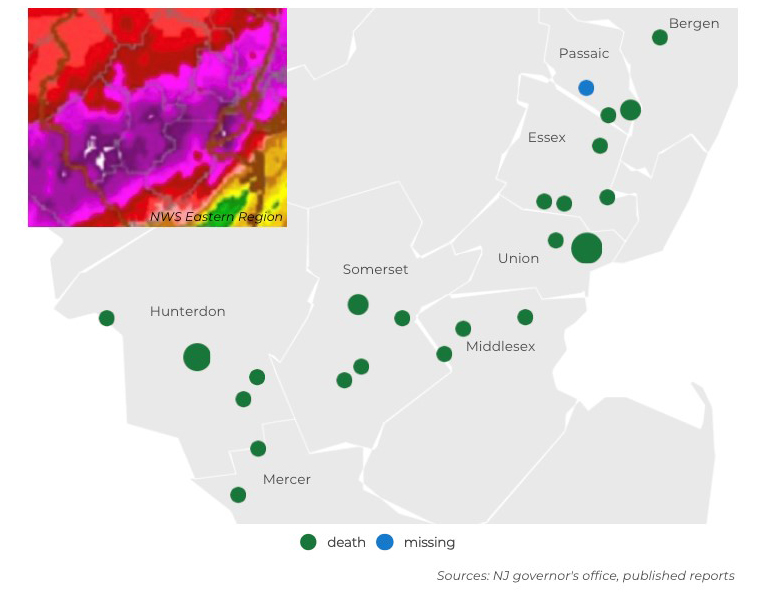
Figure 22. Map showing the location where one or more individuals perished or where missing were last seen, stemming from Ida flooding (source: NJ Spotlight, 9/13/21).
Flood damage also occurred along the larger rivers. This particularly impacted Manville, where flood waters from the converging Raritan and Millstone rivers inundated sections of the community, leading to gas explosions in several homes and a business (Figure 23), causing considerable damage (Figure 24), and leaving several hundred individuals temporarily homeless.

Figure 23. The remains the Saffron restaurant in Manville following a gas explosion early on September 3. Note the flood waters from the adjacent Millstone River still surrounding the facility.

Figure 24. Flood debris from business establishments on Main Street in Manville on September 7 (photo credit: M. Holzer).
Concluding Remarks
Post tropical storm Ida will long be remembered for the tragic flash flooding that resulted from excessive rain falling in just several hours across a broad portion of central and northeastern NJ. The flash flooding was followed by river flooding that in some locations equaled that of Floyd in 1999 and Irene in 2011, each an extraordinary event. Tragically, the 30 deaths, primarily from flash flood drownings, is the second greatest loss of life in NJ from a natural event in at least the past century. This is only exceeded by deaths associated with post tropical storm Sandy in 2012. Much of the flash flooding occurred after dark, which likely contributed to the death toll. Accompanying the storm was the strongest tornado in the state in over 30 years. Damage to homes, other structures, vehicles, and infrastructure was extensive from flooding and this tornado, with minor damage from two other twisters. Timely watch, warning, and emergency declarations, attention paid to these statements by the emergency officials, media, and the public, extensive real-time monitoring of rainfall and river levels as the storm unfolded, and heroic rescues performed over the course of the storm no doubt saved lives. However, as with Sandy and other major weather events, there are lessons to be learned from Ida that will hopefully lead to a better outcome when extreme weather again strikes the Garden State.
For those seeking more detailed information on 5-minute, hourly, daily, and monthly conditions, please visit the following Office of the NJ State Climatologist's websites:
Rutgers NJ Weather Network
NJ Community Collaborative Rain, Hail and Snow Network
NJ Snow Event Reports
Interested in receiving our monthly summaries at the end of each month? Send us your e-mail address here to join the mailing list.
Past News Stories

