

New Jersey Precipitation Perspective
Past, Present & Future
New Jersey State Climatologist
Center for Environmental Prediction, Cook College/NJAES, Rutgers University
May 10, 2006
(Portions of the following report were included in testimony to the New Jersey Senate Environment Committee on April 20, 2006)
Current situation
New Jersey is in the midst of an extended dry spell. Cumulative precipitation between March 1 and May 8 of this year is plotted in figure 1 along with the expected cumulative total at NJ Mesonet stations in northern, central and southern NJ. Negative departures at the stations range from approximately 4 to 4.5", or between 40 and 45% of normal. Within this period, NJ experienced its driest March since statewide records commenced in 1895, with only 0.77" measured (based on approximately 25 reporting stations). The March total falls below the previous record dry March in 1915 when 1.16" fell. Average March precipitation is 4.17". March was the first month with less than an inch of precipitation (rain and melted snow) since February 2002 and only the 10th month since 1970 when the total failed to eclipse an inch. Combined with a dry second half of February, an April with precipitation several tenths of an inch below average, and a dry beginning of May, sizeable short term precipitation deficits have developed. There has been only one generally statewide soaking rainfall (April 22-23) since the snow storm on February 11-12.
The past year has seen five months with precipitation quite close to average, five with negative departures of and inch or more, and two with positive departures exceeding an inch (figure 2). In addition to March, this includes the driest combined August and September on record and the wettest month on record (of any month of the year) in October. Deficits over the most recent 180 days (since early November) are not as negative, with departures ranging from 0.5" (98% of normal) in Sussex County to 6.0" in Cumberland County (71% of normal). Most counties, with the exception of the southernmost three, have between 1" and 3" negative departures, or approximately 90% of normal.
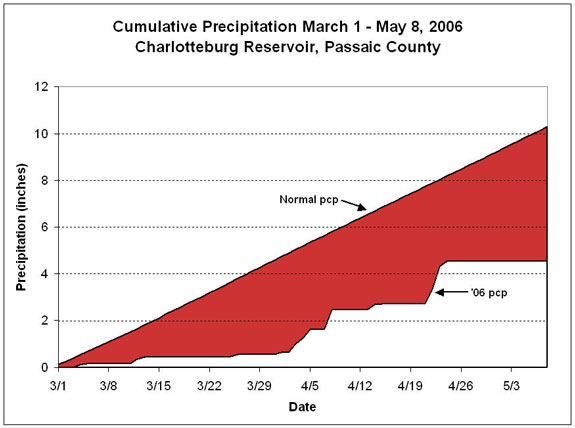
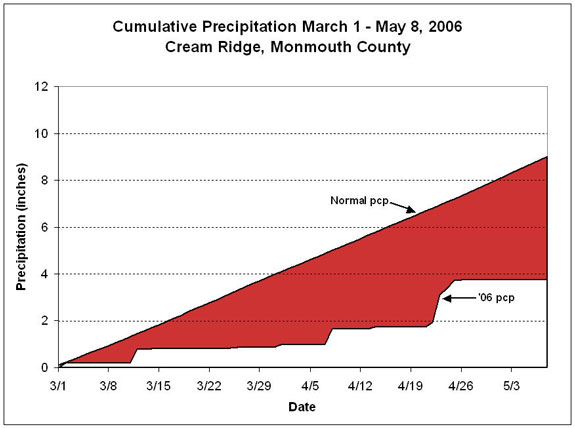
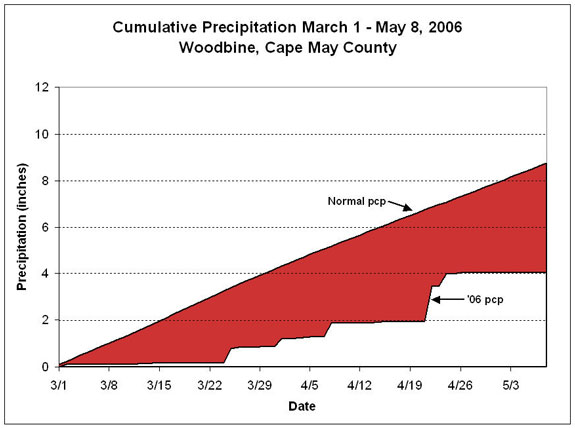
Figure 1. Cumulative precipitation at NJ Mesonet stations between March 1 and May 8, 2006 and normal precipitation during this interval. Negative departures are shown in red.
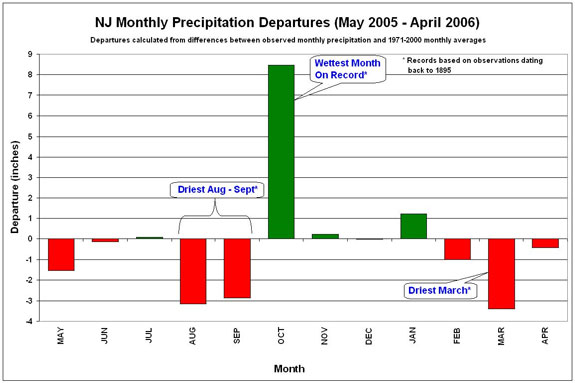
Figure 2. Statewide precipitation over the past year calculated from over 30 stations. Departures are calculated from 1971-2000 means.
While precipitation departures have varied greatly, monthly temperatures have been above average for 10 of the past 12 months (figure 3). May 2005 was the 5th coolest on record, however June through September combined was by far the warmest such period on record. This past January was the 6th and April the 8th warmest on record in the Garden State.
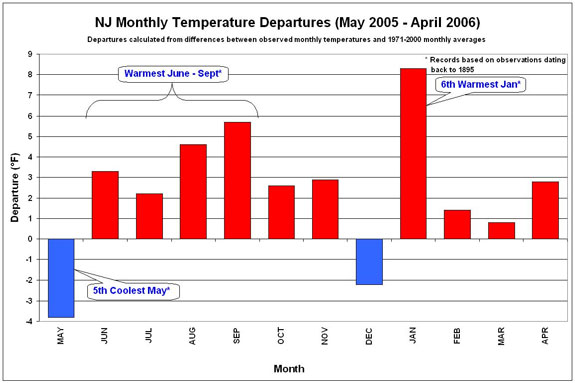
Figure 3. Statewide temperature over the past year calculated from over 30 stations. Departures are calculated from 1971-2000 means.
Over the long term
The widely variable nature of New Jersey precipitation has been evident over roughly the past decade. As the figure below illustrates (figure 4), in addition to what was experienced over the past year, this interval has included:
- 19 months with deficits exceeding 2", while 11 had surpluses exceeding 2"
- The driest 12 month period since 1966 (September 1994-August 1995)
- The wettest calendar year (1996)
- The driest July - December (1998)
- The 2nd driest April - July (1999)
- Flooding rains from Hurricane Floyd (9/16/99)
- The driest consecutive 6 months (September 2001 - February 2002) of any 6 month interval
- 4th driest calendar year (2001)
- 4th wettest calendar year (2003)
A substantial increase in mean annual precipitation has been observed in recent decades compared to the earlier portion of the 20th century (figure 5). Annual precipitation averaged from 1971-2005 exceeds the 1895-1970 value by 3.22" or almost 8%.
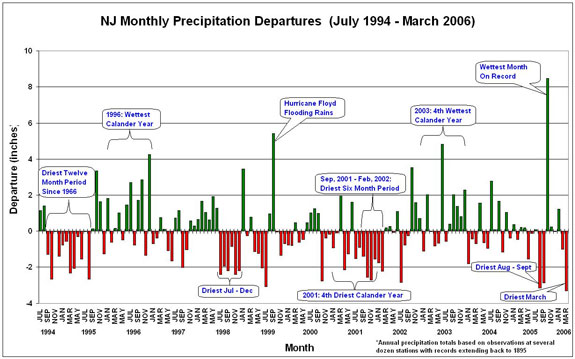
Figure 4. Statewide precipitation since July 1994. Departures are calculated from 1971-2000 means.
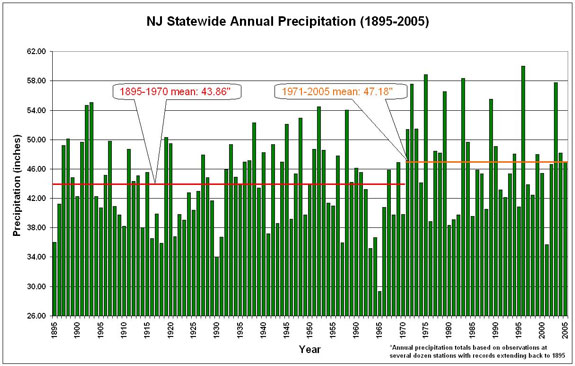
Figure 5. Annual NJ temperature from 1895 to 2005.
As New Jersey has become wetter in recent decades so have temperature risen. Annual values between 1971-2005 averaged 1ºF warmer than in the previous 76 years (figure 56). Of the past 106 years, 7 of the 10 warmest have occurred during the past 16 years, while not one of the 10 coolest years has been observed during this interval. This is similar to what has been observed nationally and globally.
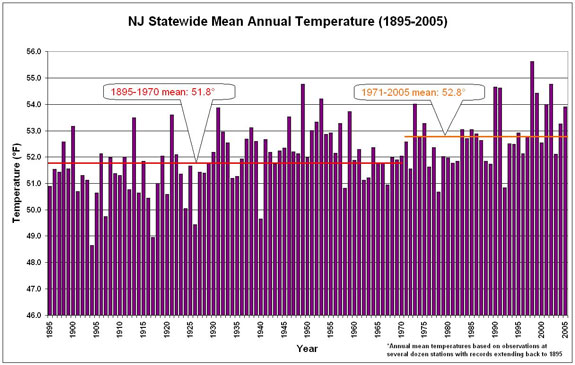
Figure 6. Annual NJ temperature from 1895 to 2005.
The future
Whether one looks months or decades ahead, no one can be certain what the future will bring climatically to the Garden State. Looking at the upcoming warm season, the National Weather Service considers there to be equal chances of rainfall and temperature being in the lower, middle or upper terciles with respect to what has been observed in the past. This "no call" exemplifies the difficulty in forecasting NJ weather patterns weeks and months in advance. This is due to our location in the coastal middle latitudes, where influences on our weather and climate may come from the continental west, polar north, maritime east or tropical south, and determining which influence will dominate is problematic.
For much the same reason, it is difficult to predict what the climate system has in store for our state over the coming decades. However due in large measure to human impacts on the global climate system, it appears as if NJ will continue to warm. This is shown well in climate models, though the future Garden State precipitation regime is more uncertain. There is no consensus amongst models regarding annual totals, but most suggest that annual and seasonal precipitation variability will be greater than in the past. It is too soon to declare that the notable recent variability is associated with this future outlook; however it may serve as an example of what might be expected.
Ongoing monitoring
To assist in keeping an eye on New Jersey's environment over the short and long term, the Office of the NJ State Climatologist has developed the New Jersey Weather and Climate Network (NJWxNet). The NJWxNet serves as a comprehensive information resource for NJ weather and climate monitoring, weather forecasting, and weather/climate-related decision making. It is a unique "network of networks", including data gathered from approximately 40 stations operated by the ONJSC, along with more than 50 stations (and potentially 50 more) maintained by the NJ Department of Transportation, the NJ Turnpike, the National Weather Service, the U.S. Geological Survey, the US Forest Service, Stevens Institute of Technology and others (figure 7). At the ONJSC, raw data are processed into a common database, with data and derived products made available every hour in colorful maps, graphs and tables via the NJWxNet web site within minutes of the observation (figures 8 and 9).
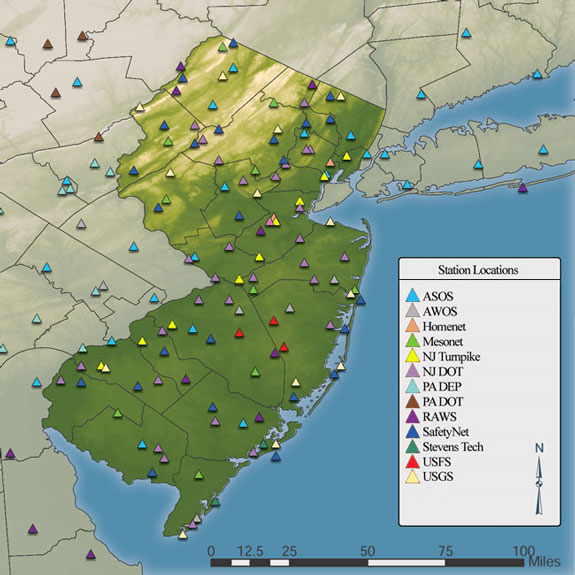
Figure 7. Location of NJWxNet stations and those in nearby states.
The ONJSC maintains two networks within the NJWxNet. The NJ Mesonet is a 13-station network. It is modeled off many successful mesonets, including the Oklahoma Mesonet, the premiere mesonet in the world. Our Mesonet stations have top-grade equipment and are located such that they meet World Meteorological Organization standards. The 30 station NJSafetyNet stations are accurate and reliable, but in some cases do not meet research-quality standards. Many SafetyNet stations are located at State Police barracks and local emergency management offices. Location specifications are less stringent than for NJ Mesonet stations, with instruments often situated within heavily populated or somewhat unique locations.
NJWxNet data and derived products provide valuable real time information to public safety officials, public and private stakeholders, educators, and students. When it comes to the weather and climate, everyone is a decision maker and the NJWxNet is there to assist in the process. Two examples of how the network might assist with water supply issues include: 1) detailed monitoring of precipitation totals in support of requests for federal drought assistance to the agricultural community, and 2) using localized precipitation observations to assist home owners in determining when to water their lawn and how much water to apply.
Adequate support for the full NJWxNet operational infrastructure continues to be sought. Current funding for partial network operations is provided by the NJ Department of Environmental Protection, the NJ Office of Emergency Management and the US Forest Service.
For more information regarding any of the preceding report please contact me at drobins@rci.rutgers.edu or 732-445-4741.
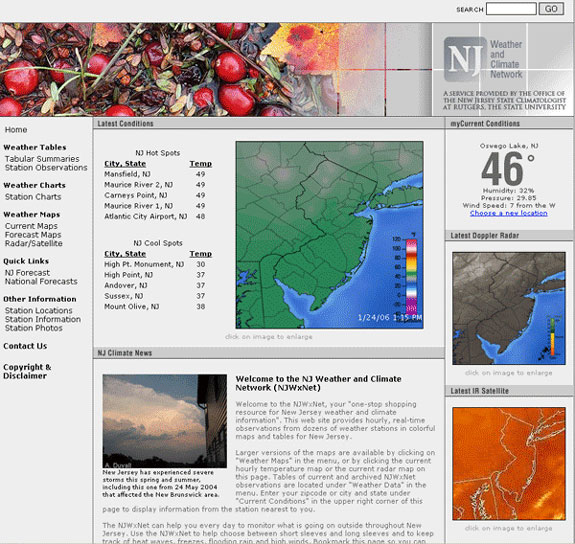
Figure 8. NJWxNet web site lead page at 1 PM on January 24, 2006 (https://climate.rutgers.edu/njwxnet).
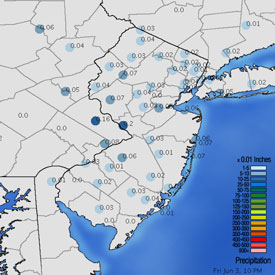

Figure 9. Sample NJWxNet hourly maps of precipitation (June 3, 2005: 10 PM) (top left), temperature (March 13, 2006: 4 PM (top right).