So Much for a Flash Drought: October 2019 Recap
New Jersey State Climatologist
Center for Environmental Prediction, School of Environmental and Biological Sciences/NJAES, Rutgers University
November 6, 2019
Overview
As the 10th month of 2019 commenced, attention was on the continuing flash drought conditions across the Garden State. Lawns had gone brown and shallow rooted trees were losing their dull-colored leaves early. By the second week of the month, the US Drought Monitor showed all of NJ to be in either abnormally dry (D0) or moderate drought (D1) status (full disclosure: my recommendations are taken under consideration by the national author of each week’s map). Several rain episodes in the first half of the month, particularly in the north, began to stall any worsening of conditions. However, it wasn’t until the last half that five events deposited an inch or more, three of them with two inches or more, at a number of locations around the state. Thus by month’s end, only portions of southwest, southeast, and central NJ were rated D0, and the remainder, as we like to say, in “D nada.” This turn to storminess didn’t come without consequences. This included localized flash and small stream flooding on occasion, several episodes of strong winds, and some minor to moderate coastal flooding. More on all of this below, but first to further summarize the month. In the precipitation department, the statewide average was 5.79”. This is 1.90” above the 1981–2010 normal and ranks as the 15th wettest dating back to 1895 (Table 1). North Jersey came in with an average of 6.72”, some 2.41” above normal and ranking 10th wettest. In the south, the 5.28” average was 1.65” above normal and ranks as the 20th wettest.
| Rank | Year | Oct. Avg. Precip. |
|---|---|---|
| 1 | 2005 | 11.99" |
| 2 | 1903 | 8.12" |
| 3 | 1927 | 7.25" |
| 4 | 1943 | 7.24" |
| 5 | 1955 | 7.02" |
| 5 | 1917 | 7.02" |
| 7 | 1913 | 6.94" |
| 8 | 1995 | 6.86" |
| 9 | 2002 | 6.74" |
| 10 | 1996 | 6.34" |
| 11 | 2006 | 6.28" |
| 12 | 1976 | 6.21" |
| 13 | 1902 | 6.06" |
| 14 | 1932 | 5.92" |
| 15 | 2019 | 5.79" |
Table 1. The fifteen wettest Octobers across NJ since 1895.
As if the wet month was not newsworthy enough, the statewide monthly temperature of 58.0° tied with two other years as the 9th warmest back to 1895 (Table 2). This is 3.5° above normal, with northern and southern portions coming in at 3.2° and 3.8° above, respectively. The 2nd was arguably the hottest October day on record, thus also the warmest for so late in the season. Meanwhile, several locations experienced the first freeze of the season on the 4th or 5th, with a more widespread frost and freeze on the 19th. Still, the month ended with only 18 of the 63 NJWxNet stations having fallen to the freezing mark.
| Rank | Year | Oct. Avg. Temp. |
|---|---|---|
| 1 | 2007 | 62.1° |
| 2 | 2017 | 60.4° |
| 3 | 1971 | 59.8° |
| 4 | 1947 | 59.2° |
| 5 | 1990 | 58.7° |
| 5 | 1984 | 58.7° |
| 5 | 1949 | 58.7° |
| 8 | 1919 | 58.1° |
| 9 | 2019 | 58.0° |
| 9 | 1941 | 58.0° |
| 9 | 1900 | 58.0° |
Table 2. The eleven warmest Octobers across NJ since 1895.
Precipitation and Storms
With 8.87” in the gauge, the CoCoRaHS station at Cedar Grove (Essex County) received the most October rainfall in the state. High Point (Sussex) came in with 8.79”, Randolph Township (Morris) 8.59”, West Milford (Passaic) 8.48”, two Denville (Morris) stations with 8.35” and 8.21”, Oswego Lake (Burlington) 8.24”, Mine Hill (Morris) 8.16”, Oxford Township (Warren) 8.11”, and Charlotteburg (Passaic) 8.08”. On the low end was the 3.11” measured at a Lower Township (Cape May) site, with another station in the township at 3.30”. West Cape May (Cape May) received 3.12”, Wildwood Crest (Cape May) 3.21” and 3.37”, Cape May Court House (Cape May) 3.23”, and Cherry Hill (Camden) 3.28”.
The first inch plus event of the month came from off and on showers on the 3rd beginning before dawn and tapering off as drizzle during the evening. Three Blairstown (Warren) stations caught 1.30”, 1.19”, and 1.07”. Mount Olive (Morris) received 1.13”, and Randolph Township 1.08”. Under a tenth of an inch fell in the five southernmost counties. A wind gust of 43 mph was observed at High Point Monument (HPM; Sussex).
A lengthy but somewhat intermittent event produced rainfall from late afternoon on the 7th through the daytime hours of the 9th. All told, Harrison (Hudson) received 1.20”, Palisades Park (Bergen) 1.16”, and Kearny (Hudson) 0.99”.
A strong low pressure system parked off of the mid-Atlantic coast from the 9th into the 13th, ultimately evolving into short-lived Tropical Storm Melissa. Jersey rainfall was just a few hundredths of an inch, however, persistent strong onshore winds resulted in minor to moderate flooding along the coast, particularly in central and southern locations. Seven consecutive high tides produced minor to moderate flooding on the ocean front and in the back bays, exemplified below for Barnegat Bay (Figure 1). While rather windy throughout, the peak gusts along the coast were only 41 mph at Harvey Cedars (Ocean) and 40 mph in Sea Girt (Monmouth), each on the 10th. Winds were certainly stronger offshore and, again, it was their multi-day persistence that generated the flooding.
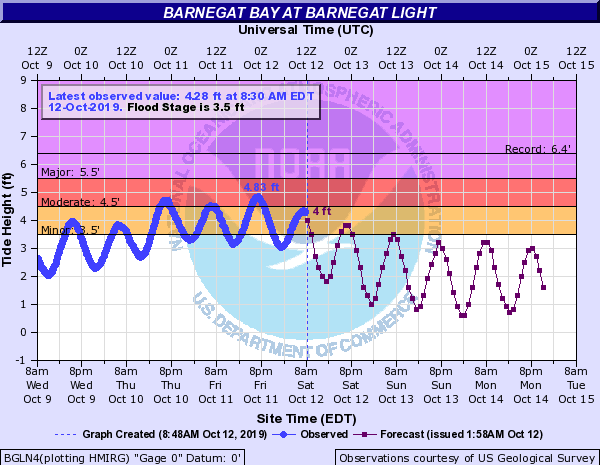
Figure 1. Observed tide height at the Barnegat Bay gauge from 8AM October 9th to 8AM October 12th (blue line) and forecast heights though October 14th. The predicted minor flood height at 8PM on the 12th verified, with no further flooding later in the displayed period (courtesy of NOAA).
Upon Melissa’s departure, a weak low moved into the area, providing enough rain to total 1.27” and 1.15” at two Port Republic (Atlantic) stations, Galloway (Atlantic) 1.25”, and Little Egg Harbor Township (Ocean) 1.05”. Little rain fell elsewhere in the state.
The month’s wettest event saw rain move northward through the state during the afternoon of the 16th. Rain fell heavily into the evening as the barometric pressure plummeted, followed by some strong winds as the low over northeast NJ moved into southern New England. West Milford’s two stations caught 3.36” and 3.22”, High Point saw 3.29”, Sandyston (Sussex) 3.10”, and Charlotteburg 3.01” (Figure 2). Of the 258 reporting CoCoRaHS stations, 74 tallied 2.00”–2.99” and 140 sites from 1.00” to 1.99”. Toms River (Ocean) with 0.44” and Wildwood Crest at 0.48” received the least. Gusts during the evening of the 16th reached 59 mph at HPM, Sea Girt 54 mph, Fortescue (Cumberland) 53 mph, Lower Alloways Creek Township (Salem) 53 mph, Harvey Cedars 52 mph, and 16 NJWxNet stations from 40–49 mph. Winds continued on the 17th with HPM hitting 64 mph, Pennsauken (Camden) 51 mph, and 19 stations from 40–49 mph. The 18th found HPM up to 53 mph and Fortescue 40 mph.
As mentioned, this “bomb cyclone” quickly led to pressures plummeting across the state to a minimum of 29.09” in Haworth (Bergen), with the northeast below 29.15”, the coast and east central areas from 29.15”–29.25”, and the remainder of NJ from 29.25”–29.35” (Figure 3).
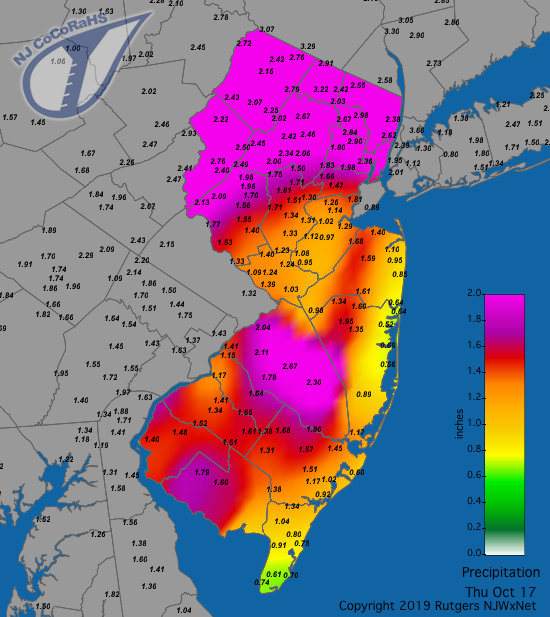
Figure 2. Rainfall from approximately 7AM on October 16th to 7AM on October 17th. Observations are comprised of reports from CoCoRaHS stations.
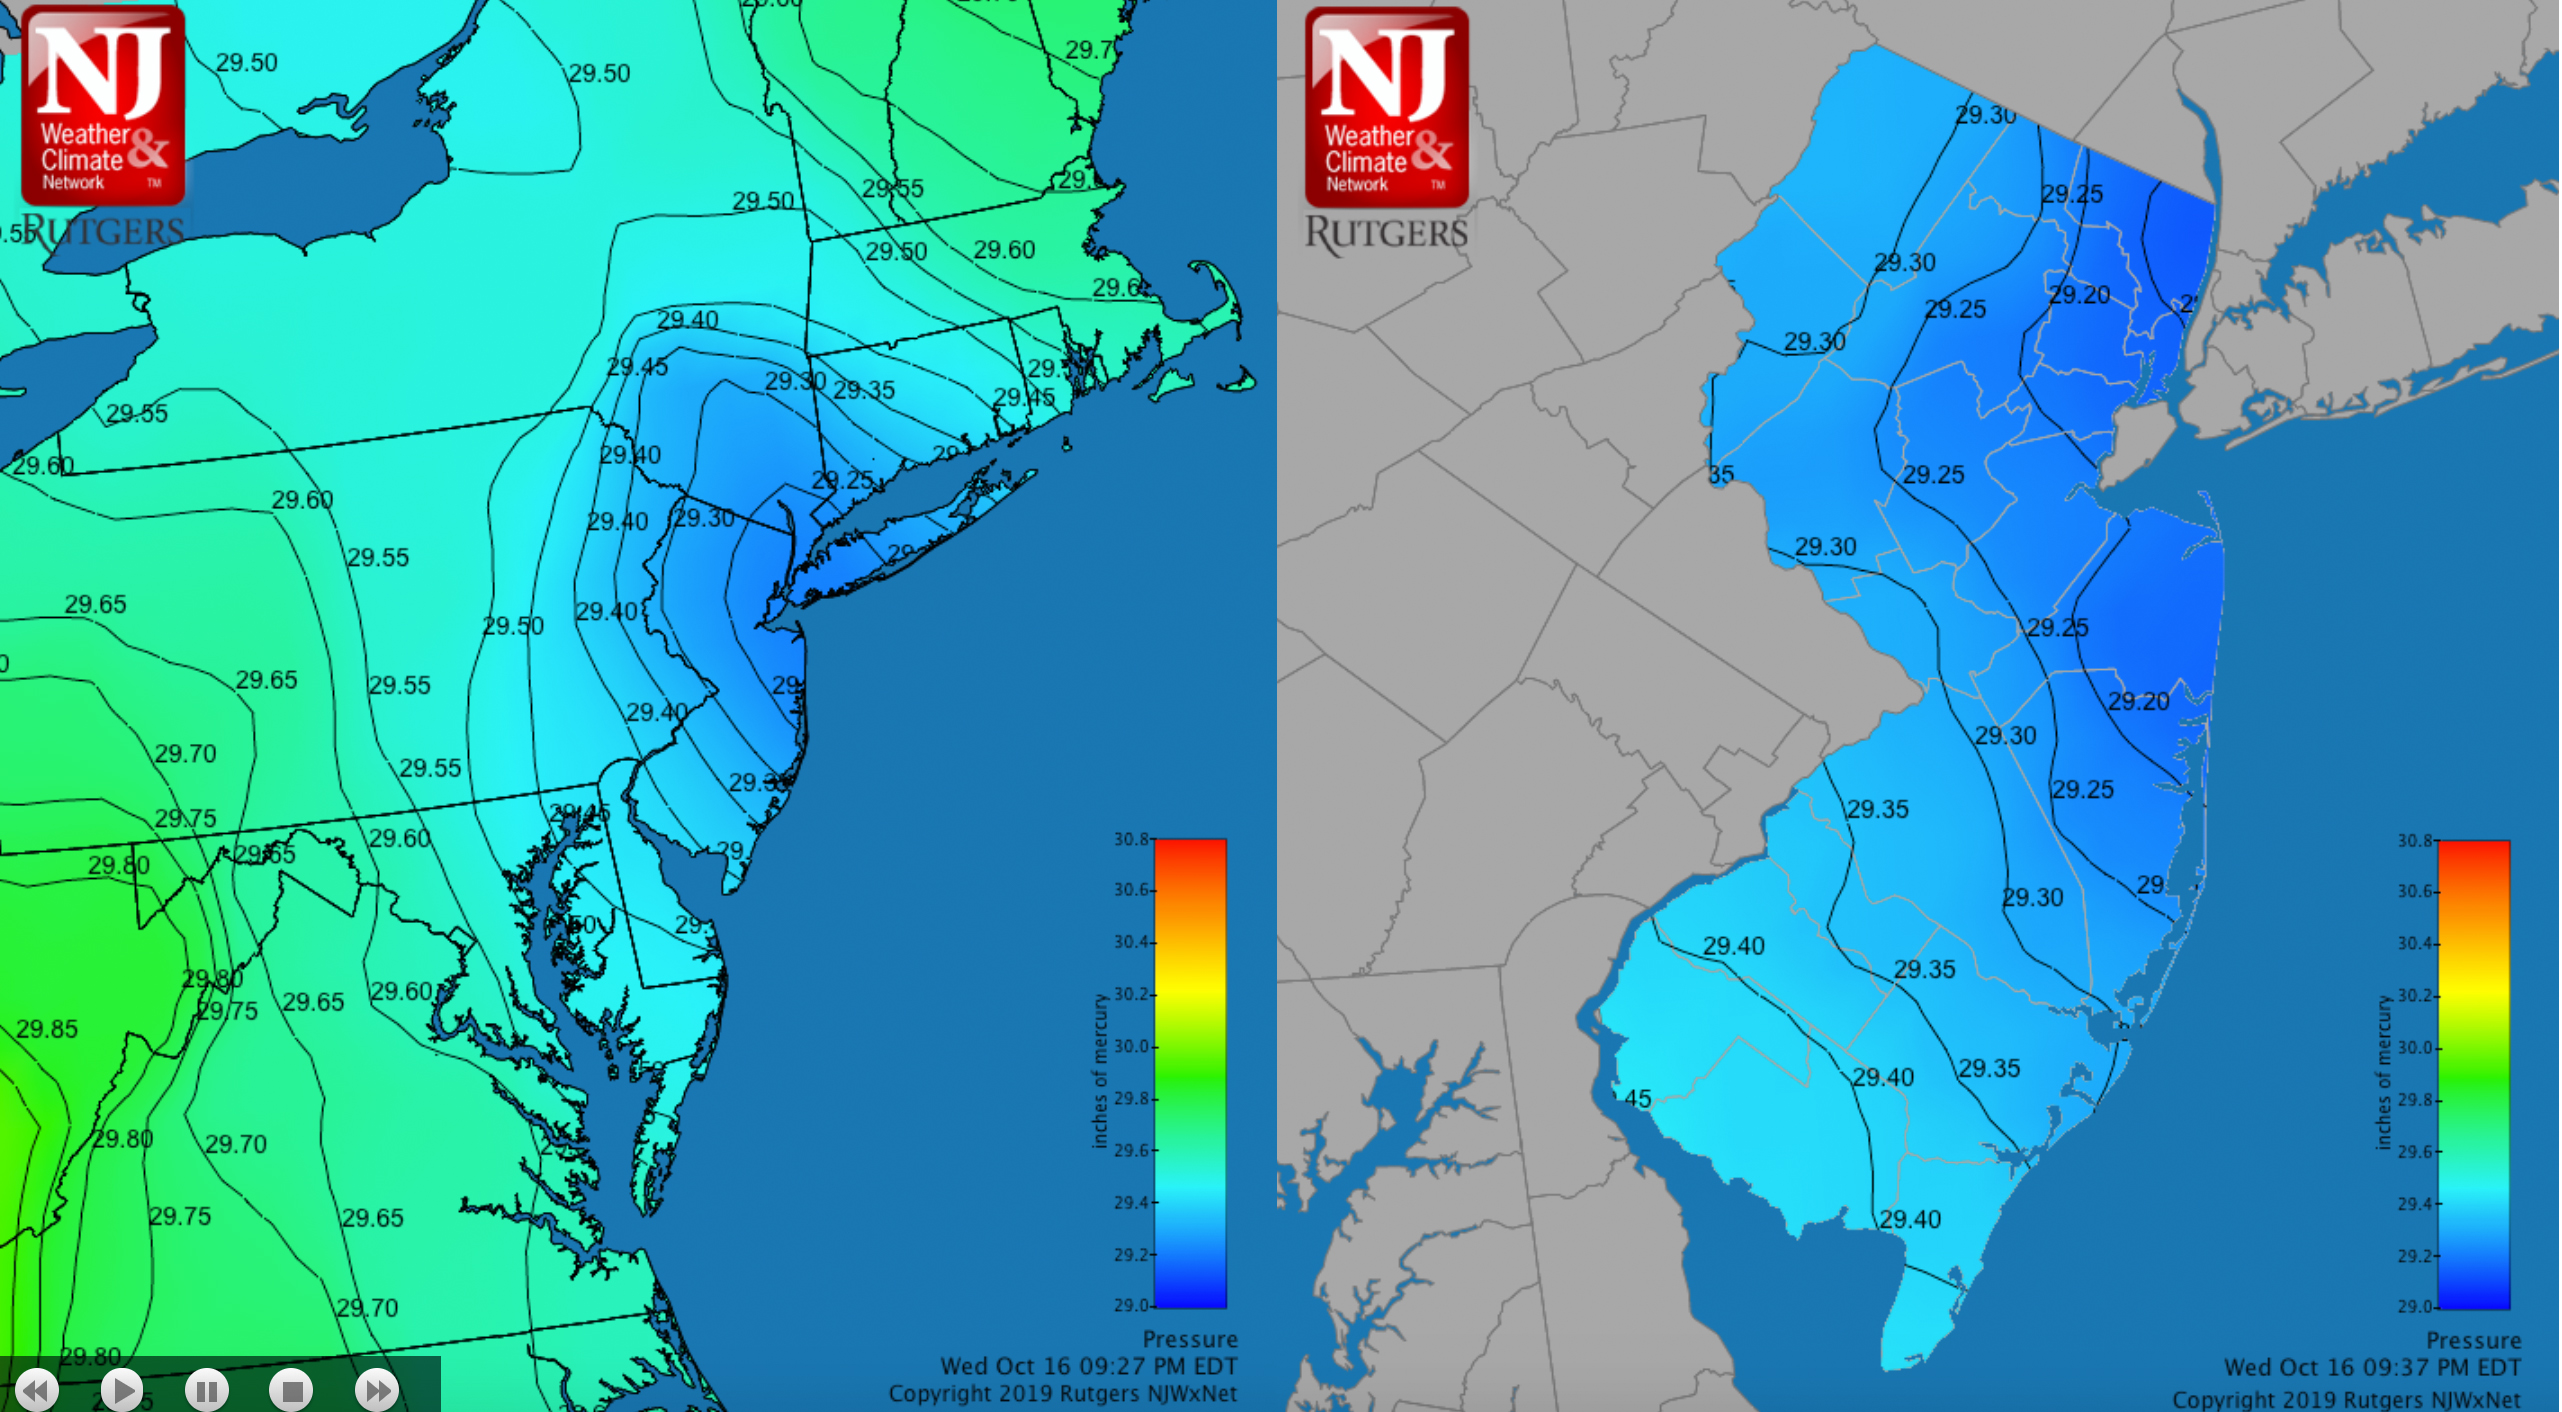
Figure 3. Surface barometric pressure around 9:30PM on October 16th.
Rain was back in the picture on the 20th, especially in the southeast, arriving in the south and west from mid to late morning and moving out of the state during the early evening. The moisture was associated with the remnants of Tropical Storm Nestor, which had a landfall along the Florida Gulf Coast just a day earlier. Vineland (Cumberland) saw the most with 2.63”, followed by three Stafford Township (Ocean) locations with 2.60”, 1.71”, and 1.55”, two Egg Harbor City (Atlantic) sites at 2.21” and 2.04”, and Washington Township (Burlington) 2.20” (Figure 4). Some 39 stations caught from 1.00” to 2.08” and 109 saw 0.50”–0.99”. The least was observed at three Blairstown sites with from 0.26”–0.29” and at Stillwater (Sussex) with 0.26”.
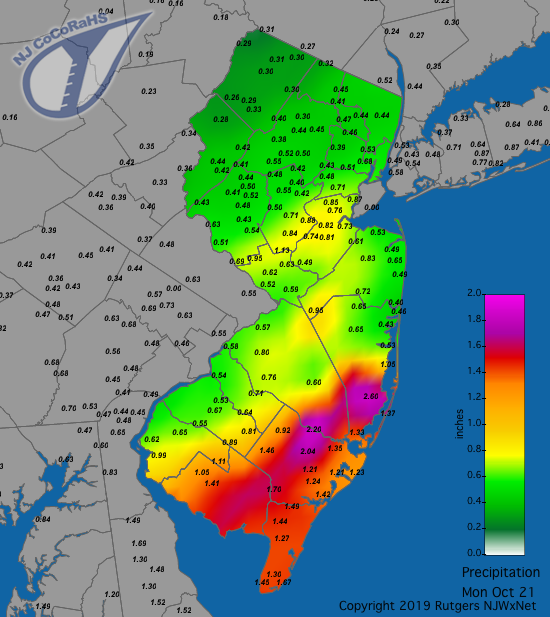
Figure 4. Rainfall from approximately 7AM on October 20th to 7AM on October 21st. Observations are comprised of reports from CoCoRaHS stations.
The 22nd brought a period of rain across NJ, the heaviest falling in the Highlands. Denville saw 1.16” and 1.08” at two locations, Bloomingdale (Passaic) 1.10”, and 1.07” in Boonton (Morris), Randolph Township, and Bernards Township (Somerset). Two Wildwood Crest stations only caught 0.09” and 0.10”.
Another formidable storm arrived in the pre-dawn hours of the 27th, bringing moderate to heavy rain during the morning before tapering off during the midafternoon. Pockets of 2.00” plus rain fell in the north and south, led by 2.57” in Oswego Lake (Figure 5). Other hefty totals include 2.34” and 2.24” at two Hammonton (Atlantic) stations, two Randolph Township sites with 2.21” and 2.20”, and two Denville locations with 2.18” and 2.16”. All told, 15 of 223 CoCoRaHS reports exceeded the 2.00” mark, with 154 from 1.00”–1.99”. On the low end, five Lower Township gauges caught from 0.46”–0.66”. Woodbine (Cape May) gusted to 40 mph on the 27th with HPM reaching 40 mph on the 28th.
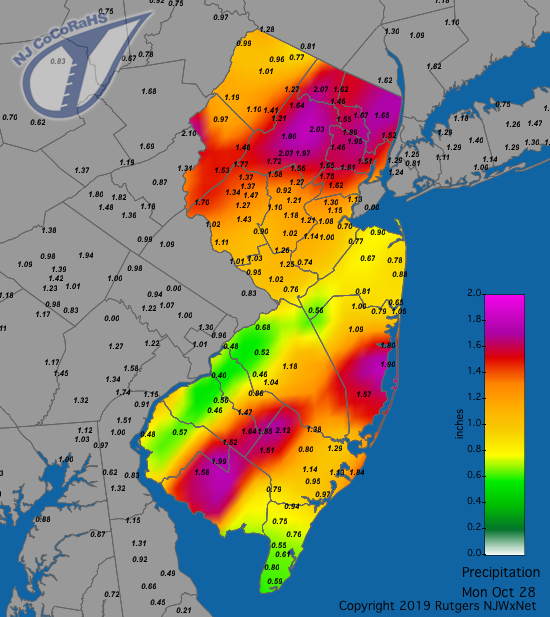
Figure 5. Rainfall from approximately 7AM on October 27th to 7AM on October 28th. Observations are comprised of reports from CoCoRaHS stations.
The last three days of October brought dismal weather across the state courtesy of persistent onshore flow. A dense cloud cover was accompanied by frequent drizzle along with some scattered showers that only amounted to a few tenths of an inch, mainly along the coast and in the north. This resulted in diurnal temperature ranges of under 5° at most NJWxNet stations, including a one-degree range (62°/61°) at Harvey Cedars and just 2° at Atlantic City Marina (Atlantic) and Seaside Heights (Ocean). Woodbine’s 9° range was the largest of the 63 stations.
This set the scene for a major pattern shift across the eastern US, initiated with a powerful cold front blasting through NJ late on the 31st into the first few hours of November 1st. While the rainfall totals for this event will be included in November totals (for those stations with morning observation times), it is worthwhile discussing this event here. Rainfall, most of which fell before midnight, amounted to 2.26” at Walpack (Sussex), Sandyston (Sussex) 2.00”, Mt. Arlington (Morris) 1.85”, Jefferson Township (Morris) 1.69”, and Blairstown 1.63”. However, 89 of the 222 CoCoRaHS reports for the 24 hours ending on the morning of November 1st were under 0.50”, due to the rather short duration of the quick hitting squall line.
Winds howled as the squall line passed and an EF1 tornado occurred in Morris County. The tornado tore a discontinuous 4.9 mile long 150 yard wide path from Harding Township into Chatham Township, Madison and Florham Park, touching down with 100 mph winds at 12:23 AM. Damage included downed trees onto homes, cars, and powerlines, though fortunately there were no injuries reported. This was New Jersey’s 9th confirmed tornado in 2019, placing this year in a tie with 1987 for the second most on record since1950, yet still well below the 17 in 1989. Elsewhere, damaging winds brought down trees and damaged some buildings at an airport in Wall Township (Monmouth). Gusts late on the 31st included Woodbine’s 49 mph, Point Pleasant (Ocean) 47 mph, Oswego Lake 46 mph, and nine other stations from 40–44 mph. Shortly after midnight, peak gusts reached 62 mph at HPM, Fortescue 57 mph, Charlotteburg 54 mph, Hillsborough-Duke (Somerset) 54 mph, Harvey Cedars 53 mph, Woodbine 53 mph, Hammonton 50 mph, Moorestown (Burlington) 50 mph, and 17 other stations from 40–49 mph.
The eight October days when one or more NJWxNet station saw a wind gust of 40 mph or greater and the lowest pressures of the month have been addressed earlier in this section of the report. Monthly barometric pressure peaked at 30.40”–30.50” on the 5th.
Temperature
As expected in a transitional month, there were some wide swings in temperature this October. There were 18 days when one or more NJWxNet station had a high temperature of 70° or greater, three of which reached into the 80°s and one the 90°s. On the cold side, at least one station fell to the freezing mark or lower on ten days.
Looking more closely at the nine afternoons when the 75° or higher mark was achieved, the month kicked off on the 1st with five stations getting to 85° and 44 of the 63 NJWxNet sites from 80°–84°. The 2nd, as mentioned above, was one of the hottest, if not the overall hottest, October day on record. Moorestown led the pack at 97°, followed by 96° at Greenwich (Cumberland), Hamilton (Mercer), Mannington (Salem), and Upper Deerfield (Cumberland). Some 38 stations topped out from 90°–94°, with five from 85°–89° and HPM least warm at 83°. The 95° high in New Brunswick (Middlesex) was the hottest October day on record for this station, with observations back to 1893. A modest level of humidity made conditions feel warmer than the thermometer, as shown in a map of heat index values close to 2PM (Figure 6).
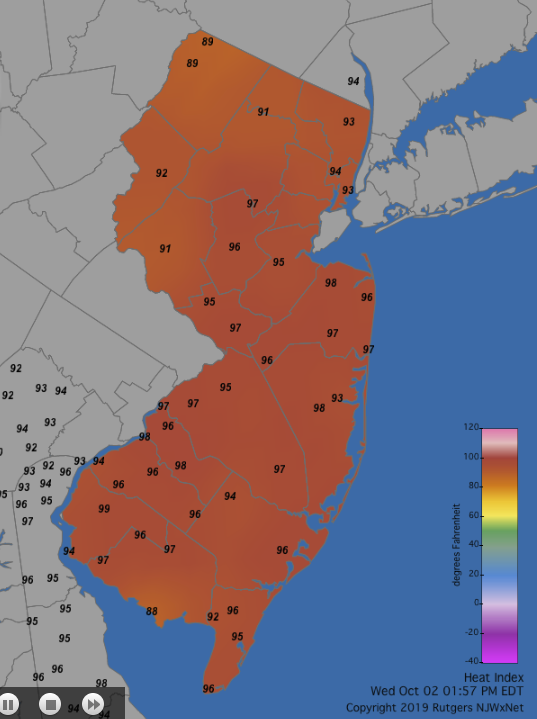
Figure 6. Heat index at 1:55 PM on October 2nd.
Cooler air invaded the state on the 3rd, but not before West Cape May recorded an 80° maximum, with Dennis (Cape May), Fortescue, and Woodbine up to 79°. Meanwhile, HPM reached just 51° on the 3rd. This HPM reading was also the best it could do on the 4th, when Cape May Court House and Woodbine reached 75°.
Heat returned on the 7th, with Greenwich hitting 85°, nine stations at 83°, and 29 up to 80°–82°. HPM got to 62°. The 10th found Greenwich and Mansfield (Burlington) at 76°. An exceedingly uniform sunny day was experienced across the state on the 14th, with 16 stations at the top mark of 75° and the coolest location, again HPM, not too far behind at 67°. Logan (Gloucester) led the way with 76° on the 27th, followed by four locations at 75°. The 30th found Lower Alloways Creek Township at 77°, ten stations at 76°, and 45 from 70°–75°. Again, the statewide range of maximums was rather narrow with HPM lowest at 66°.
The ten October days where one or more NJWxNet station bottomed out at 32° or colder included the perennial cold air drainage station at Walpack each time. It was the only location to drop that low on the 4th (32°), 11th (31°), 15th (29°), 16th (31°), and 25th (25°). In fact, on the 11th, the next closest low was 39° in Sandyston. A more normal situation arose on the 5th when Walpack fell to 27° with Sandyston not far behind at 29°, followed by Pequest (Warren) 30°, Kingwood (Hunterdon) 31°, and Basking Ridge (Somerset) 32°. That first freezing morning of the season (the reading on the 4th at Walpack was reached shortly before midnight) saw the coastal towns of Seaside Heights and Harvey Cedars fall to 52°.
The 18th saw Walpack drop to 29° and Hopewell Township (Mercer) 32°. The most widespread freeze of the early season (along with frost at many other locations) was on the 19th. Walpack and Hopewell Township each bottomed out at 27°, Basking Ridge and Pequest each got to 28°, and 14 other stations were from 29°–32°. Walpack was 29° on the 20th, with Sandyston 29° and Basking Ridge and Pequest each 32°. Walpack fell to 27° on the 24th, followed by Sandyston’s 29° and five stations from 30°–32°.
For those seeking more detailed information on 5-minute, hourly, daily, and monthly conditions, please visit the following Office of the NJ State Climatologist's websites:
Rutgers NJ Weather Network
NJ Community Collaborative Rain, Hail and Snow Network
NJ Snow Event Reports
Interested in receiving our monthly summaries at the end of each month? Send us your e-mail address here to join the mailing list.
Past News Stories

