Record Heat: July 2020 Recap
New Jersey State Climatologist
Center for Environmental Prediction, School of Environmental and Biological Sciences/NJAES, Rutgers University
August 7, 2020
Overview
July 2020 was the hottest month on record for the Garden State since records commenced in 1895. The statewide average temperature of 78.8° was 4.2° above the 1981–2010 normal. This reading surpasses by 0.4° the previous record held jointly by 1955, 1999, and 2011 (Table 1). The next ten warmest months have occurred in July, with the warmest August averaging 76.8° in 2016, which is tied with July 1994 as the 11th warmest month on record. The average 88.9° maximum this past July was 5th warmest, the warmest occurring in 1999. The average minimum of 68.8° ranked second, trailing just 2013. The southern and coastal climate divisions had their warmest month on record while the northern division ranked second.
| Rank | Year | July Avg. Temp. |
|---|---|---|
| 1 | 2020 | 78.8° |
| 2 | 2011 | 78.4° |
| 2 | 1999 | 78.4° |
| 2 | 1955 | 78.4° |
| 5 | 2010 | 78.3° |
| 6 | 2019 | 78.0° |
| 7 | 2013 | 77.8° |
| 7 | 2012 | 77.8° |
| 9 | 2016 | 77.2° |
| 10 | 1949 | 77.0° |
Table 1. The 10 warmest Julys across NJ since 1895.
This record warm July along with the 10th warmest June, has made for an average of 75.3° over the first two thirds of the 2020 summer. This is only outpaced by the 76.1° average in 2010 (Table 2).
| Rank | Year | June/July Avg. Temp. |
|---|---|---|
| 1 | 2010 | 76.1° |
| 2 | 2020 | 75.3° |
| 3 | 2011 | 75.2° |
| 4 | 2013 | 74.5° |
| 4 | 2008 | 74.5° |
| 4 | 1999 | 74.5° |
| 4 | 1994 | 74.5° |
| 8 | 2019 | 74.3° |
| 9 | 2005 | 74.1° |
| 9 | 1949 | 74.1° |
Table 2. The 10 warmest June/Julys across NJ since 1895.
The statewide average precipitation this July was 6.79”. This is 2.22” above the 1981–2010 normal and ranks as the 15th wettest July on record. Looking at the state in quarters from north to south, the northernmost was driest, particularly the northwest (Figure 2). Next came a wet sector, followed by a more average one, with the southernmost quarter the wettest. Few locations received less than 4 inches, while scattered totals of more than 10 inches were found in the two wettest quarters.
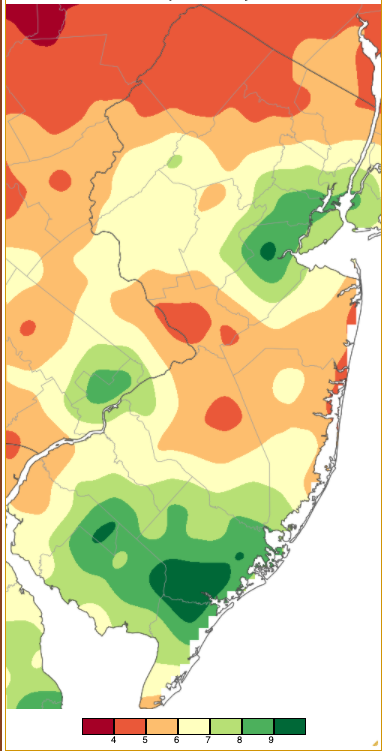
Figure 1. July 2020 precipitation across New Jersey based on a PRISM analysis generated using NWS Cooperative and CoCoRaHS observations (Oregon State University).
Temperature
Twenty-five July days found one or more NJWxNet station reaching a maximum of 90° or higher. Thirteen of those days had a maximum of 95° or higher, yet no station exceeded 99° during the month. Every NJWxNet station reached 90° at least once, with the exception of High Point Monument (Sussex County; 1,765 feet elevation), which maxed out at 87° on the 27th. The High Point (Sussex) station at 1,388 feet reached 91° and the Vernon Township (Sussex) station at 1,394 feet got to 90° on the 27th, the only time each reached the 90°s during the month. The latter station is new to the NJWxNet, commissioned on July 9th and hosted by Mountain Creek Resort.
Looking at 95° or hotter days, the first occurred on the 3rd when Cape May Court House (Cape May), Mannington (Salem), and South Harrison (Gloucester) topped out at 97°. Moorestown (Burlington) and Pennsauken (Camden) reached 97° on the 5th. Hillsborough-Duke (Somerset) reached a NJ monthly high 99° on the 6th, with Hillsborough (Somerset) at 97°.
Ten of the final 14 days of July reached 95°. Sicklerville (Camden) and Mansfield (Burlington) began this “siege” on the 18th at 95°. The 19th found Moorestown up to 98°, with five stations at 97°. The heat continued on the 20th, with six stations at 97° and 25 either at 95° or 96°. The top mark was 97° at five stations on the 21st, with 15 from 95°–96°. Berkeley Township (Ocean), Hillsborough-Duke, and Pennsauken reached 96° on the 22nd.
Only Mansfield made it to 95° on the 26th, followed by five locations at 96° on the 27th. West Creek (Ocean) and Vineland (Cumberland) peaked at 97° on the 28th, with Red Lion (Burlington) on top at 95° on the 29th. On the 30th, Hillsborough-Duke hit 97°, Pennsauken and Sicklerville each 96°, and 11 locations at 95°.
With one exception, on every 95° day in July, the least warm maximum temperature at an NJWxNet station was in the 80°–84° range. On the 27th High Point Monument reached 87° and Fortescue (Cumberland) 89° and were the only sub-90° locations. The fact that one of these stations is right by the water (Delaware Bay) and the other at high elevation epitomizes the two areas where maximum temperatures are often tempered during the warm season. This is more reliable at higher elevations, as, for instance, an Atlantic sea breeze failed to materialize on several July days, including the 20th when West Cape May (Cape May) reached 93°, Harvey Cedars (Ocean) 94°, Atlantic City Marina (Atlantic) and Sea Girt (Monmouth) each 96°, and Seaside Heights (Ocean) 97°.
Then there were the nighttime minimum temperatures. Prior to recapping the days and locations, it is worth noting that at least one NJWxNet station had a minimum of 70° or higher on each day of July. In fact, on four days the minimum remained in the low 80°s at some locations near the coast, especially next to the warm waters of Delaware Bay at Fortescue, but also near the Atlantic Coast and in some urban areas. The warmest of the nights were the 20th and 28th when Fortescue only fell to 82°, six other stations (20th) and four (28th) were at 80°–81°, and 34 NJWxNet sites were between 75°–79° on each of the two days.
Both the high nighttime temperatures and the century mark not being reached for a daily maximum are indicative of the frequent high humidity levels during July. This was exemplified on the 26th, with daily maximums in the 90°s and dewpoint temperatures peaking in the upper 70°s and low 80°s over all but far northern NJ (Figure 2).
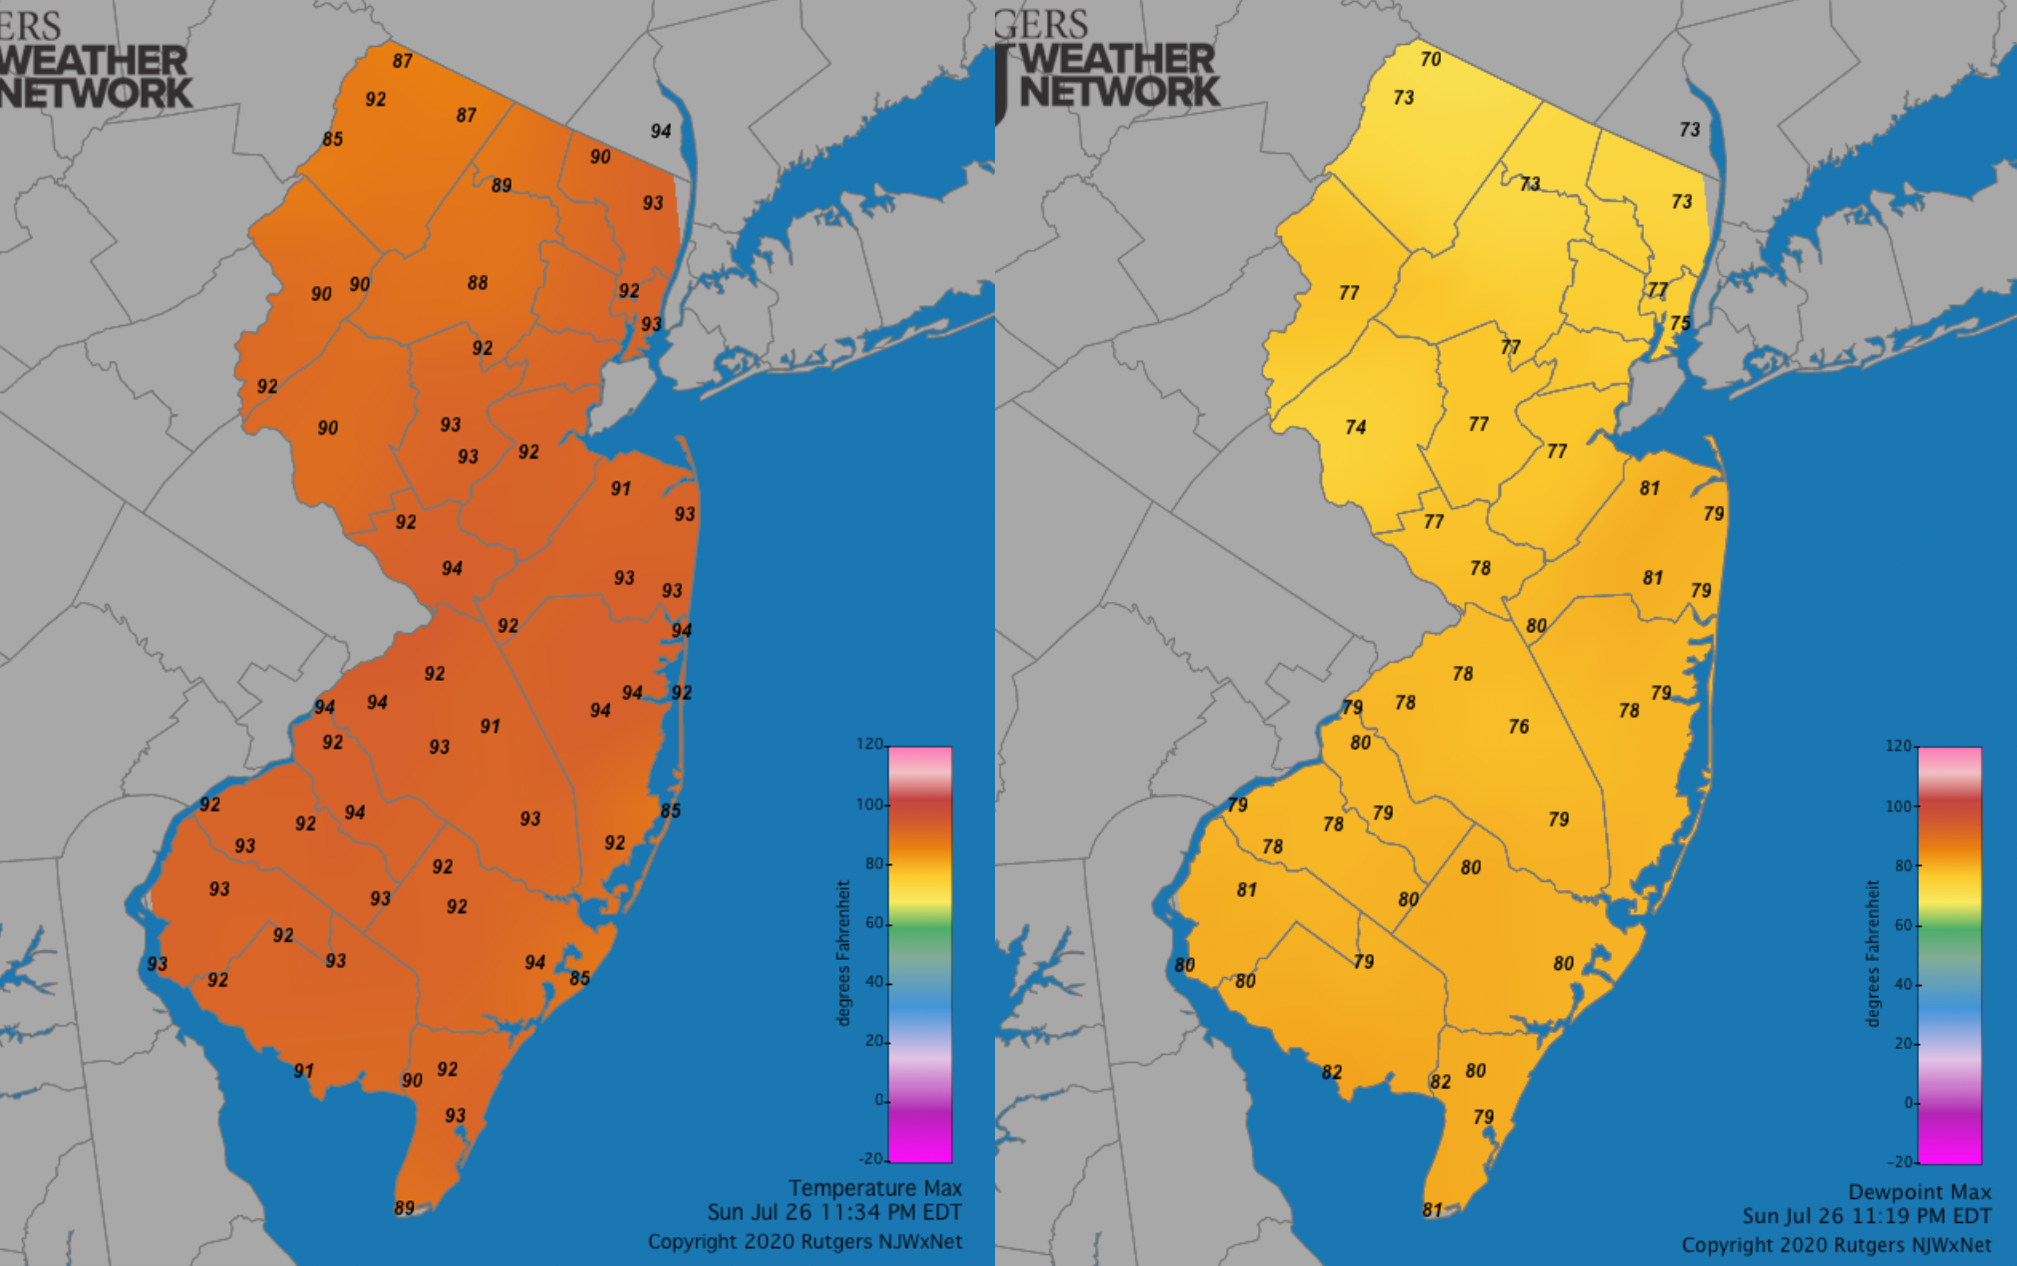
Figure 2. NJWxNet maximum temperatures (left) and maximum dewpoint temperatures (right) on July 26th.
Despite the excessive warmth and humidity, there were eleven July days when the minimum temperature was in the 50°s at one or more locations in northwest NJ valleys or high elevations. The 1st found Sandyston (Sussex) down to 59°. This location reached 57° on the 2nd, only to rise to 92° in the afternoon, just 2° below the state daily maximum. Basking Ridge (Somerset) and Pequest (Warren) were down to 59° that morning. The 5th saw Walpack (Sussex) at 57° and Sandyston 59°. On the 6th, Walpack started the day at 56°, rising to 92° in the afternoon, while Pequest fell to 57° and Sandyston 59°.
The 14th was the coolest night of the month, with Walpack at 54°, Sandyston 55°, High Point Monument and Pequest each 56°, and Kingwood (Hunterdon) and Hackettstown (Warren) each 59°. Walpack was 55° on the 15th, followed by Sandyston at 56° and Pequest 57°. High Point Monument fell to 59° on the 16th and 58° on the 17th. Sandyston reach 56° on the 18th. On the 27th Walpack dipped to 57°, Sandyston 58°, and Pequest 59°, while on the 29th Sandyston’s low was 59°.
Precipitation and Storms
As is often the case during the warm season, monthly precipitation totals varied widely across NJ, sometimes in adjacent counties or even within the same county. The high end of the scale for July was Estell Manor (Atlantic) and Woodbine (Cape May), tied at 11.30”. Galloway (Atlantic) and Franklin Township (Gloucester) were next up, tied at 10.85”. Egg Harbor Township (Atlantic) reported 10.63” and Franklin Township (Somerset) 10.39”, 10.31”, 10.28”, and three additional totals from 6.68”–9.03”.
Among the driest locations in NJ in July were Stillwater (Sussex) with 3.15”, Point Pleasant Beach (Ocean) 3.46”, Rockaway Township (Morris) 3.75”, Sandyston 3.93”, Andover (Sussex) 4.11”, Pompton Lakes (Passaic) 4.15”, and Ewing Township (Mercer) 4.17”.
There were seven events during the month where 2.00” or more fell somewhere in the state. The first was during the afternoon and evening of the 1st when thunderstorms struck several areas. No storm was more severe than one in northern Cape May and southern Atlantic counties that deposited 4.02” in Estell Manor and 3.23” in Woodbine, where a 42 mph wind gust was observed. This storm cell included large hail up to 1.75” in diameter that pummeled the Petersburg section of Upper Township (Cape May) as witnessed by the photos in Figure 3. Other rainfall totals included 2.79” in Hammonton (Atlantic), Galloway 2.62”, and Brigantine (Atlantic) 2.22” (Figure 4).
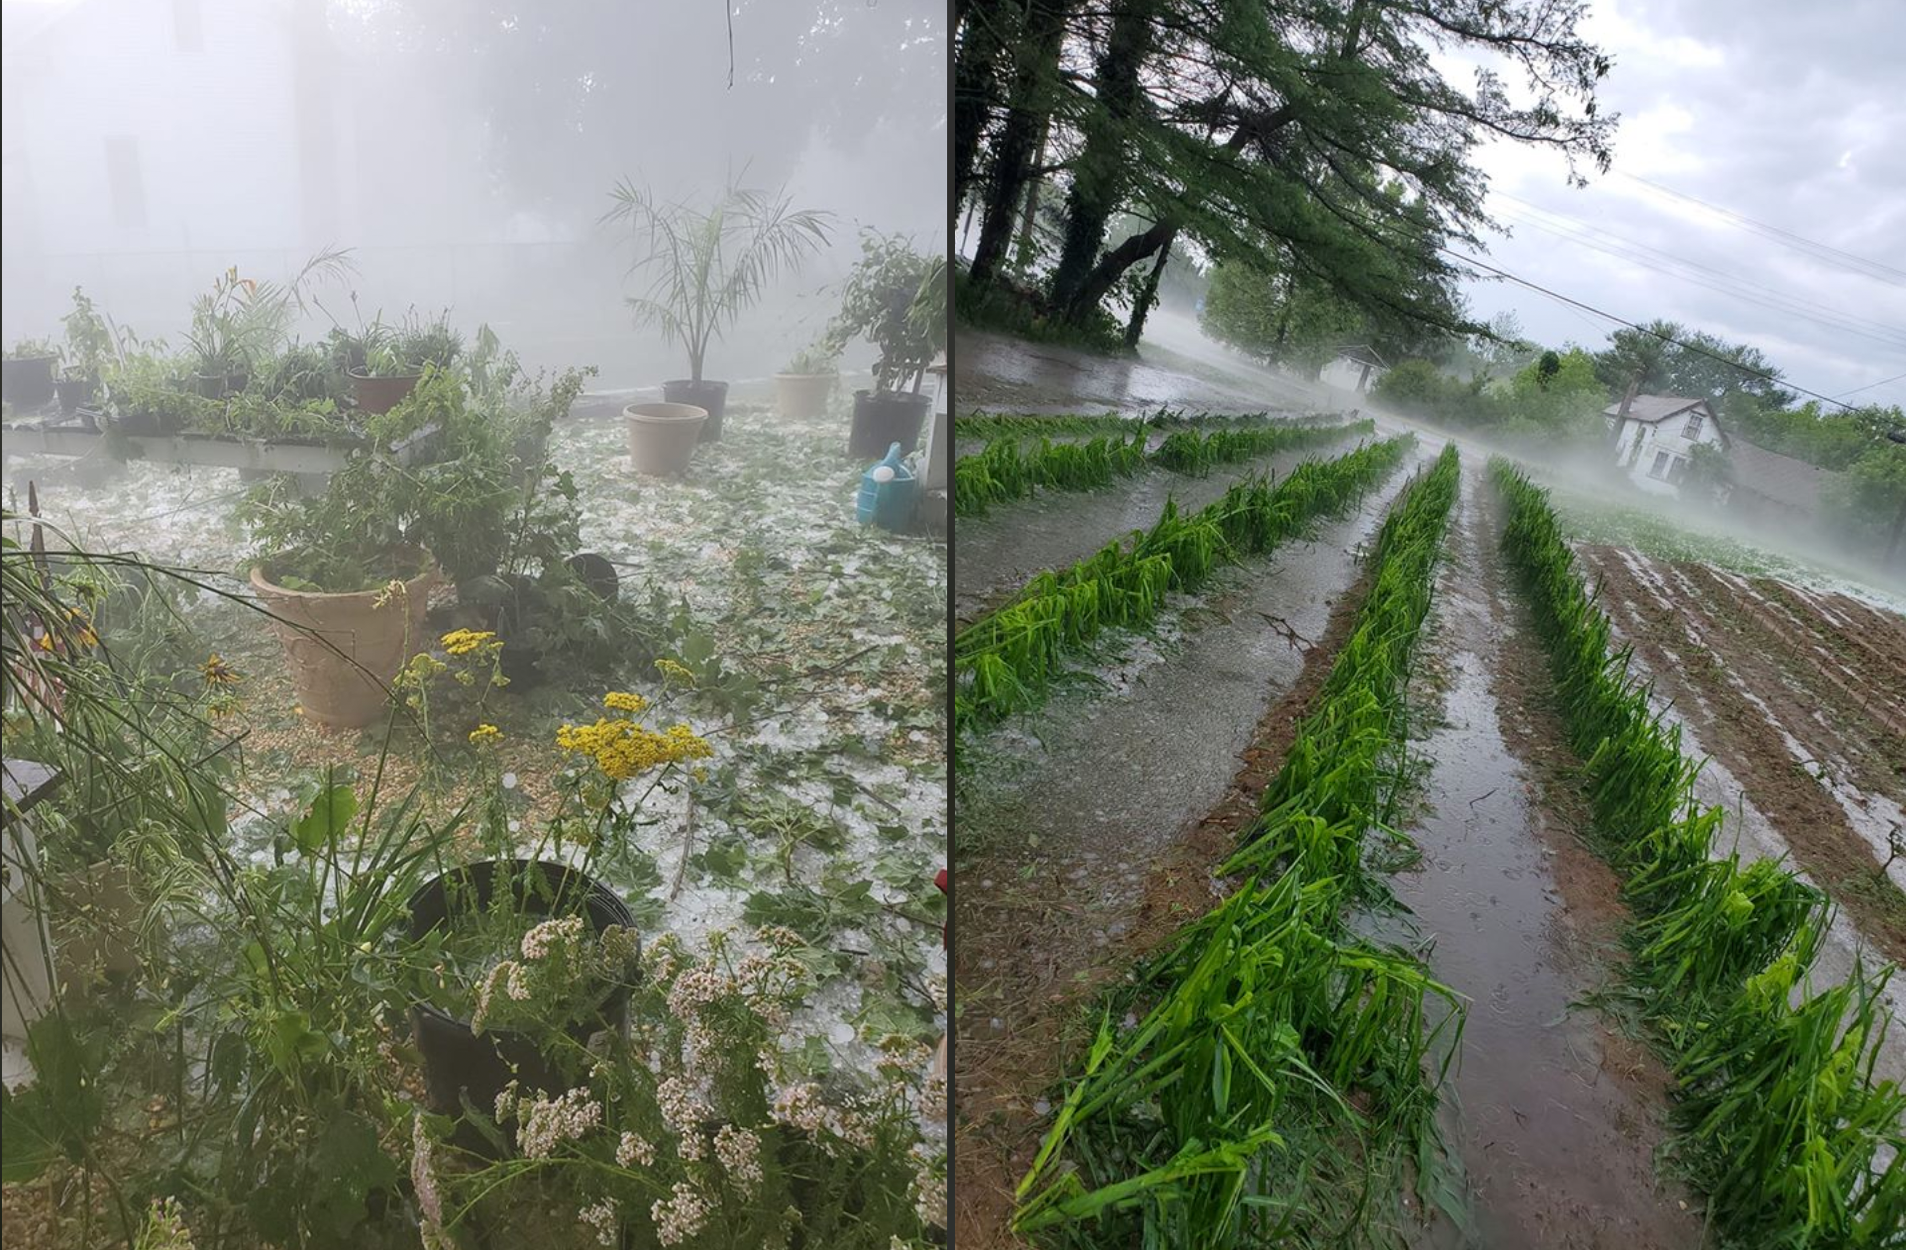
Figure 3. Hail damage in Upper Township (Cape May) on July 1st. In addition to the visible hail in the left image and the damage to crops in the right, notice the fog that formed when the milder humid air met the hail-cooled surface.
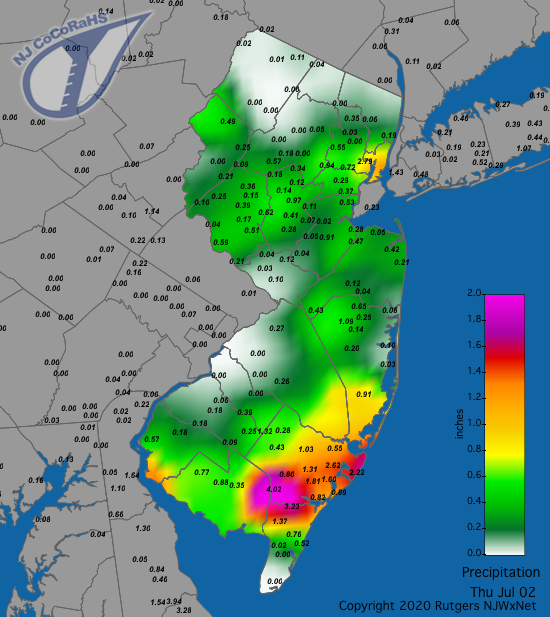
Figure 4. Rainfall from approximately 7AM on July 1st to 7AM on July 2nd. Reports are from CoCoRaHS observers.
Widely-scattered storms brought 1.07” to Jackson (Ocean) and 0.65” at Franklin (Sussex) on the 2nd. Evening storms delivered from 0.68” to 1.93” at three Princeton (Mercer) stations on the 3rd, along with 1.45” in Upper Freehold (Monmouth) and 1.24” in Cream Ridge (Monmouth). Afternoon storms on the 5th just missed the inch mark at Galloway with 0.99” and 0.86” in Washington Township (Gloucester).
A formidable storm outbreak occurred during the afternoon of the 6th. A severe storm moved out of Pennsylvania at the north end of Philadelphia and, once in NJ, blossomed into a fascinating outbreak of storms heading north, east, and south. Hourly radar and temperature observations show the cool outflow as the storm entered a hot and unstable air mass in NJ. From there, cells expanded outward, as evidenced by the circular outflow boundary on the radar images, with heavy rain confined mostly inside the growing circular rain-cooled outflow, which helped spawn additional storms as it progressed outward (Figure 5). Rainfall totaled 3.25” and 3.18” at two Moorestown locations, 3.07” and 2.95” at Hammonton sites, 2.58” and 2.68” in Chatham (Morris), 2.65” at Riverton (Burlington), and 2.62” at Folsom (Atlantic). Some 21 of the 255 reporting CoCoRaHS stations had 2.00”–3.25” and 42 from 1.00”–1.99” (Figure 6). Winds gusted to 66 mph at Berkeley Township, 61 mph in Fortescue, Sicklerville 47 mph, and Oswego Lake (Burlington) 42 mph. A storm in Robbinsville (Mercer) contained hail up to golf ball size that did considerable damage to roofs, siding, vehicles, and vegetation.
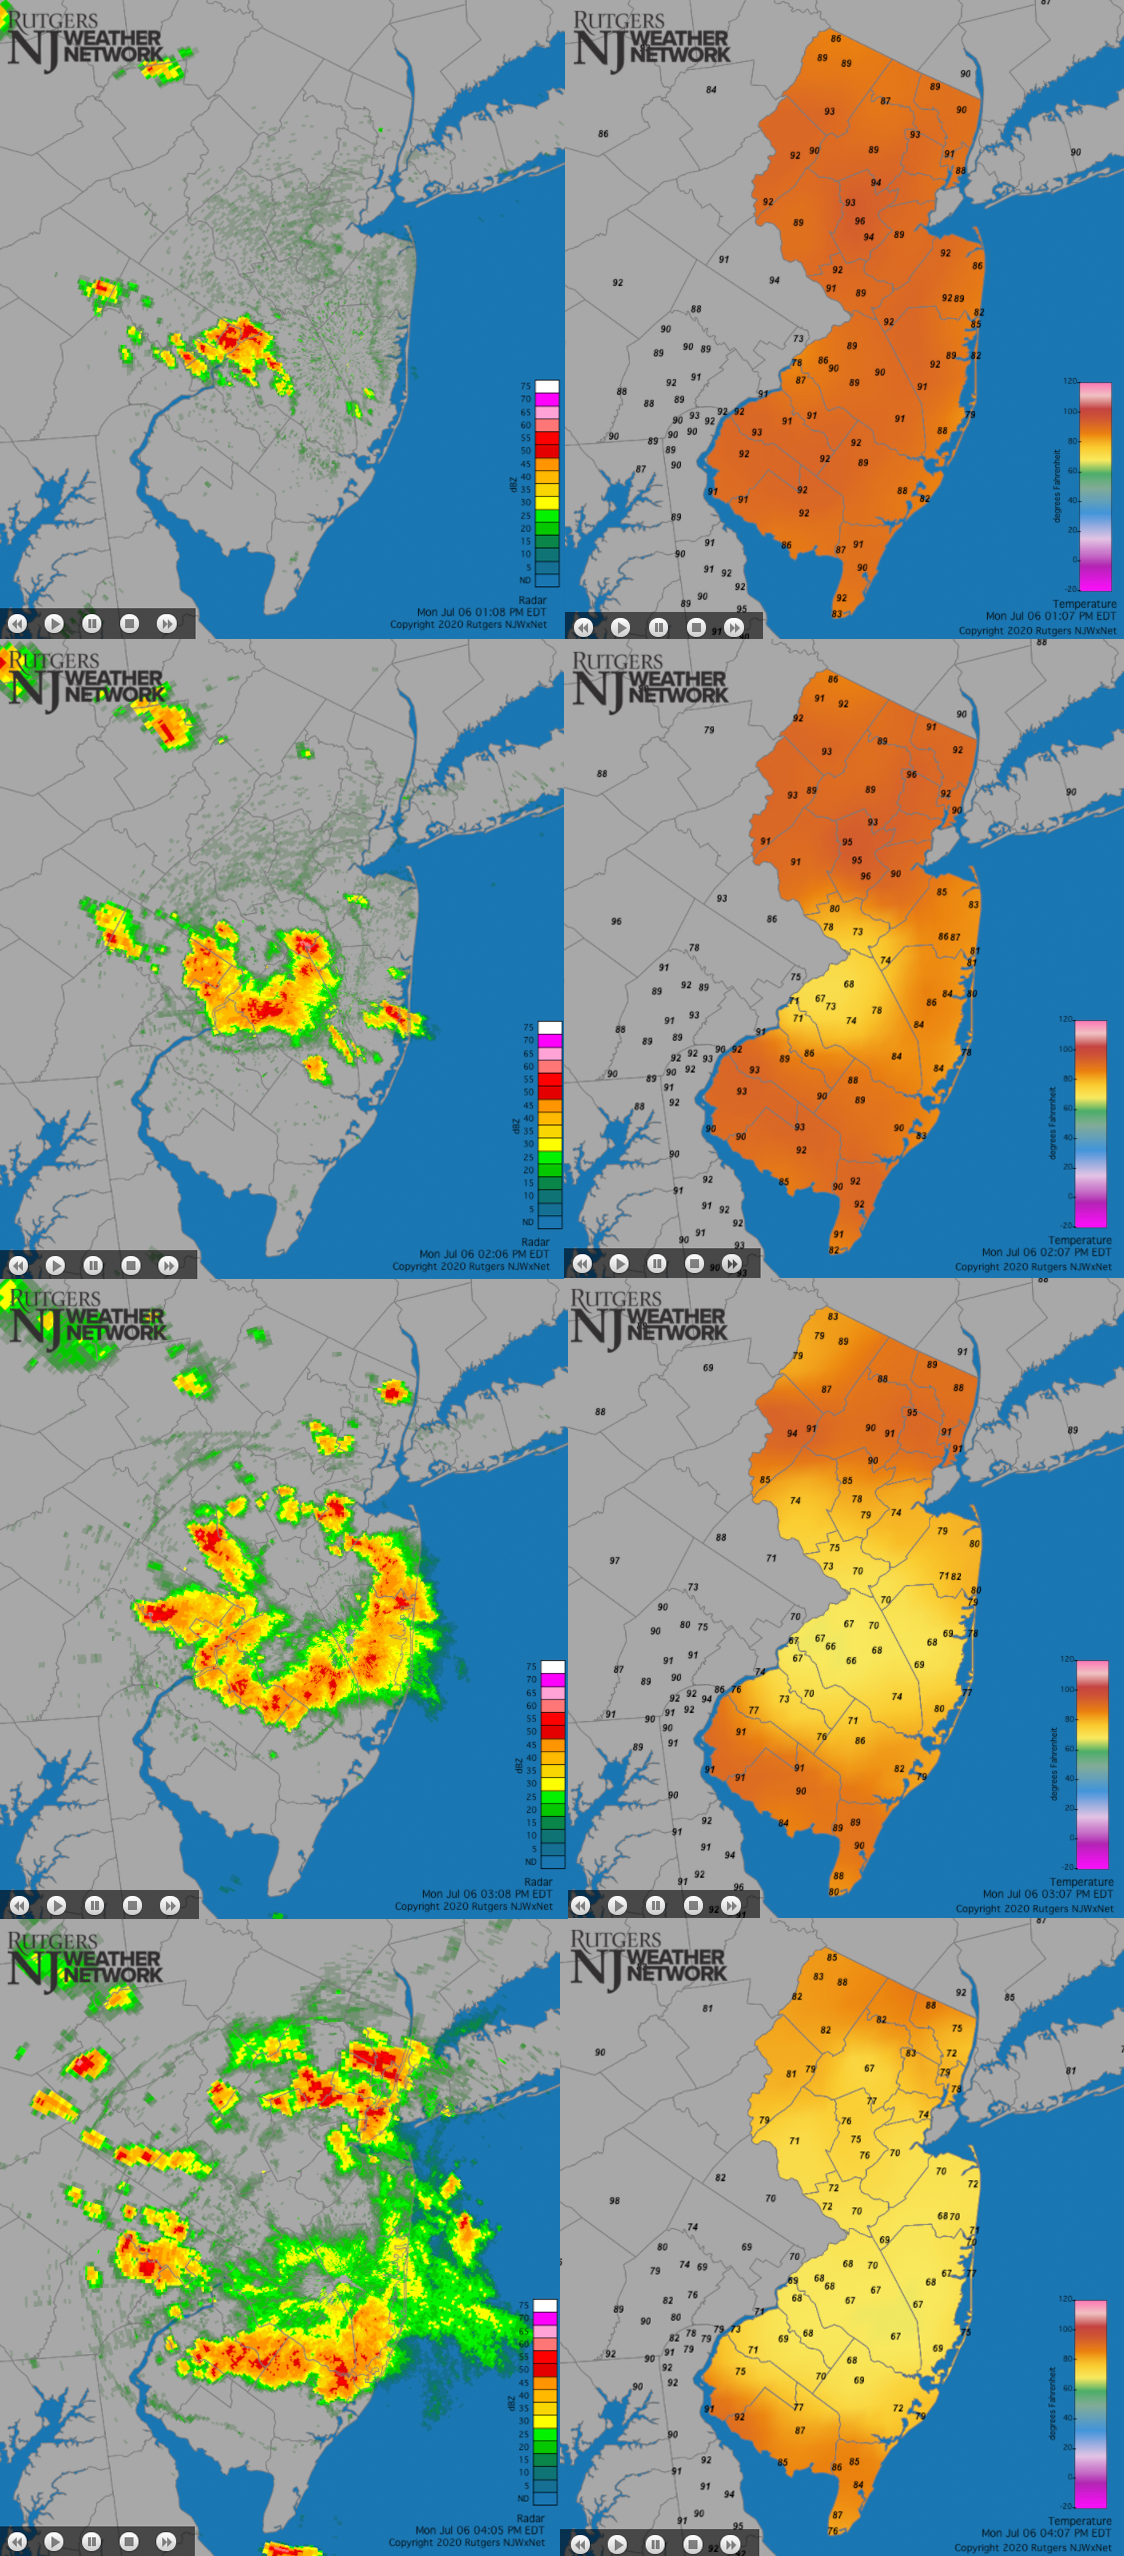
Figure 5. NWS radar (left) and NJWxNet temperatures (right) shortly after the hours of 1PM (top) through 4PM (bottom) on July 6th.
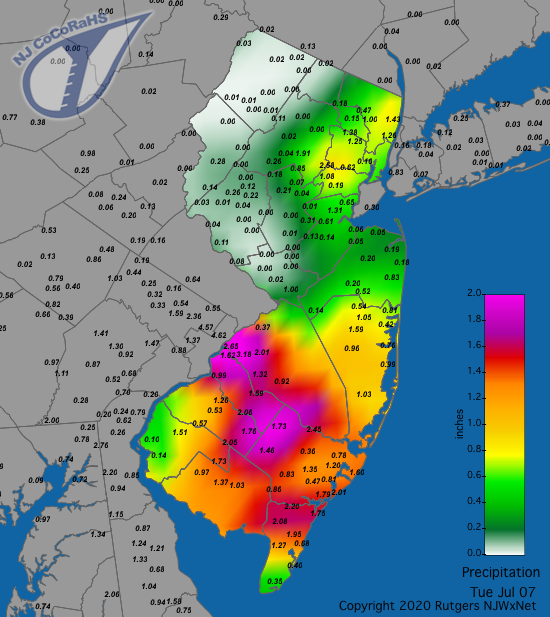
Figure 6. Rainfall from approximately 7AM on 6th to 7AM on July 7th. Reports are from CoCoRaHS observers.
The 7th saw late-afternoon and early-evening storms deliver from 0.68” to 1.10” at three Ewing stations and a gust of 40 mph far to the south in Fortescue. Mid-afternoon on the 8th saw High Point Monument catch 1.28”, High Point 1.21”, Franklin Township (Somerset) 1.08”, and Flemington (Hunterdon) 1.06”.
The major event of the month occurred on the 10th when Tropical Storm Fay paid NJ a visit. Making landfall at about 5PM near Little Egg Harbor (Atlantic) and then hugging the coast on its journey to northeast NJ, Fay was a welcome rain producer. It was accompanied by modest winds and an absence of coastal or inland flooding. Fay was the earliest named sixth storm of the season on record and the first to make landfall in the Garden State since Irene in August 2011. Over 300 CoCoRaHS, NJWxNet, and NWS Cooperative observations were used to generate the storm total map shown in Figure 7. Top values included 6.23” and 5.21” in South Harrison, Franklin Township (Gloucester) 5.52”, Wenonah (Gloucester) 4.99”, Stockton (Hunterdon) 4.86”, and Pitman (Gloucester) 4.84”. Of the 264 CoCoRaHS reports, four exceeded 5.00”, 19 were from 4.00”–4.99”, 64 from 3.00”–3.99”, 158 from 2.00”–2.99”, and 19 from 1.48”–1.99”. The peak wind gust at NJWxNet stations was 57 mph at Sea Girt, with gusts to 46 mph at Atlantic City Marina and Seaside Heights, Lower Alloways Creek Township (Salem) 44 mph, Harvey Cedars 43 mph, Fortescue 41 mph, and West Cape May 40 mph.
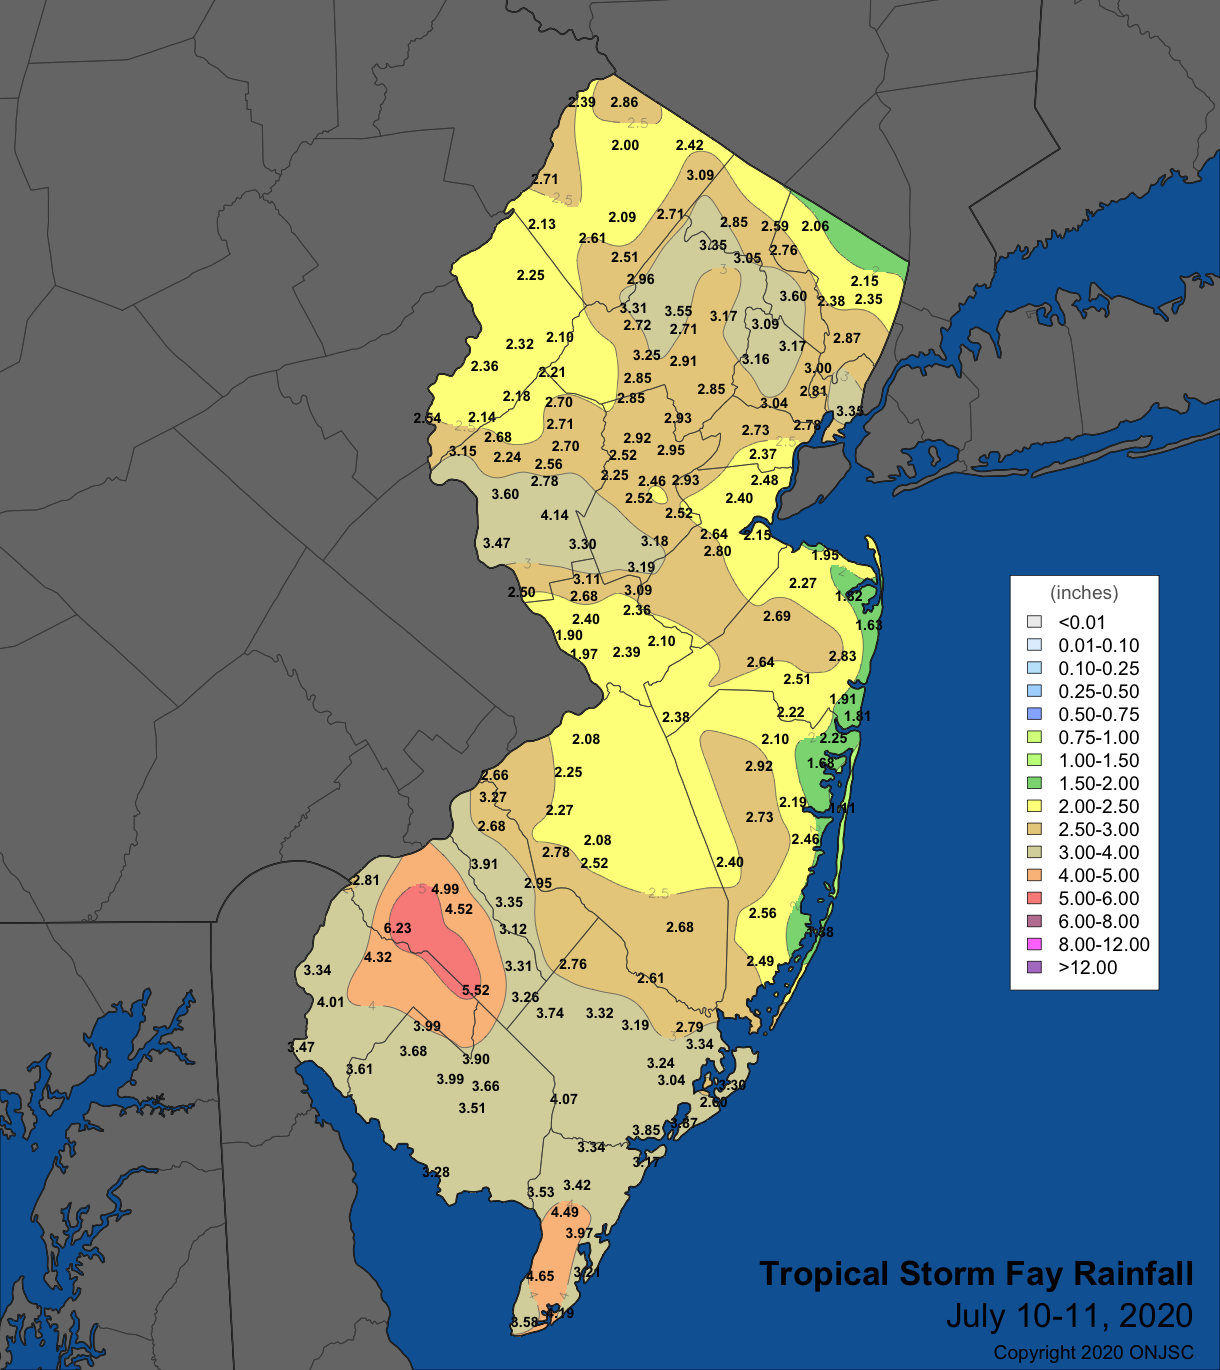
Figure 7. Rainfall from Tropical Storm Fay on July 10th to 11th, based on NJWxNet, CoCoRaHS, and NWS reports.
Following Fay were eleven days of generally quiet weather, with plenty of sun, along with scattered storms and showers on the 11th, 12th, 17th, 19th, 20th (with a gust to 47 mph in Mansfield), and 21st (with a gust to 60 mph at Fortescue). This was not to last, as four events in the final ten days of July featured storms that deposited two or more inches of rain at multiple locations. The first event was during the evening of the 22nd, with the strongest storms from Warren eastward to Union and Middlesex counties (Figure 8). Pequest took top honors with 2.76”, followed by 2.33” in Califon (Hunterdon), Franklin (Somerset) 2.31”, Jersey City (Hudson) 2.30”, Cranford (Union) 2.29”, and Washington Township (Warren) 2.05”. 42 of the 266 CoCoRaHS reports were from 1.00”–1.97”. South Jersey saw some storms too, with wind gusts reaching 59 mph at Lower Alloways Creek Township, 55 mph in Harvey Cedars, and 40–45 mph at seven other locations around NJ.
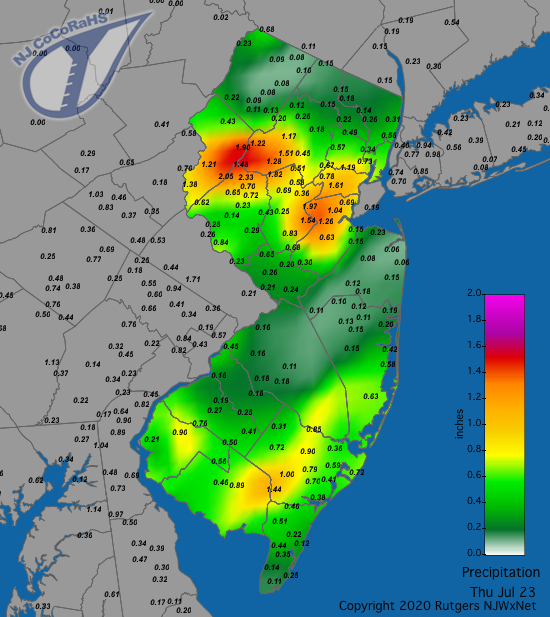
Figure 8. Rainfall from approximately 7AM on July 22nd to 7AM on July 23rd. Reports are from CoCoRaHS observers.
Central Jersey was again the focal point of strong storms in the early morning hours of the 24th. Impressive totals included 3.65” in Matawan (Monmouth), South River (Middlesex) 3.38”, East Brunswick (Middlesex) 3.16” and 3.10”, New Brunswick (Middlesex) 2.82”, and Holmdel (Monmouth) 2.62” (Figure 9). In the southwest, Lower Alloways Creek Township managed a 44 mph gust.
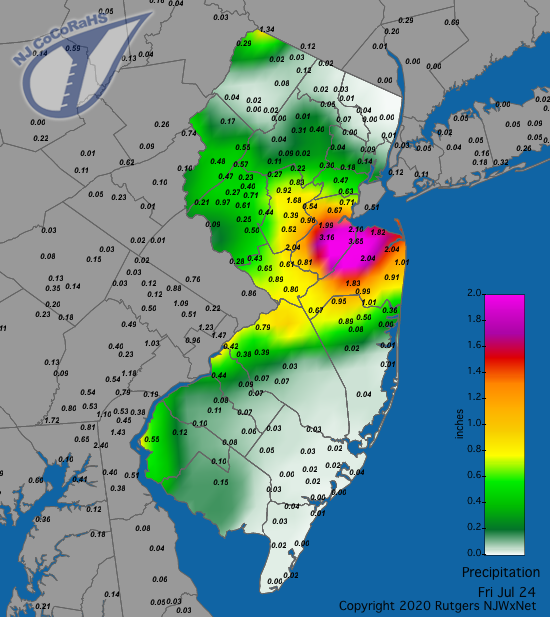
Figure 9. Rainfall from approximately 7AM on July 23rd to 7AM on July 24th. Reports are from CoCoRaHS observers.
The action shifted south during the afternoon of the 24th, with storms depositing 2.78” in Egg Harbor Township, four stations in Hammonton catching from 1.63”–2.40”, Dennis (Cape May) 2.19”, and Berkeley Township 2.11”. Ten percent of the 240 CoCoRaHS observations from 7AM on the 24th to 7AM on the 25th were between 1.00”–1.99” (Figure 10).
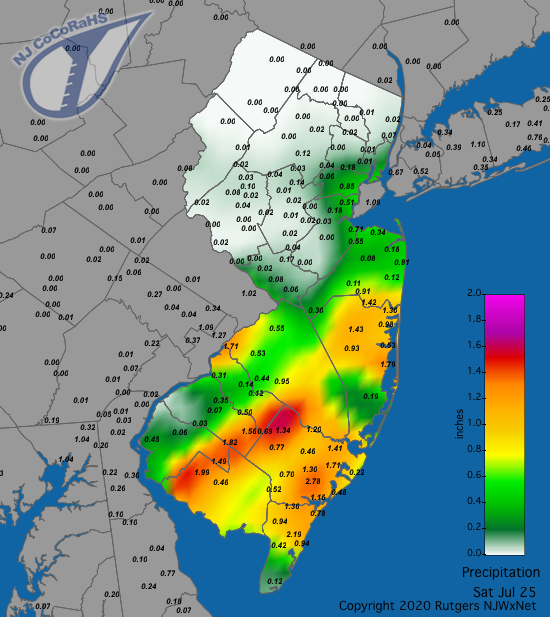
Figure 10. Rainfall from approximately 7AM on July 24th to 7AM on July 25th. Reports are from CoCoRaHS observers.
The PM hours of the 30th found showers scattered in the southwest and north, bringing as much as 1.13” to Fortescue where the wind gusted to 45 mph. Lower Alloways Creek Township also gusted to 45 mph and Moorestown to 47 mph. Storms ramped up late in the evening and into the pre-dawn hours of the 31st, especially in central NJ through Hunterdon, Somerset, and Middlesex counties. The heaviest totals included 2.30”–2.76” in Franklin Township (Somerset), 2.07”–2.37” in Franklin Township (Hunterdon), 2.18” at Highland Park (Middlesex), and 2.10”–2.15” in Piscataway (Middlesex; Figure 11). 31 of the 261 CoCoRaHS reports were from 1.00”–1.84”.
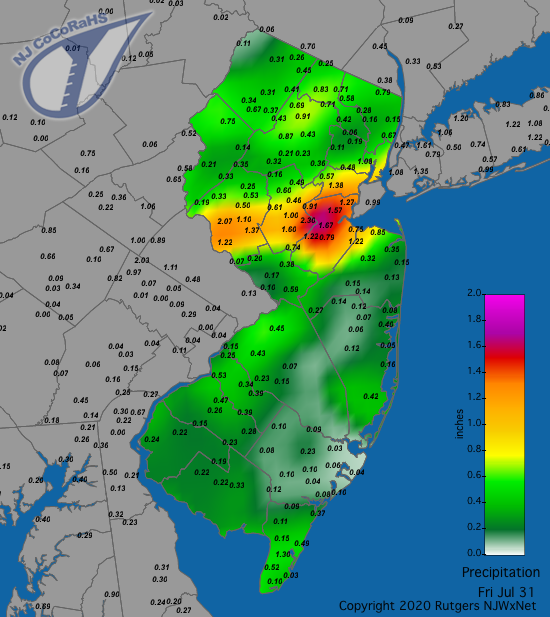
Figure 11. Rainfall from approximately 7AM on July 30th to 7AM on July 31st. Reports are from CoCoRaHS observers.
The lowest barometric pressure around the state was on the 10th, associated with Fay, with readings from 29.55”–29.60”. This is not a particularly low value for a tropical system. The highest pressure was not all that high either, coming in close to 30.30” on the 16th.
For those seeking more detailed information on 5-minute, hourly, daily, and monthly conditions, please visit the following Office of the NJ State Climatologist's websites:
Rutgers NJ Weather Network
NJ Community Collaborative Rain, Hail and Snow Network
NJ Snow Event Reports
Interested in receiving our monthly summaries at the end of each month? Send us your e-mail address here to join the mailing list.
Past News Stories

