Roasting: August 2022 Recap and Summer Overview
New Jersey State Climatologist
Center for Environmental Prediction, School of Environmental and Biological Sciences/NJAES
Rutgers University
September 7, 2022
August Overview
Much like this past July, August was a hotter and drier month than normal. Despite a June with rather close-to-normal numbers, the two most recent months brought the summer temperature and precipitation to top-10 levels for hot and dry conditions. More on summer ’22 later in this report, but first to discuss is a record hot and quite dry August.
The August average temperature of 77.4° was 3.8° above the 1991–2020 normal, ranking as the hottest on record (Table 1). Eight of the ten warmest Augusts since 1895 have occurred since 2001. The average maximum of 88.5° was 4.7° above normal, the hottest on record, while the average minimum of 66.2° was 2.9° above normal, tied for 5th warmest. North Jersey averaged 75.7° (+3.8°, warmest on record), the south 78.4° (+3.8°, warmest on record), and the coast 77.9° (+3.2°, 3rd warmest).
| Rank | Year | Aug. Avg. Temp. |
| 1 | 2022 | 77.4° |
| 2 | 2016 | 76.9° |
| 3 | 2018 | 76.8° |
| 4 | 2005 | 76.4° |
| 5 | 2021 | 75.8° |
| 6 | 2002 | 75.8° |
| 7 | 1980 | 75.6° |
| 8 | 2020 | 75.5° |
| 8 | 2001 | 75.5° |
| 8 | 1955 | 75.5° |
Table 1. The 10 warmest Augusts across New Jersey since 1895.
Statewide, August precipitation averaged 2.61”, which is 1.96” below normal, ranking as the 22nd driest. The north came in at 2.31” (-2.25”, 18th driest), south 2.82” (-1.75”, 29th driest), and coast 2.54” (-2.06”, 25th driest). As the map shows, virtually the entire state had a monthly total below the statewide 4.57” normal (Figure 1). Exceptions were found in isolated west central and central coastal areas where several storms quickly deposited hefty totals. Less than half the normal monthly rainfall fell in a good portion of the north and in scattered areas of the south and north coast.
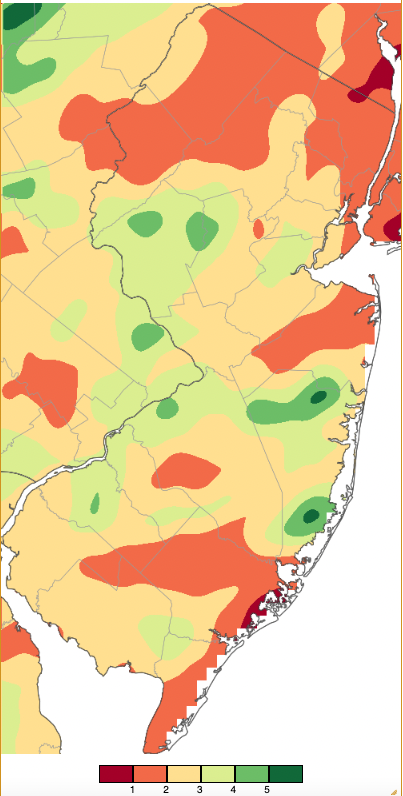
Figure 1. August 2022 precipitation across New Jersey based on a PRISM (Oregon State University) analysis generated using NWS Cooperative and CoCoRaHS observations from 7AM on July 31st to 7AM on August 31st. Note the scale in full inches at the bottom of the map. Totals range from 0.00–1.00” (dark red) to 5.00”–6.00” (dark green).
Temperature
On 21 August days one or more of the 67 Rutgers NJWxNet stations reached a maximum of 90° or higher. This lies just below the count of 24 such days this past July. Eight of those days saw somewhere reach at least 95°. Four stations reached 94° on both the 2nd and 3rd. This was the start of ten consecutive days of 90° weather in New Jersey. The 4th saw Hillsborough-Duke (Somerset County), Hamilton (Mercer), and Piney Hollow (Gloucester) top out at 99°. 54 NJWxNet stations were between 90°–98°, with Harvey Cedars (Ocean) “coolest” at 82°. Berkeley Township (Ocean) was hottest at 95° on the 5th, with eight stations up to 94° on the 6th. Berkeley Township was again warmest at 97° on the 7th, with 58 stations from 90°–96°. Jersey City (Hudson) and New Brunswick (Middlesex) hit 98° on the 8th with 56 other stations in the 90°s.
The hottest day of the month was the 9th with Toms River (Ocean) a blistering 101° and seven stations at 100°. 41 others were from 95°–99° and 12 from 90°–94°. This left just six NJWxNet stations in the 80°s, the lowest being Harvey Cedars at 83°. As Figure 2 shows, only higher elevations of the northwest (and in the PA Poconos) and coastal areas stayed in the 80°s. It was not just the heat but also the humidity that made the 9th a dangerously uncomfortable day. Mid-afternoon temperatures near their maximum (except where showers had slightly cooled the northwest) and dew points in the low to mid 70°s most everywhere generated heat index values between 100°–110° (Figure 3).
The thermal impact of sea breeze conditions along the immediate coast was notable on the 9th, as exemplified by time series at the Sea Girt (Monmouth) and Seaside Heights (Ocean) stations in comparison to the steady daytime rise and fall of the temperature at Toms River, just several miles inland (Figure 4). Sea breeze-induced cooling of up to 15° was infrequent at Sea Girt while more common at Seaside Heights. Meanwhile, Toms River continually sat over 90° from 10 AM to 8 PM.
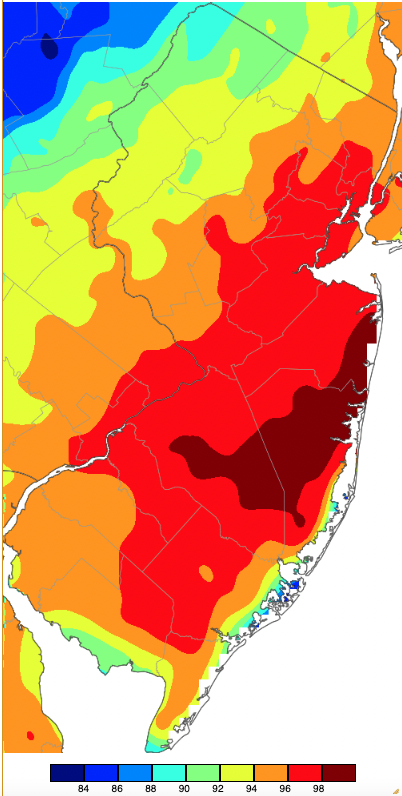
Figure 2. Maximum temperatures on August 9th based on a PRISM (Oregon State University) analysis generated using NWS, NJWxNet, and other professional weather stations. Note the 2-degree increment scale beneath the map.

Figure 3. Surface air temperature (top), dew point (middle), and heat index (bottom) at 2:50 PM EDT on August 9th. Observations are from Rutgers NJ Weather Network, National Weather Service airport stations, Shrewsbury Weather Network, and Delaware Environmental Observing System Network, with the heat index calculated from the observed temperature and humidity data.
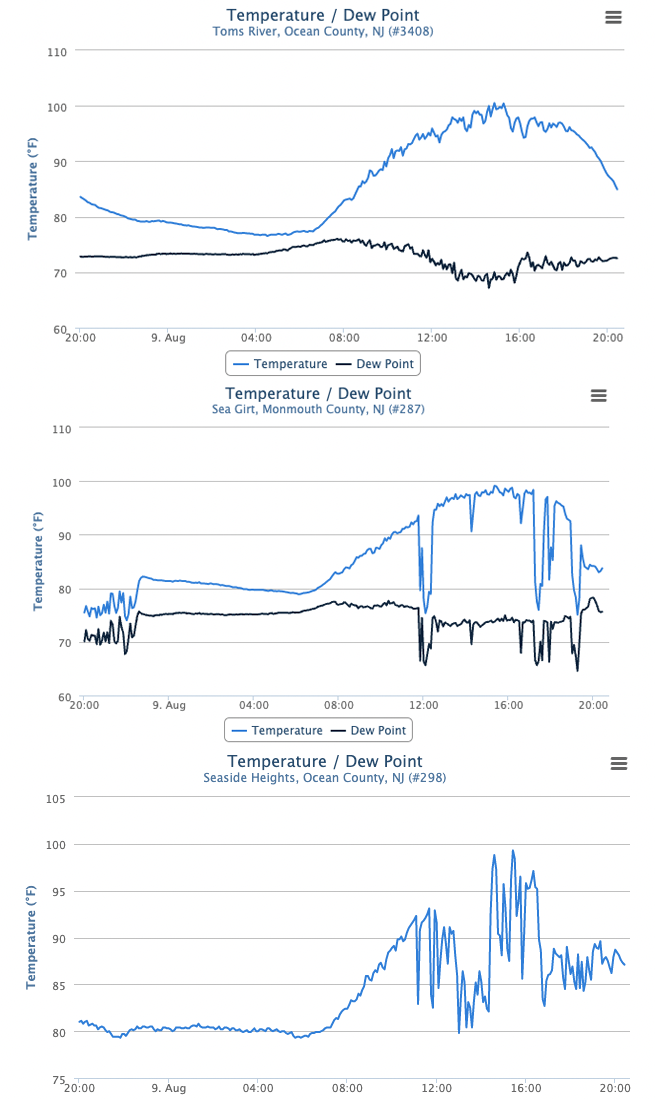
Figure 4. Time series of temperature and dew point at the Toms River (top), Sea Girt (middle), and Seaside Heights (bottom) NJWxNet stations from 8:00PM on August 8th to 8:00PM on August 9th. Dew point observations are not available at Seaside Heights.
The heat on the 9th was followed by a 95° reading at Hammonton (Atlantic) on the 10th and 92° in New Brunswick on the 11th. Looking back at the 31 days from July 12th through August 111h, the average temperature of 81.3° at New Brunswick was the warmest of any such interval on record dating back to 1896. A 21-day record of 81.9° was also set from July 21st–August 10th. The previous records were 80.7° from June 24th–July 24th, 2013, and 81.6° from July 4th–July 24th, 2013.
Dry conditions prevailed for the next week, including welcome low levels of humidity. Days were commonly in the 80°s and cool nights in the 40°s and 50°s at many inland locations. This is exemplified by the time series of temperature and dew point at Hillsborough-Duke on the 14th (Figure 5). This contrasts with the moister atmosphere at Fortescue (Cumberland) on the Delaware Bay coast, where dew points were somewhat higher than inland, but most notably the diurnal temperature range was considerably lower. The range was 35° at Hillsborough-Duke (52°–87°) and just 7° at Fortescue (73°–80°).
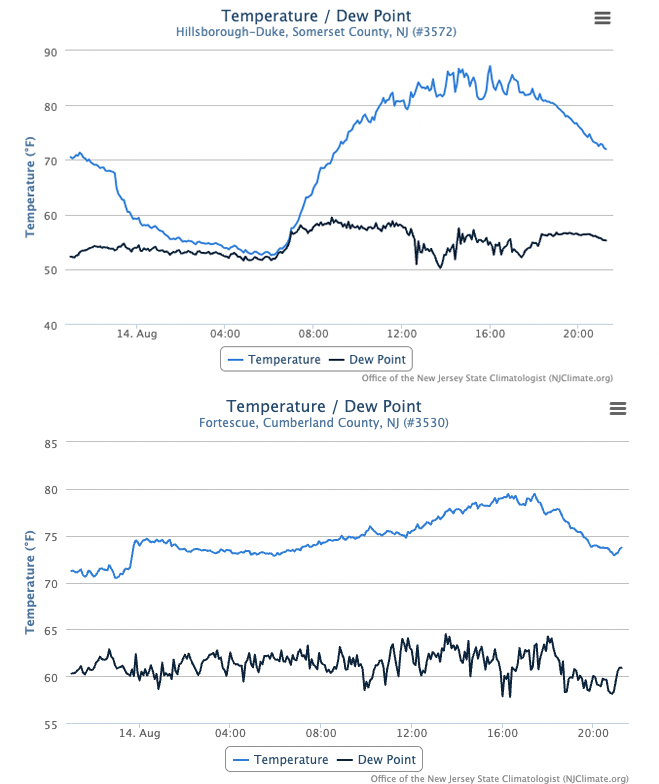
Figure 5. Time series of temperature and dew point at the Hillsborough-Duke (top) and Fortescue (bottom) NJWxNet stations from 9:20PM on August 13th to 9:20PM on August 14th.
The 90°s returned on the 18th with both Jersey City and Hillsborough-Duke up to 90°. Basking Ridge (Somerset), Hillsborough-Duke, and Piney Hollow all reached 94° on the 19th. Moorestown (Burlington) and Piney Hollow topped out at 95° on the 20th. An eight-day streak of 90° weather began on the 23rd, with Jersey City at 90°. Red Lion (Burlington) got to 93° on the 24th. Jersey City hit 94° on the 25th, with 40 stations close behind at 90°–93°. Sicklerville (Camden) and Hillsborough-Duke hit 93° on the 26th, with 36 sites from 90°–92°. Piney Hollow was at 93° on the 27th and South Harrison (Gloucester) 90° on the 28th. Five stations made it to 93° on the 29th. The last day of this string was the hottest, with Red Lion and Hamilton (Mercer) at 95° and 40 stations from 90°–94° on the 30th.
All told, 17 NJWxNet stations shared top honors for the network’s maximum temperature on at least one of the 21 90° plus days, demonstrating the wide-ranging nature of the often-relentless heat. The atmospheric warmth helped to generate the warmest surf temperature ever recorded (since 1911) at the Atlantic City Steel Pier (Atlantic) station on August 25th. As this report was prepared, the record is preliminary, however, if it holds, the 84.7° observation will enter the record book. This contrasts greatly with the surf temperatures in the 50°s for a time in July, before slowly warming in early August. The prevailing wind direction in mid to late August inhibited upwelling of cool water, as occurred during July. Also, it is possible that some warm bay water made it out into Atlantic coastal waters. A satellite image of sea surface temperatures shows the warmth of the coastal waters (aiding the warm nighttime temperatures at Fortescue; see Figure 5b), with considerable warmth in offshore waters too (Figure 6).
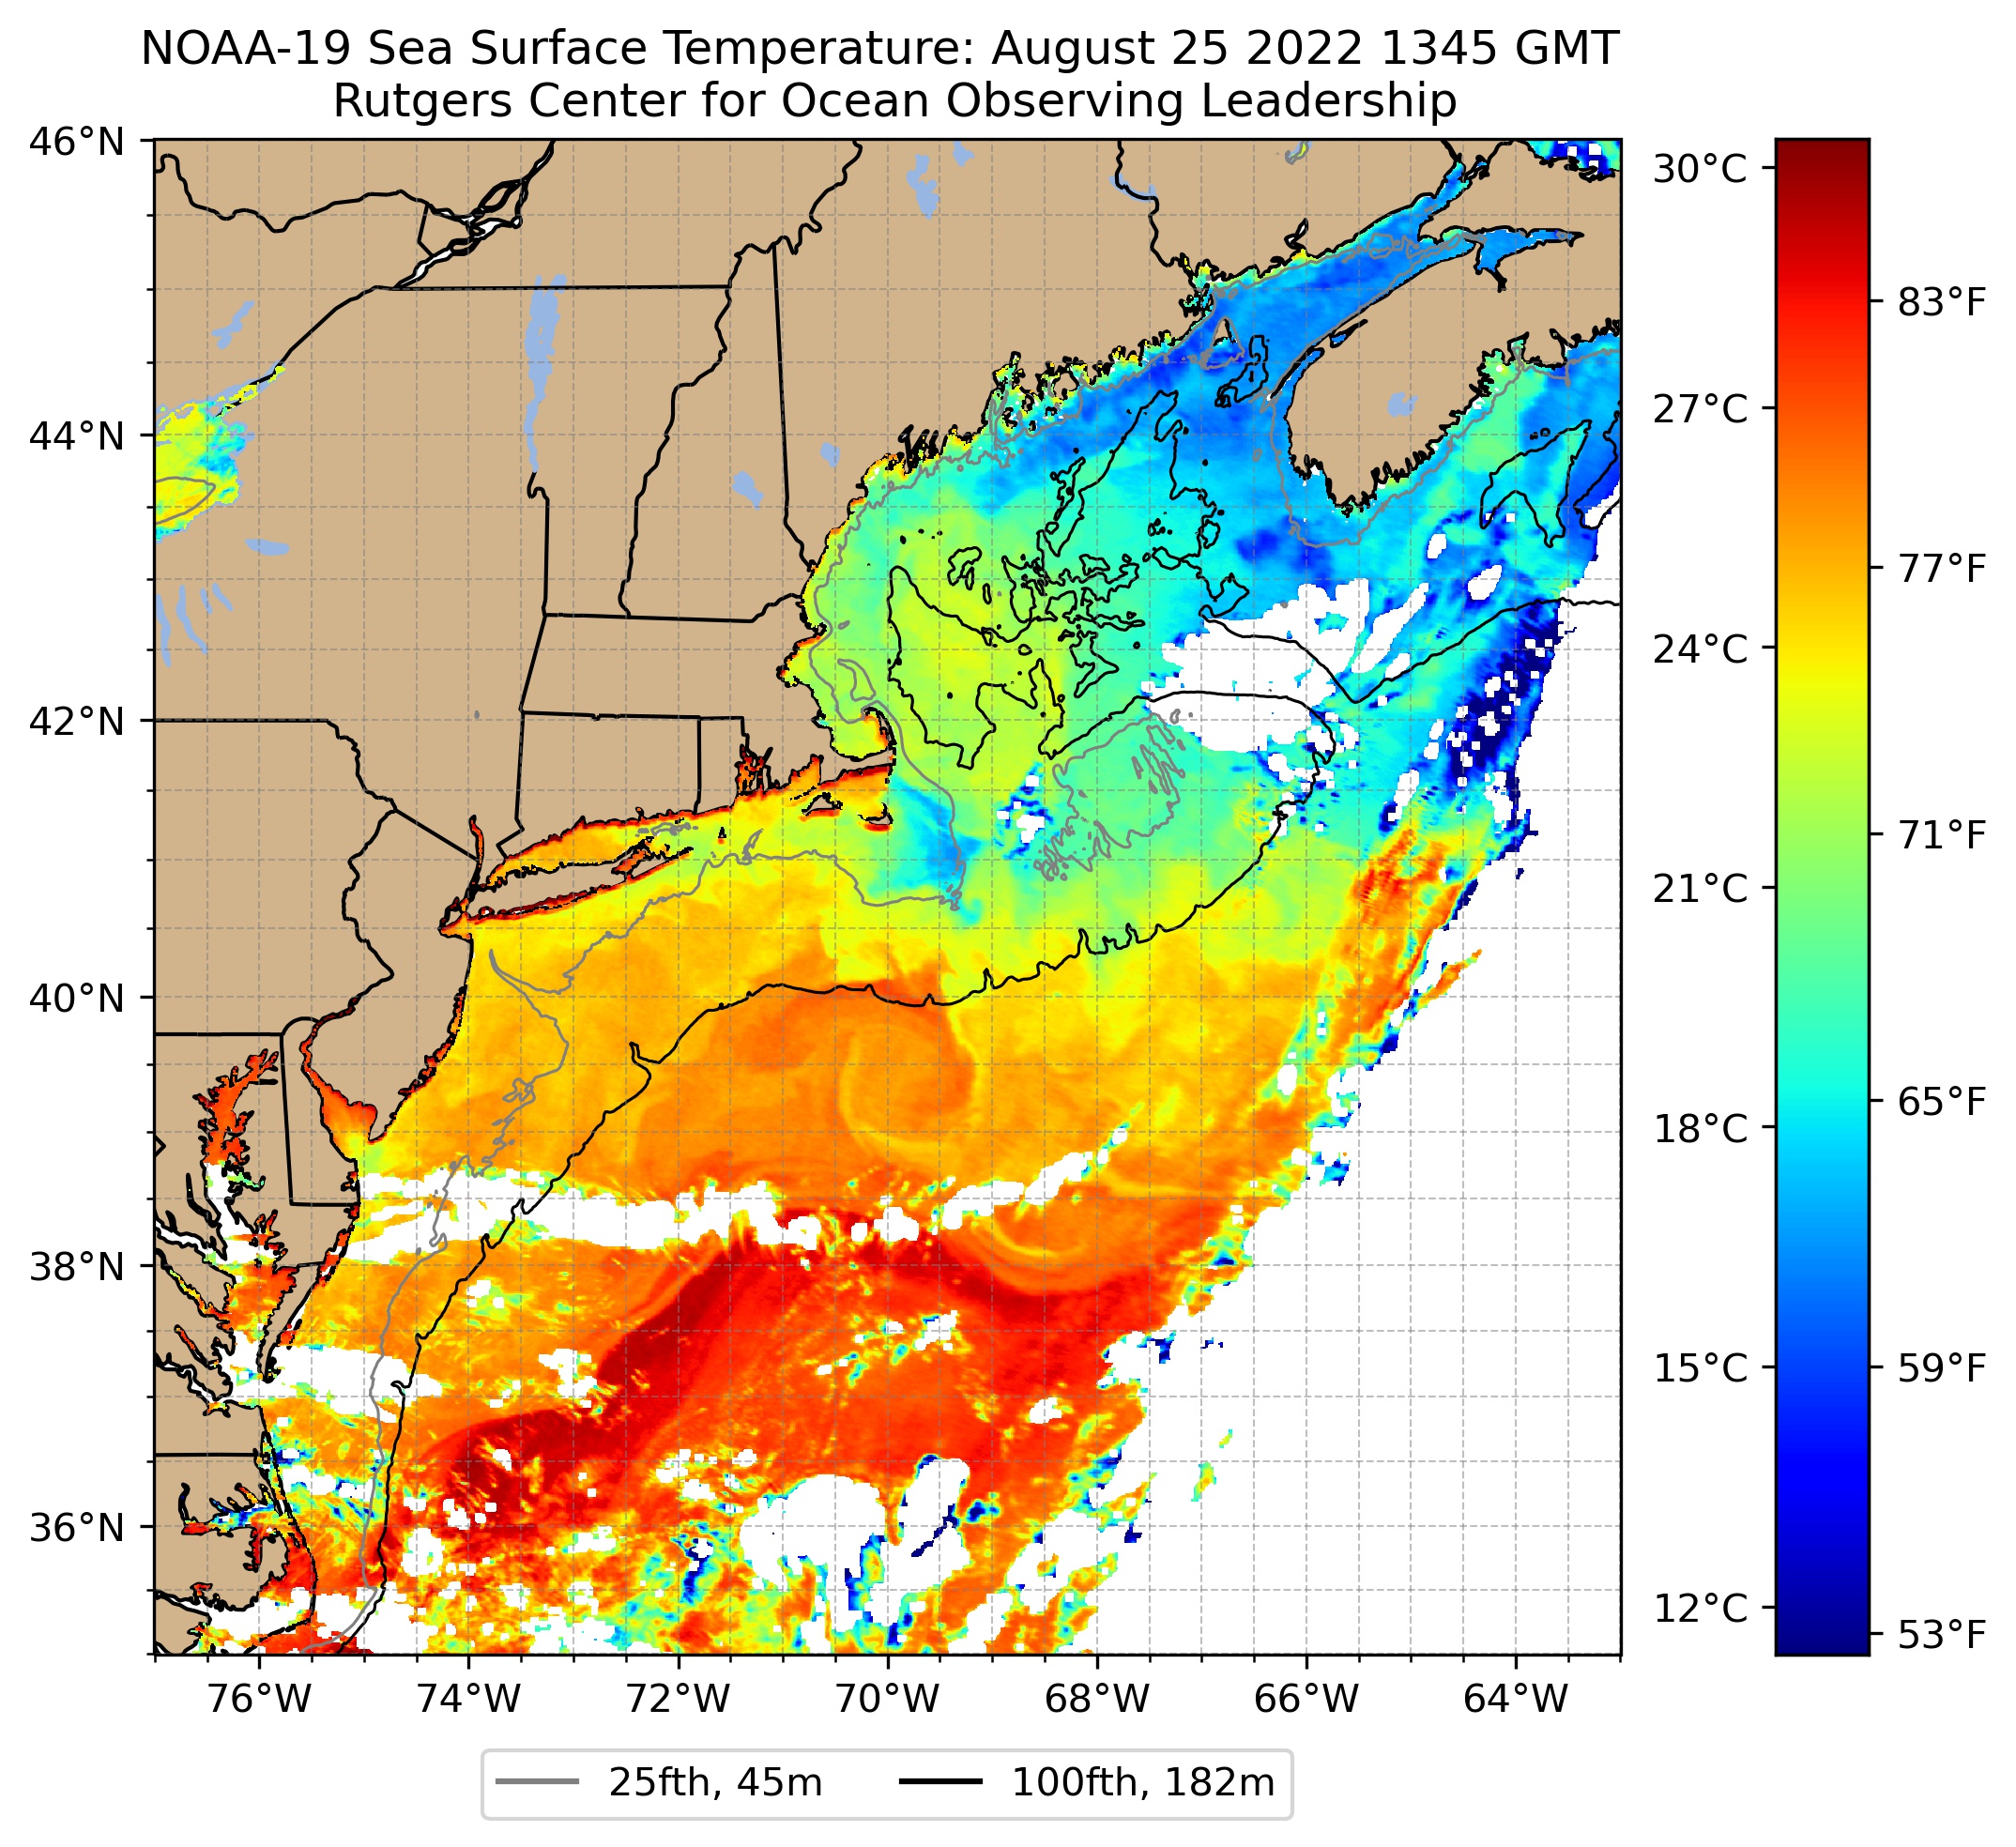
Figure 6. Sea Surface temperatures at 9:45 AM on August 25th based on data from the NOAA-19 satellite. Image courtesy of the Rutgers Center for Ocean Observing Leadership.
Unlike maximums, just four NJWxNet stations shared low temperature honors on the 11 August days when lows dropped to 55° or cooler at one or more locations. These were valley locations in the northwest where cool air pools into the lower reaches on calm, clear nights. Walpack (Sussex) started things off with a 55° low on the 1st. The humid warmth that followed led to all but Walpack and Sandyston (Sussex) having a low in the 70°s on the 7th (except Lyndhurst (Bergen) which only fell to 80°). The hot 9th began with Lyndhurst at a low of 82°, Fortescue 81°, and six locations at 80°, while Sea Girt was coolest at 65°.
With the arrival of dry air on the 12th, Walpack fell to 49°, Sandyston 53°, and Pequest (Warren) 55°. The 13th had the coolest morning of the month with Walpack dipping to 43°, Pequest and Sandyston each 46°, and 15 NJWxNet stations from 50°–55° (Figure 7). Lower Alloways Creek Township (Salem) on Delaware Bay was mildest at 67°. Walpack was 45° on the 14th, with 17 stations from 47°–55° and Fortescue only down to 73°. Walpack reached 51° on the 15th and 16th, joined by Basking Ridge on the 16th. Walpack dropped to 49° on the 17th, Pequest 50° on the 18th, and Walpack 49° on the 19th. As temperatures warmed on the 19th, Walpack rose to a high of 92°, resulting in a 43° diurnal temperature range. Meanwhile, the low was 74° and high 82° at Fortescue, an 8° diurnal range. Two more cool nights followed on the 25th when Sandyston and Walpack reached 55°, and the 31st with Walpack at 53°.
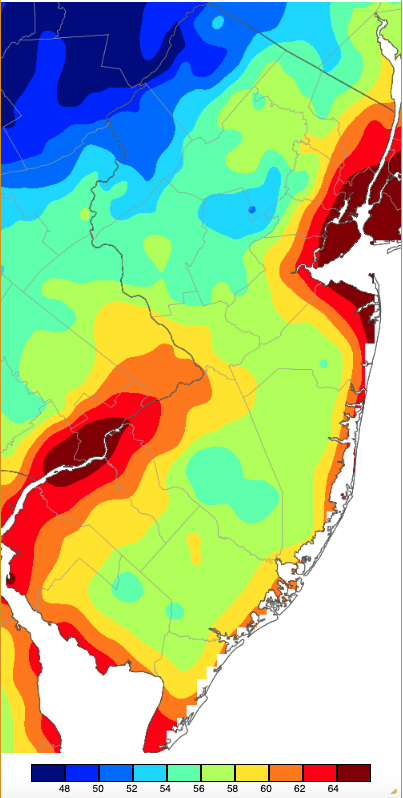
Figure 7. Minimum temperatures on August 13th based on a PRISM (Oregon State University) analysis generated using NWS, NJWxNet, and other professional weather stations. Note the 2-degree increment scale beneath the map.
Precipitation and Storms
Stations that caught hefty deluges at one time or another during August led the way with monthly rainfall totals. The wettest stations, along with their peak daily rainfall total (which contributed the lion’s share of the monthly total) follow. Barnegat Township (Ocean) caught 6.57” for the month with a peak 4.43” day, Bedminster (Somerset) 6.42” (5.39” in a single day), Lakewood (Ocean) 6.33” (4.30”), Howell (Monmouth) 6.10” (4.14”), Stafford Township (Ocean) 6.00” (3.70”), and Chester (Morris) 5.76” (5.20”). The driest locations could not eclipse the 1.00” mark for the month. These included Little Egg Harbor Township (Ocean) at 0.45”, Ocean City (Cape May) 0.65”, Egg Harbor Township (Atlantic) 0.70”, Wildwood Crest (Cape May) 0.71”, Sicklerville 0.79”, Egg Harbor City (Atlantic) 0.76” and 0.77” (two stations), Absecon (Atlantic) 0.95”, and Hamilton (Atlantic) and Brigantine (Atlantic) each 1.00”.
There were 14 events during August where a NJWxNet or NJ CoCoRaHS station caught at least 0.50” of rain. Nine of these had stations exceed 1.00”. Early on the 1st, Hopewell Township (Mercer) received 0.84”, with a Franklin Township (Somerset) station at 0.72”. A common term for the month’s rain, namely “widely scattered showers”, brought 2.69” to Ewing (Mercer), Helmetta (Middlesex) 1.64”, Manville (Somerset) 1.20”, and Fortescue 1.36” on the 4th. This was the windiest system of the month, the only day with NJWxNet stations gusting over 40 mph, including 59 mph at Lower Alloways Creek Township, 42 mph in Fortescue, and 40 mph at Mannington (Salem).
The first localized deluges of the month struck extreme northeast Ocean and southeast Monmouth counties on the afternoon into the evening of the 5th. Lakewood received 4.30”, Howell 4.14”, and Jackson Township (two stations; Ocean) 3.65” and 2.57” (Figure 8). Flash flooding and some tree damage from high winds ensued. Close by, little to no rain fell, including a 0.00” report in Howell in contrast to the 4.14” report listed above from the very same town. Another downpour deposited 3.32” at Hopewell Township and 1.37” and 1.21” (two stations) in Pennington (Mercer). Of the 240 CoCoRaHS stations reporting, just 10 caught more than 1.00” and 13 from 0.50”–0.99”.
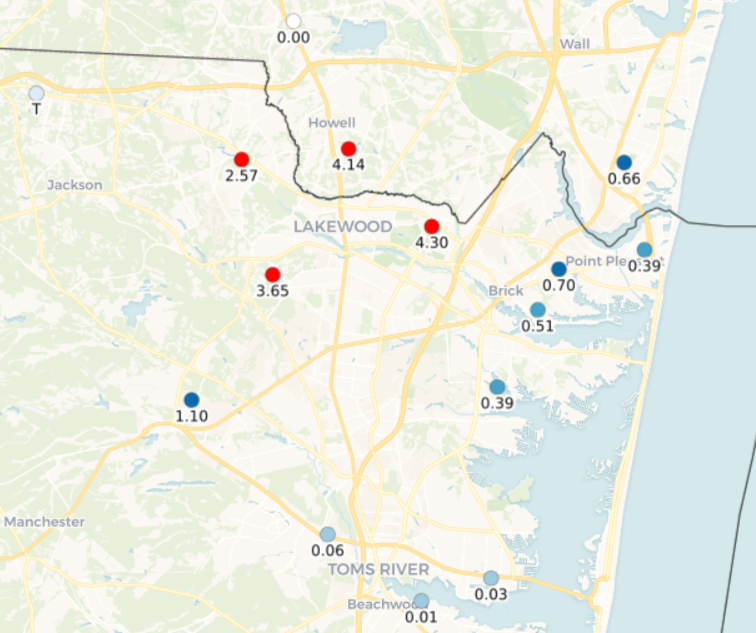
Figure 8. Precipitation across northeastern Ocean County and southeastern Monmouth County from approximately 7AM on August 5th through 7AM August 6th based on NJ CoCoRaHS observations. Rainfall totals are in inches.
Widely scattered afternoon thunderstorms on the 7th brought down some trees and power lines in Union County and dropped 0.66” at Metuchen (Middlesex) and 0.62” at Franklin Township (Somerset). A similar situation on the 9th brought Pine Beach (Ocean) 1.14”, Berkeley Township 1.07”, Medford Township (Burlington) 1.02”, and Toms River 1.02”. One of the more substantial rainfall events of a paltry precipitation month visited the south on the morning of the 11th (Figure 9). South Harrison topped the list at 2.89”, followed by Stafford Township 2.22”, Mantua Township (Gloucester) 2.18”, Glassboro (Gloucester) 2.10”, Seaside Heights 2.01”, Gloucester City (Camden) 1.96”, and Ocean Township (Monmouth) 2.01”. 40 CoCoRaHS stations saw 1.00”–2.22” and 43 from 0.50”–0.99”. North Jersey and much of the far south received less than 0.50”.
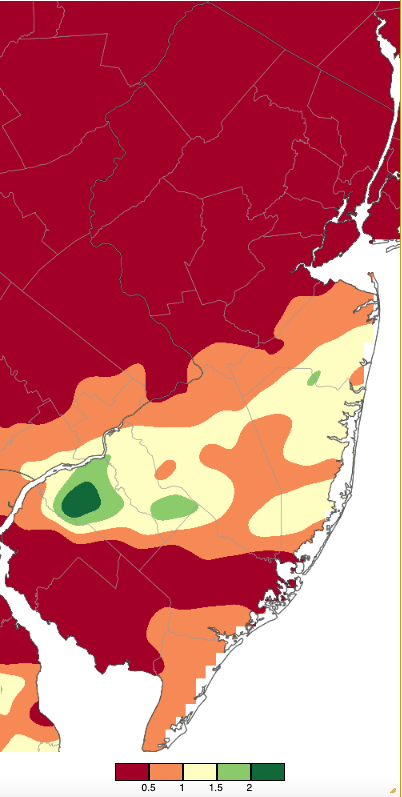
Figure 9. Precipitation across New Jersey from 7AM on August 10th through 7AM August 12th based on a PRISM (Oregon State University) analysis generated using generated using NWS Cooperative and CoCoRaHS observations. Note the scale in inches beneath the map.
Early-morning showers on the 17th delivered 0.60” to Bernards (Somerset), 0.56” at Piscataway (Middlesex), and 0.54” to Hillsborough (Somerset). Scattered afternoon thunderstorms on the 20th brought down some trees in a small area that accumulated rainfall up to 2.12” in Bloomingdale (Passaic), Kinnelon (Morris) 1.70”, Pompton Lakes (Passaic) 1.11”, and Pequannock (Passaic) 1.08”. The 22nd brought several episodes of heavy rain to two areas. Early in the morning, the northern end of Long Beach Island and the adjacent mainland area in Ocean County caught 4.43” at Barnegat Township and 3.91” in Stafford Township. Daytime and evening storms brought Bedminster (Somerset) 5.39”, Chester (Morris) 5.20”, Franklin Township (Warren) 4.71”, Bridgewater Township (Somerset) 4.12”, and Holland Township (Hunterdon) 3.93”. Of the 273 daily CoCoRaHS reports, 19 were from 2.00”–2.99”, 73 from 1.00”–1.99”, and 58 from 0.50”–0.99” (Figure 10). However, there were areas that received under 0.50”, especially in the south and far north.
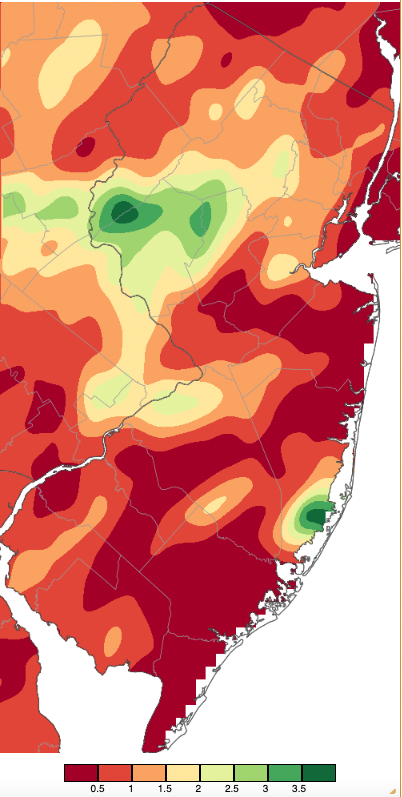
Figure 10. Precipitation across New Jersey from 7AM on August 21st through 7AM August 23rd based on a PRISM (Oregon State University) analysis generated using NWS Cooperative and CoCoRaHS observations. Note the scale in inches beneath the map.
Several afternoon showers on the 23rd brought as much as 0.60” to Ringwood (Passaic). It was the south catching some local showers during the afternoon and evening of the 26th, including two Millville (Cumberland) stations with 0.65” and 0.37” and Fairfield Township (Cumberland) 0.58”. Again, the south saw showers during the afternoon and evening of the 27th. This time, Vineland (Cumberland) received 1.36” and 1.09” (two stations), Deerfield Township (Cumberland) 1.28”, and Hammonton next most with 0.46”, demonstrating the very local nature of the heavy rain. A bit more widespread rain fell in the mid-day and afternoon hours of the 28th, again only in the south. Cedar Bridge (Burlington) saw 2.24”, Hamilton (Atlantic) 2.26”, Mount Ephraim (Camden) 1.03” and 0.78” (two stations), Port Republic (Atlantic) 0.85”, Winslow Township (Camden) 0.80”, and Haddon Heights (Camden) 0.74”. A line of thunderstorms moved west to east across the state on the evening of the 30th. Rainfall totals were not all that impressive, reaching 1.12” at Riverton (Burlington), Moorestown 1.02”, West Windsor (Mercer) 1.01”, North Brunswick (Middlesex) 0.90”, and Franklin Township (Somerset) 0.89”. Only 37 CoCoRaHS stations saw more than 0.50”.
The highest barometric pressures of the month were in the 30.20”–30.30” range on the 6th. Lowest pressures were 29.70”–29.80” on the 30th.
Summer 2022 OverviewYet another warmer-than-normal summer entered the books. The average temperature of 75.1° was 2.0° above the 1991–2020 normal and ranked 3rd warmest (Table 2). Only 2010 and 2020 were warmer. The nine warmest summers of the past 128 years have occurred since 2005. Only two of the 15 warmest occurred before 1999. The summer began with a June that was 0.3° cooler than most recent 30-year normal but ranked 41st mildest along with two other years. The heat was on in July with the average temperature 2.4° above normal and ranking 7th warmest. The warmest August on record helped boost the summer to its number 3 ranking.
| Rank | Year | Summer Avg. Temp. |
| 1 | 2010 | 75.7° |
| 2 | 2020 | 75.3° |
| 3 | 2022 | 75.1° |
| 4 | 2016 | 74.9° |
| 5 | 2005 | 74.8° |
| 6 | 2011 | 74.6° |
| 7 | 2021 | 74.5° |
| 8 | 2019 | 74.4° |
| 8 | 2018 | 74.4° |
| 10 | 1999 | 74.3° |
| 11 | 2012 | 74.2° |
| 12 | 2002 | 74.0° |
| 13 | 1949 | 73.9° |
| 14 | 2006 | 73.7° |
| 15 | 1988 | 73.6° |
Table 2. The 15 warmest summers (June–August) across New Jersey since 1895.
Summer precipitation averaged 8.05”. This was 5.53” below normal, ranking as the 6th driest on record (Table 3). It was the driest summer since the record-dry 5.61” in 1966. What a far cry from last summer with its 17.58” and 13th wettest ranking. All months were below average, with June coming in at 3.29” (-1.01”, 52nd driest), July with 2.15” (-2.56”, 13th driest), and August 2.61” (-1.96”, 22nd driest). Virtually the entire state had summer totals below the statewide normal. Mantua Township (Gloucester) was the exception among CoCoRaHS or NJWxNet stations with 14.89”. Other foot-plus totals included Washington Township (Gloucester) 13.41”, Tenafly (Bergen) 12.96”, Newton (Sussex) 12.89”, Stafford Township (Ocean) 12.86”, and Mount Olive (Morris) 12.15”. The spotty distribution of these wetter areas is seen in Figure 11. The driest areas are also evident on the map, including Hamilton (Atlantic) at 4.90”, Ocean City (Cape May) 5.03”, Deerfield Township (Cumberland) 5.11”, Sea Isle City (Cape May), Buena Vista (Atlantic) and Green Brook Township (Somerset) each 5.12”, and Maurice River Township (Cumberland) 5.32”.
As the summer ended, the U.S. Drought Monitor map showed almost the entire state as being either “abnormally dry” (D0), in “moderate drought” (D1), or in “severe drought” (D2; Figure 12). I do not particularly like the naming of the D1 and D2 categories, preferring “minor drought” for D1 and “moderate drought” for D2, but I have been unable to convince colleagues at the National Drought Mitigation Center, who coordinate the production of these valuable weekly maps, to change the naming convention. Whatever the term used, as summer ended, soil moisture, streamflow and ground water levels across the Garden State were quite low, fire danger high, agricultural, and horticultural impacts notable, and surface reservoir levels declining at a faster pace than normal (levels normally bottom out in October).
| Rank | Year | Summer Avg. Precip. |
| 1 | 1966 | 5.61” |
| 2 | 1957 | 6.01” |
| 3 | 1929 | 7.56” |
| 4 | 1949 | 7.86” |
| 5 | 1964 | 7.90” |
| 6 | 2022 | 8.05” |
| 7 | 1995 | 8.16” |
| 8 | 1963 | 8.27” |
| 9 | 1999 | 8.33” |
| 10 | 1965 | 8.42” |
| 11 | 1944 | 8.46” |
| 12 | 1913 | 8.72” |
| 13 | 1923 | 8.77” |
| 14 | 2010 | 8.82” |
| 15 | 1983 | 8.92” |
Table 3. The 15 driest summers (June–August) across New Jersey since 1895.
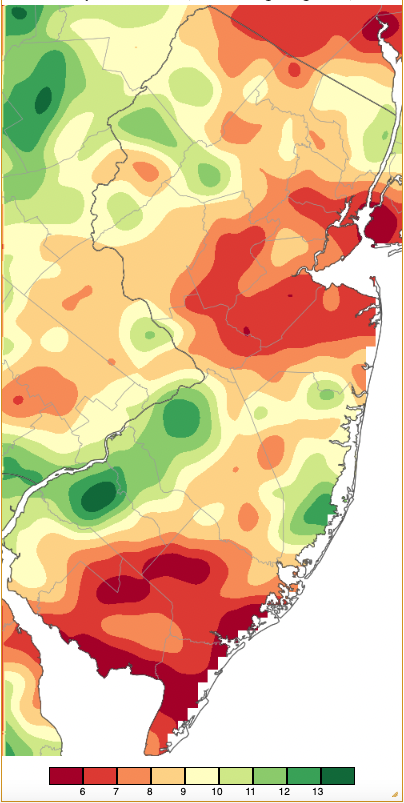
Figure 11. Summer precipitation across New Jersey from 7AM on May 31st through 7AM August 31st based on a PRISM (Oregon State University) analysis generated using generated using NWS Cooperative and CoCoRaHS observations. Note the scale in inches beneath the map.
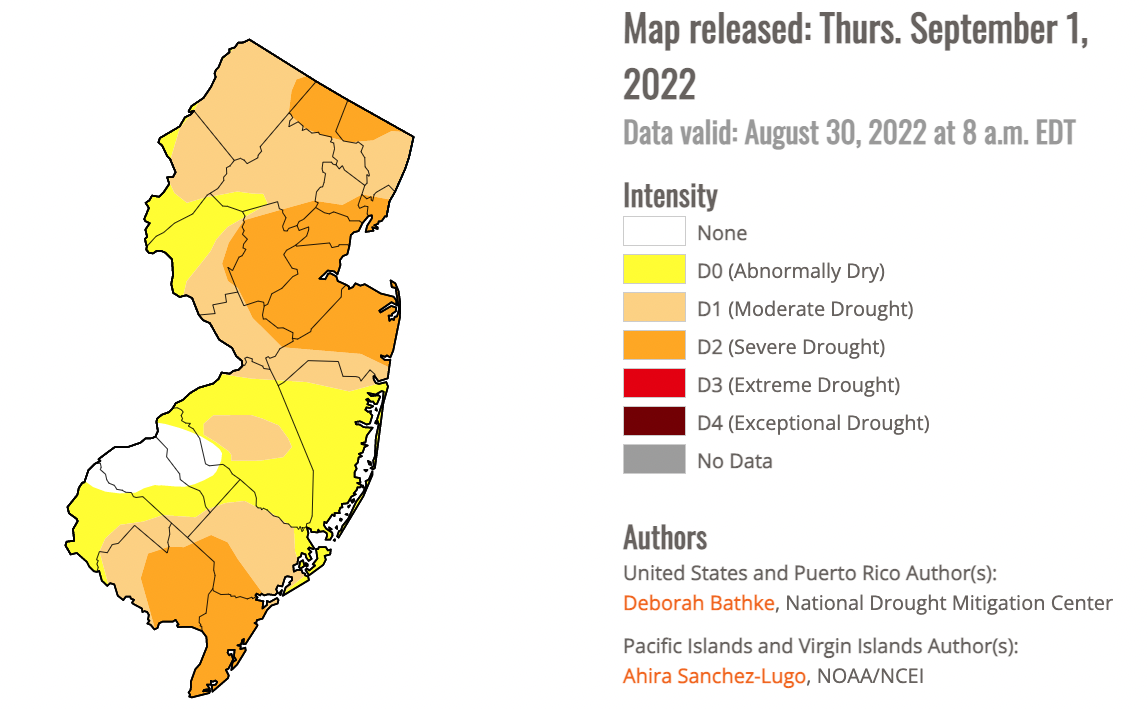
Figure 12. New Jersey portion of the U.S. Drought Monitor map for the last week of August.
For those seeking more detailed information on 5-minute, hourly, daily, and monthly conditions, please visit the following Office of the NJ State Climatologist's websites:
Rutgers NJ Weather Network
NJ Community Collaborative Rain, Hail and Snow Network
NJ Snow Event Reports
Interested in receiving our monthly summaries at the end of each month? Send us your e-mail address here to join the mailing list.
Past News Stories

