Transition Complete: May and Spring 2022 Recaps
New Jersey State Climatologist
Center for Environmental Prediction, School of Environmental and Biological Sciences/NJAES
Rutgers University
June 7, 2022
May Overview
Many across NJ wondered if the incessant back and forth of weather conditions from early spring into May would ever cease and the more consistent warmth of late spring would arrive and persist. It took time this year, with a cool, damp start to May that included a nine-day interval of almost continuous onshore easterly flow. Come mid-month the seasonal transition was finally complete, and daytime highs mostly remained above 70° away from the coast and higher elevations. This included two episodes where temperatures exceeded 90°. Whether it was cool or warm, rainfall was rather plentiful through most of the month. Seven events produced an inch or more at multiple locations, two of which found some spots exceeding 3.00”.
The statewide average temperature was 63.3°. This is 2.1° over the 1991–2020 normal and ties as the 14th mildest May since 1895. The average maximum of 73.6° was 1.3° above normal and ranked 35th mildest while the average minimum of 53.0° was 2.8° above normal, ranking 7th mildest. Regionally, the north division came in at 62.0° (+2.1°, 15th mildest), the south 64.3° (+2.1°, tied with two others at 13th), and coast 62.4° (+1.4°, tied with one other at 20th).
Rainfall averaged 5.37” across NJ (Figure 1). This is 1.62” above normal and ranks as the 23rd wettest May of the past 128 years. Even with the Highlands being somewhat dry, the north was wettest at 5.98” (+1.96”, 18th wettest). The south averaged 5.03” (+1.43”, 25th), despite the far south being on the dry side. The coast came in with 4.77” (+1.26”, 26th). The U.S. Drought Monitor continued classifying the far south as abnormally dry (D0), due to 30–90-day rainfall totals and groundwater levels remaining below normal.
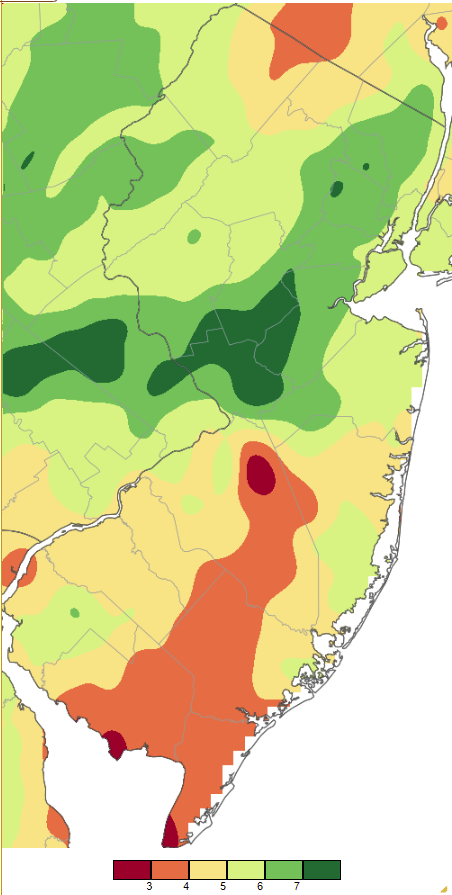
Figure 1. May 2022 precipitation across New Jersey based on a PRISM (Oregon State University) analysis generated using NWS Cooperative and CoCoRaHS observations from 7AM on April 30th to 7AM on May 31st. Note the scale in full inches at the bottom of the map. Totals range from 2.00–3.00” (dark red) to 7.00”–8.00” (dark green).
With the May 18th addition of a new Rutgers NJ Weather Network station in Little Falls (Passaic County) on the campus of Montclair State University, the network is up to 67 stations.
Precipitation and Storms
Some central and northeastern areas caught more than 8.00” of rain in May, including South Brunswick (Middlesex) with 8.41”, two Franklin Township (Somerset) locations at 8.22” and 8.05”, and Chatham (Morris) at 8.14”. In Mercer County, Hopewell received 7.87”, Laurence Township 7.80”, and Princeton 7.79”. The two driest CoCoRaHS stations in the state were in Lower Township (Cape May) at 2.80” and 2.91”. Also in Cape May County, Wildwood Crest saw 3.01” and both Ocean City and Middle Township 3.31”. Franklin (Sussex) and Estell Manor (Atlantic) each received 3.38”.
The first precipitation event of the month began late on the 1st and included early-morning thunderstorms in central areas on the 2nd. Hamilton (Mercer) received the most with stations coming in at 1.51” and 1.43”. Three Ewing (Mercer) sites caught 1.48”, 1.47”, and 1.41”, while Lawrence had 1.47”. Only the Interstate 195 corridor saw more than 0.50”.
Onshore flow began on the 3rd and did not back off until the 11th. This resulted from a stalled weather pattern across North America into the western Atlantic that included an area of low pressure situated near or off the East Coast. Fortunately, the Jersey coast was positioned with respect to the storm such that coastal flooding was mostly minor, never exceeding the low end of the moderate range. However, the storm was close enough to bring heavy rain to central and particularly central coastal areas from dawn on the 6th into the first half of the 8th (Figure 2). In Ocean County, Stafford Township received the most at 3.82”, followed by Toms River 3.16”, Lacey Township 3.02”, Berkeley Township 3.01”, and Pine Beach 3.00”. Of 267 CoCoRaHS reports, 165 were from 2.00”–2.99”, and 96 from 1.00”–1.99”. Hamilton (Atlantic) saw the least with 0.89”. Wind gusts exceeded 40 mph each day from the 6th–11th. Atlantic City Marina (ACM; Atlantic) gusted to 41 mph and Harvey Cedars (Ocean) to 40 mph on the 6th. ACM reached 63 mph on the 7th, followed by Little Egg Harbor Township (Ocean) 57 mph, Harvey Cedars 55 mph, Mullica (Atlantic) and Fortescue (Cumberland) each 52 mph, Lower Alloways Creek Township (Salem) 50 mph, and 17 other NJ WxNet locations from 40–49 mph. ACM made it to 57 mph on the 8th with Little Egg Harbor Township 54 mph and 5 sites from 40–48 mph. ACM was up to 43 mph on the 9th with three stations from 40–41 mph. Little Egg Harbor Township reached 53 mph on the 10th with five stations from 40–46 mph. ACM hit 40 mph on the 11th.
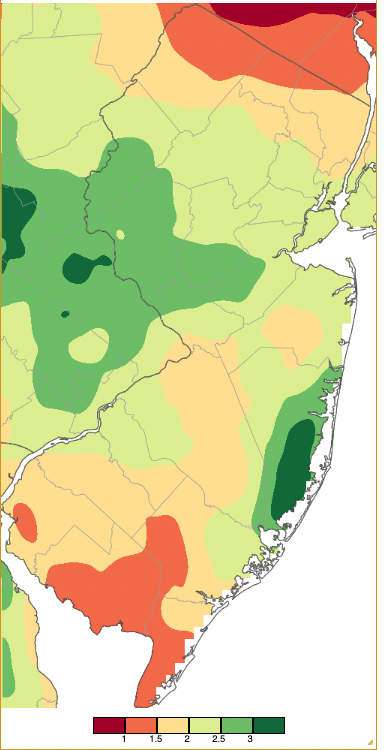
Figure 2. Precipitation across New Jersey from 7AM on May 5th through 7AM May 9th. based on a PRISM (Oregon State University) analysis generated using generated using NWS Cooperative and CoCoRaHS observations. Note the scale in inches beneath the map.
Scattered showers on the 14th persisted into early on the 15th. Galloway Township (Atlantic) saw 1.97”, Brigantine (Atlantic) 1.95”, Frelinghuysen Township (Warren) 1.88”, Absecon City (Atlantic) 1.86”, and Blairstown (Warren) 1.53”. Fourteen stations were over an inch and 107 of 242 reports came in from 0.50”–0.99”. Next up, afternoon and evening thunderstorms on the 17th were not as strong as forecast but still packed enough of a punch to leave Wantage (Sussex) with 0.67”, Montague (Sussex) 0.62”, and hail up to 0.5” diameter in Mercer County. Storm winds gusted to 46 mph at High Point Monument (Sussex) and 40 mph in Pennsauken (Camden).
Rain moved in from the west late on the 18th, becoming moderate to heavy early on the 19th lasting well into the morning. Five Franklin Township (Somerset) locations received 1.45”, 1.37”, 1.32”, 1.24”, and 1.22”. Kingwood (Hunterdon) saw 1.42” and New Brunswick (Middlesex) 1.33”. Thirty-nine of 251 station reports exceeded an inch, while 177 had 0.50”–0.99”.
Localized strong thunderstorms during the afternoon and early evening of the 20th brought a weak tornado, the season’s first, to Monmouth County, hail as large as tennis balls in central Camden and Burlington counties, and scattered tree damage in northern and central areas.
The hail was as large as 2.5” in diameter in Shamong (Burlington). Reports of hail having a diameter of 1.5” fell in Cherry Hill (Camden) and Medford Lakes (Burlington). Other hail reports from 0.88”–1.25” came in from Ashland (Camden), Marlton (Burlington), Voorhees (Camden), and Cherry Hill.
The twister was rated EF0. It touched down near the border of Strathmore and Hazlet townships (Monmouth) just after 5PM. It moved east into Hazlet, across the Garden State Parkway, and lifted several minutes later near Route 35 (Monmouth). No injuries were reported and just downed trees and cosmetic structural damage to buildings occurred. Rain totaled as much as 1.17” in Eatontown (Monmouth), Long Branch (Monmouth) 1.13”, South Brunswick 1.05”, and Frenchtown (Hunterdon) 1.01”.
Southern daytime thunderstorms on the 22nd deposited 1.25” in Upper Deerfield (Cumberland), 0.80” at North Wildwood (Cape May), 0.74” at Woodstown (Salem), and 0.72” in Franklin Township (Gloucester). A 43-mph gust occurred in Lower Alloways Creek Township.
The final event of the month deposited a swath of heavier rain from the southwest to northeast, mainly up the Turnpike corridor, during the afternoon of the 27th and then repeating in the north from late on the 27th into early on the 28th (Figure 3). Chatham took top honors with 3.33”, Wayne (Passaic) 3.19”, two Glen Rock (Bergen) sites at 3.13” and 3.09”, and Hawthorne (Passaic) 3.02”. Of 241 CoCoRaHS reports, 25 were from 2.00”–2.99” and 82 from 1.00”–1.99”. Winds gusted to 51 mph in Columbus (Burlington), 46 mph in Upper Deerfield, and 44 mph at Mannington (Salem). Tree damage was reported in Camden, Gloucester, Burlington, Monmouth, and Essex counties.
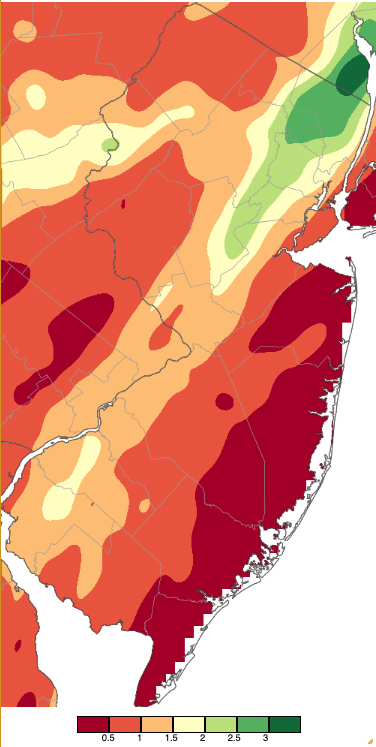
Figure 3. Precipitation across New Jersey from 7AM on May 27th through 7AM May 29th based on a PRISM (Oregon State University) analysis generated using generated using NWS Cooperative and CoCoRaHS observations. Note the scale in inches beneath the map.
The lowest barometric pressure of May was on the 16th, ranging from 29.50”–29.60” around NJ. The highest readings were from 30.35”–30.45” on the 25th. Wind gusts exceeding 40 mph not reported above included 44 mph at Sea Girt (Monmouth) and 40–41 mph at four other locations on the 16th and 43 mph at High Point Monument on the 23rd.
Temperature
Normally, these monthly temperature reports start off discussing maximum temperatures. However, this month, given that May 1st was the coldest day of the month and May 31st the warmest, it seems appropriate to reverse the order. The 1st found Walpack (Sussex) down to 26°, Berkeley Township 27°, and 11 other NJWxNet stations from 28°–32° (Figure 4). Atlantic City Marina was mildest at 47°. As is often the case on clear cdalm nights, interior low-lying areas were coldest, while higher elevations, urban locations, and coastal areas were milder. Diurnal ranges were quite large in many spots on the 1st, including a 47° range at Walpack (26°–73°), while still-cool coastal waters kept the range as small as 9° at Harvey Cedars on Long Beach Island (46°–57°). Another 16 days saw lows at some locations down to at least 45°.
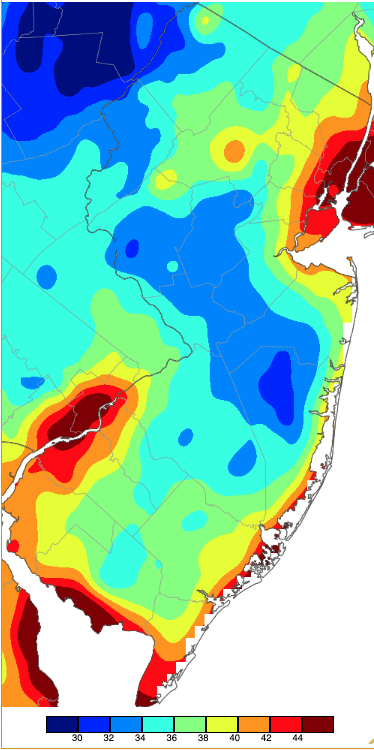
Figure 4. Minimum temperatures on May 1st based on a PRISM (Oregon State University) analysis generated using NWS, NJWxNet, and other professional weather stations. Note the in 2-degree increment scale beneath the map.
From the 2nd to 6th, lows bottomed out from 43°–45° at locations including High Point Monument, Berkeley Township, Howell (Monmouth), Vernon Township (Sussex), Walpack, and Harvey Cedars. Colder conditions returned on the 7th with Vernon Township down to 38°, the same low Stewartsville (Warren) reached on the 8th. Walpack fell to 30°, Sandyston (Sussex) 31°, and four locations from 34°–39° on the 9th. Walpack reached 31° on the 10th and 32° on the 11th when three other locations fell to 34°–39°. Walpack was 41° on the 12th to end the opening 12-day run of May days under 45°.
The 17th brought 44° minimums to Sandyston and Walpack. The latter site hit 38° on the 18th when eleven stations were 40°–45°. A week later, Pequest fell to 43° while Berkeley Township and Howell reached 44° on the 26th. Sandyston made it to 45° on the 29th.
Maximum temperatures reached 80° or higher on thirteen May days. It took until the 12th for that mark to be achieved when Sandyston reached 80°. Twenty one stations reached 80°–81° on the 15th and from there on out, 12 of the 17 remaining days of the month had 80° highs. Berkeley and Red Lion (Burlington) reached 83° on the 16th, with Sicklerville (Camden) also 83° on the 17th. Greenwich (Cumberland) was 80° on the 19th. Piney Hollow (Gloucester), Sicklerville, and West Deptford (Gloucester) hit 88° on the 20th when the best Harvey Cedars could muster was a 65° high.
The first 90° day of the year arrived on the 21st, with Sicklerville up to 97°, eleven stations from 95°–96°, and 38 sites from 90°–94°. Every NJWxNet station reached 80°, with that mark found at Atlantic City Marina. Daily records were achieved at Charlotteburg (Passaic; 91°) and Millville (Cumberland; 93°) and tied at the Atlantic City Airport in Pomona (Atlantic; 93°), where a daily record maximum minimum was reached at 68°. It remained hot on the 22nd, with Berkeley Township, Cedar Bridge (Ocean), Howell, and Toms River (Ocean) up to 93°, and 32 NJWxNet stations from 90°–92°.
The next 80° day occurred on the 27th, with the new Little Falls station up to 82°. Four stations reached 81° on the 28th, with Hamilton (Mercer), Lower Alloways Creek Township, and Sicklerville at 83° on the 29th. 90° heat returned to finish the month, beginning with 91° at Sicklerville and 90° in East Brunswick (Middlesex) on the 30th. The 31st beat out the 21st as the month’s warmest day (Figure 5). Newark Airport in Elizabeth (Union) had a record high 98°, while within the NJWxNet, West Creek (Ocean) hit 97°, 16 locations were from 95°–96°, and 43 stations from 90°–94°. Coolest was 83° in Fortescue, immediately adjacent to the cooler waters of Delaware Bay and experiencing southerly winds blowing off the bay, while the highest-elevation station in the network at High Point Monument only reached 85°. The Figure 5 map shows the widespread distribution of 90°+ maximums across most of the state, with cooler temperatures at higher elevations in the north and along the northern shore of Delaware Bay near Fortescue and Cape May.
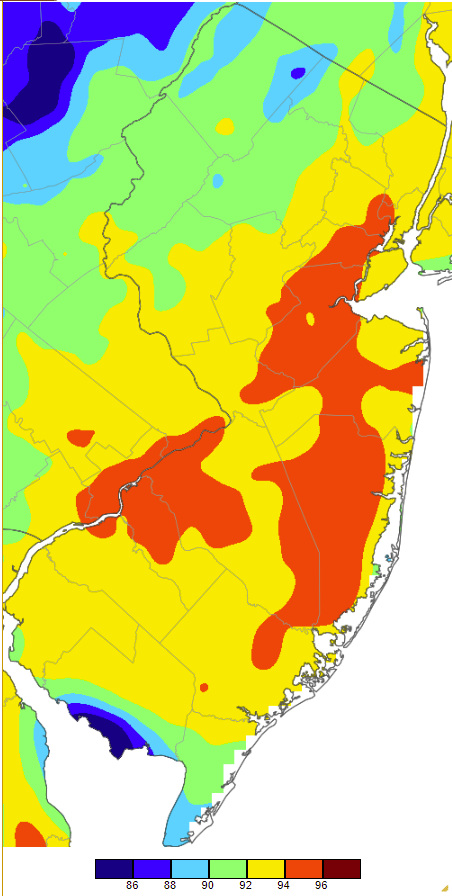
Figure 5. Maximum temperatures on May 31st based on a PRISM (Oregon State University) analysis generated using NWS, NJWxNet, and other professional weather stations. Note the 2-degree increment scale beneath the map.
As has often been covered in past monthly reports, New Jersey’s adjacent waters have an enormous impact on the thermal regime of our coastal communities. This is apparent throughout the year but no more so than in spring when waters warm much more slowly than land surfaces, the result being chilled maritime air and sometimes much hotter conditions on the mainland. With warm air rising and lower barometric pressure inland, it opens the door for the maritime air to sweep inland as a sea breeze event. If given a push from easterly winds that are part of a broader weather pattern, the cooler air can even make it to the Delaware Valley. On the flip side, if offshore winds are strong enough they may keep a sea breeze at bay, witness conditions this past May 22nd when most coastal areas got quite warm.
However, this May had several “classic” sea breeze situations. The first example is from May 11th when some inland areas started the day off in the 30°s yet warmed up into the 70°s during the afternoon (Figure 6). Meanwhile, coastal locations started the day in the low 50°s but never made it out of the 50°s during the afternoon. Walpack went from a morning low of 32° (coldest in NJ) to a maximum of 78° (tied for warmest), thus exhibiting an impressive 46° diurnal range. Seaside Heights (Ocean) had a low of 53° and high of 57° for a 4° diurnal range.
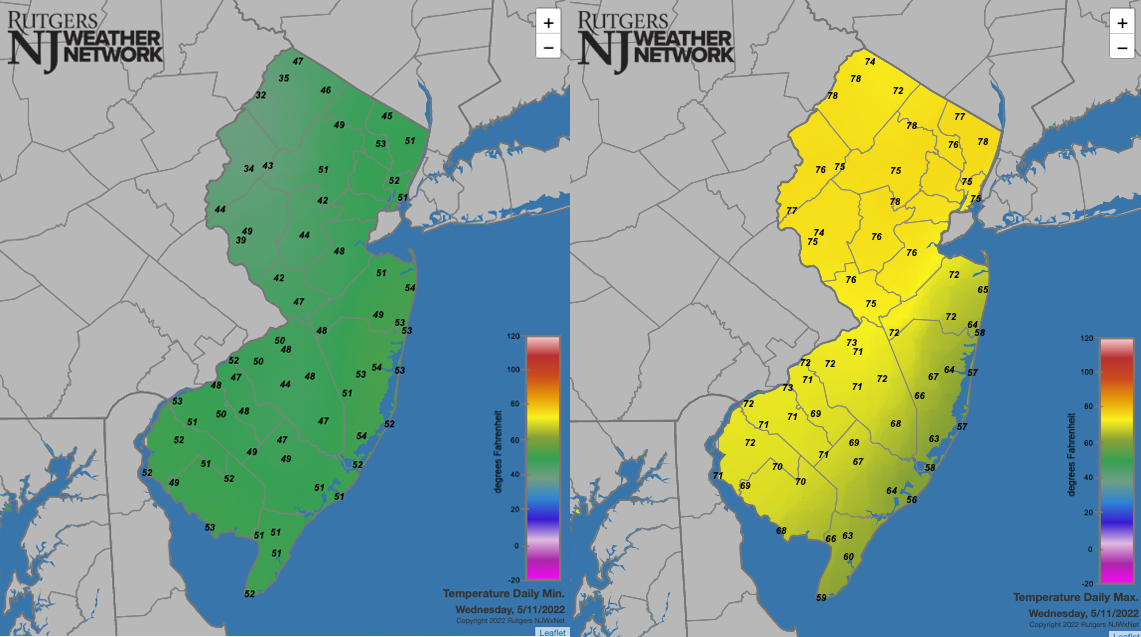
Figure 6. Daily minimum (left) and maximum (right) temperatures at Rutgers NJ Weather Network stations on May 11th.
The 21st was a scorcher inland with Sicklerville up to 97°. The consistent rise of temperature from a morning low of 64° to the late afternoon maximum is seen in Figure 7. Meanwhile, at Harvey Cedars on the coast, the day started warming up from the upper 50°s, but even before mid-morning was reached, signs of a sea breeze day began to emerge. As the daily time series in Figure 7 depicts, a “battle” raged throughout the morning with rapid upward and downward movements of the thermometer. Still, the temperature made it to 81° shortly before noon when the sea breeze became dominant. The temperature remained mainly in the mid and upper 60°s until relaxation of the breeze lead to brief warming into the mid 70s late in the afternoon.
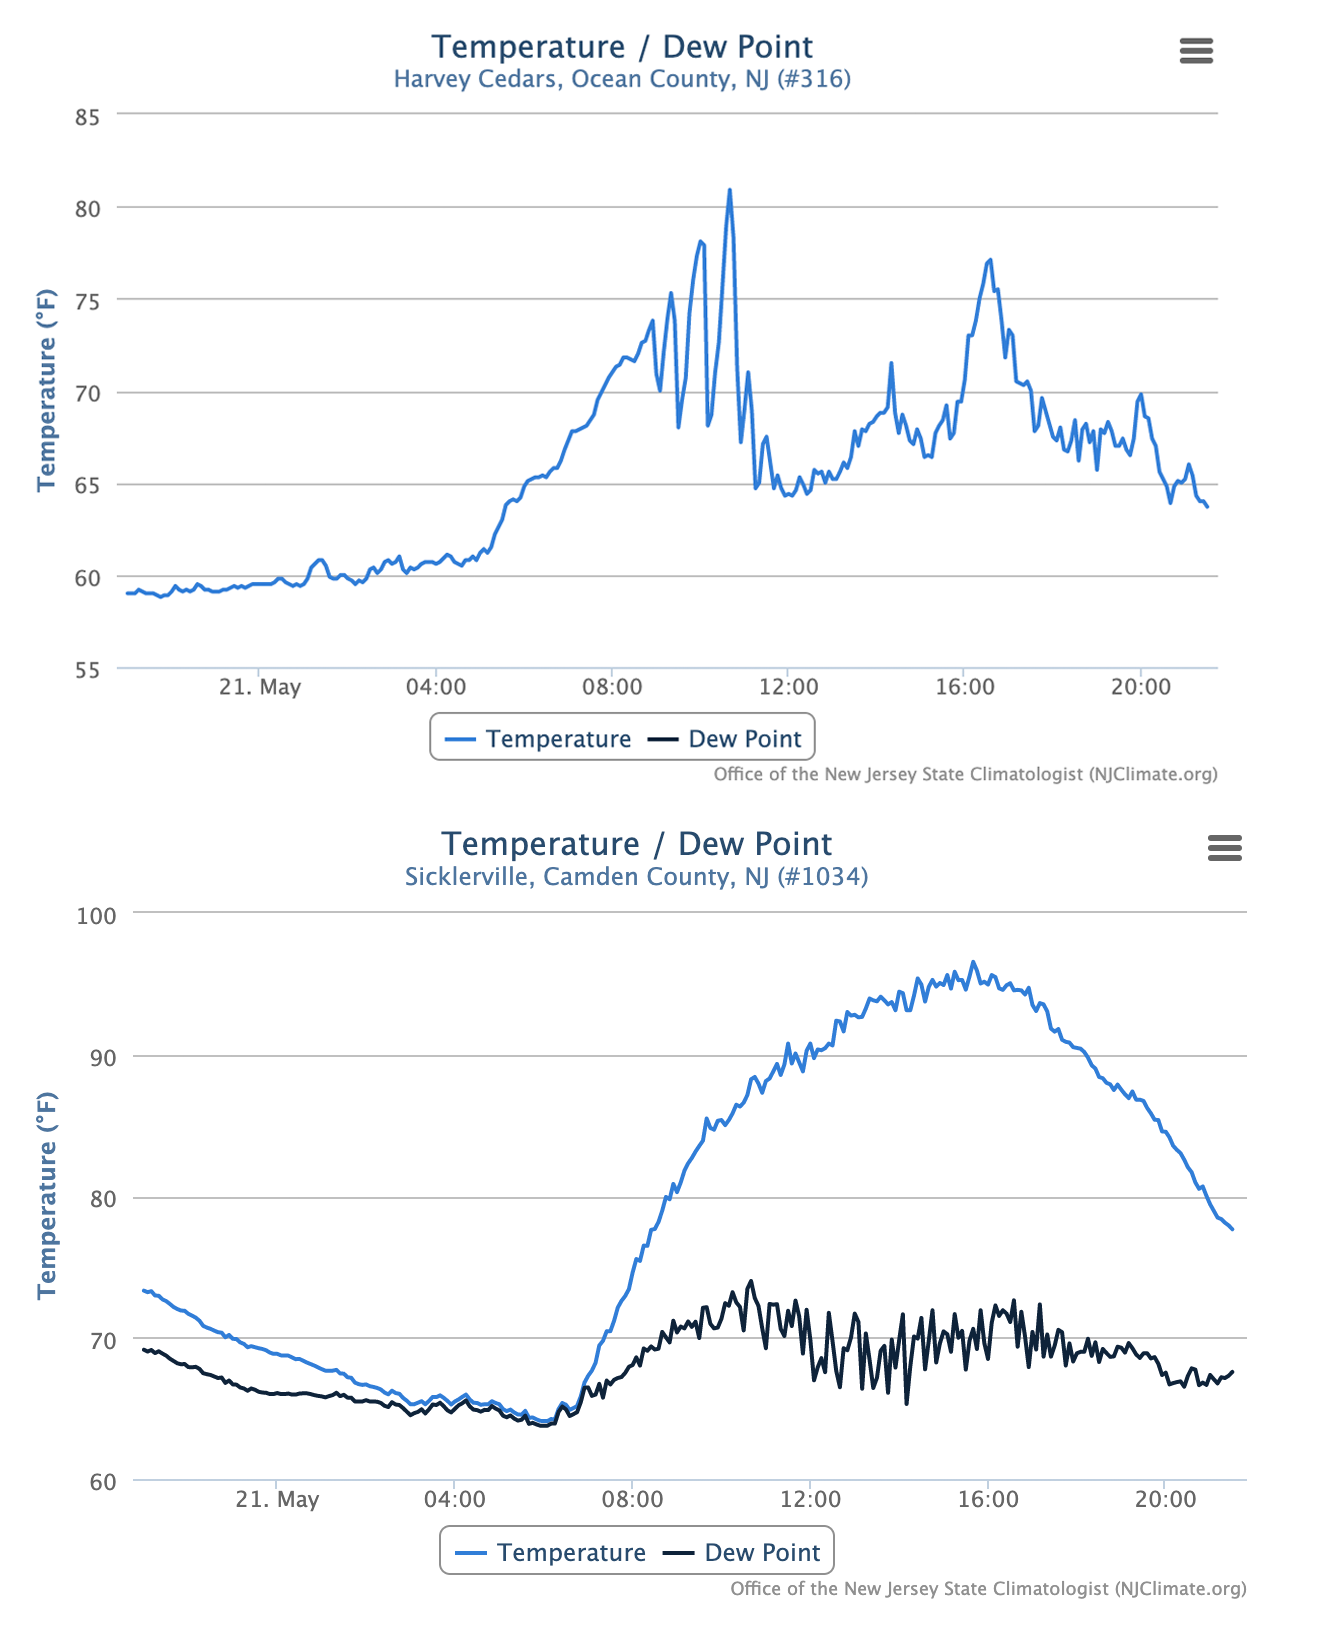
Figure 7. Time series of temperature and dew point temperature at Harvey Cedars (top) and Sicklerville (bottom) from 9 PM on May 20th to 9 PM on May 21st.
A final example of the power of the sea breeze was seen on May 31st, when the morning climb of temperature at Harvey Cedars to the mid 80°s was eliminated in minutes by a breeze that saw the thermometer remain in the 70°s, actually continuing to cool gradually into early evening. Then the sea breeze collapsed, and evening temperatures quickly rose to a daily high of 89° around 8:00 PM before slowly falling off.
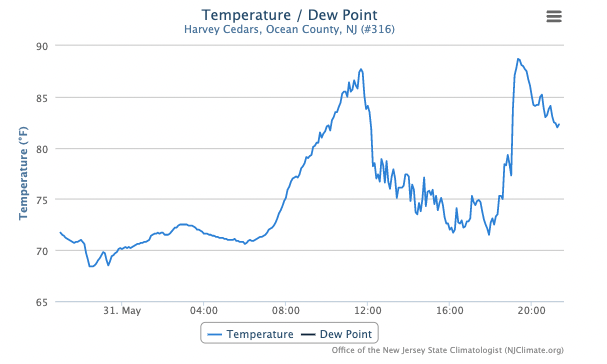
Figure 8. Time series of temperature and dew point temperature at Harvey Cedars from 9 PM on May 30th to 9 PM on May 31st.
Spring Overview
Precipitation in the March–May interval averaged 13.04” across New Jersey. This was 1.39” above normal and ranks as the 33rd wettest spring since 1895. March dryness was balanced out by a wetter-than-normal April, leaving it to a wet May to tip the balance to the positive side. The wettest spring locations were in the north, including White Township (Warren) with 18.22”, followed by Hopewell (Mercer) at 17.81”, Little Falls (Passaic) 17.60”, Hopewell Township (Mercer) 17.52”, and Oxford Township (Warren) 17.36” (Figure 9). The far south was driest, led by 8.60” and 8.62” at two Lower Township (Cape May) stations, Wildwood Crest (Cape May) at 8.62”, Ocean City (Cape May) 10.33”, Middle Township (Cape May) 10.47”, and Medford Township (Burlington) 10.64”.
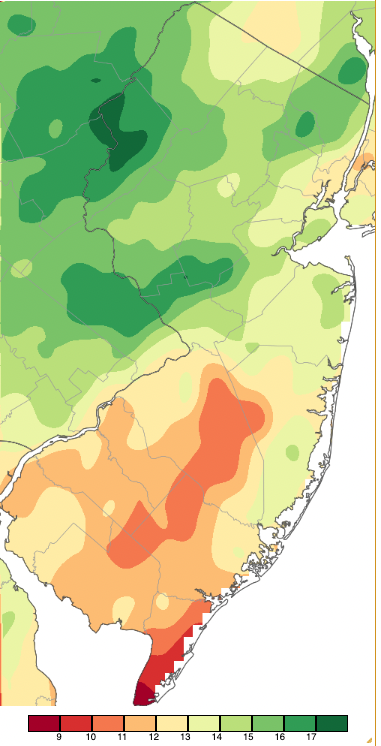
Figure 9. Spring 2022 precipitation across New Jersey based on a PRISM (Oregon State University) analysis generated using NWS Cooperative and CoCoRaHS observations from 7AM on February 28th to 7AM on May 31st. Note the scale in full inches at the bottom of the map. Totals range from 8.00–9.00” (dark red) to 17.00”–18.00” (dark green).
Snowfall was mainly found in March, with most locations seeing less snowfall than normal. Snowiest spring locations included Montague (Sussex) with 10.8”, Vernon Township (Sussex) 8.4”, Mount Olive (Morris) 8.3”, and both Hardyston (Sussex) and Sparta (Sussex) 8.0”.
Temperatures were well above normal in March, slightly below normal in April, and once again above normal in May. This resulted in a statewide spring mean of 52.7°. This is 1.5° above normal and ties with 1985 as the 10th mildest May on record (Table 1). Eight of the fifteen mildest springs have occurred since 2000.
| Rank | Year | Spring Avg. Temp. |
| 1 | 2012 | 55.8° |
| 2 | 2010 | 55.2° |
| 3 | 1921 | 54.2° |
| 4 | 1991 | 53.8° |
| 5 | 2004 | 53.6° |
| 6 | 1945 | 53.3° |
| 7 | 1977 | 53.2° |
| 8 | 1998 | 53.0° |
| 9 | 2011 | 52.9° |
| 10 | 2022 | 52.7° |
| 10 | 1985 | 52.7° |
| 12 | 2016 | 52.6° |
| 13 | 2021 | 52.5° |
| 13 | 2000 | 52.5° |
| 15 | 1903 | 52.4° |
Table 1. Top 15 warmest NJ springs (March–May) since 1895.
For those seeking more detailed information on 5-minute, hourly, daily, and monthly conditions, please visit the following Office of the NJ State Climatologist's websites:
Rutgers NJ Weather Network
NJ Community Collaborative Rain, Hail and Snow Network
NJ Snow Event Reports
Interested in receiving our monthly summaries at the end of each month? Send us your e-mail address here to join the mailing list.
Past News Stories

