Climate Map Data
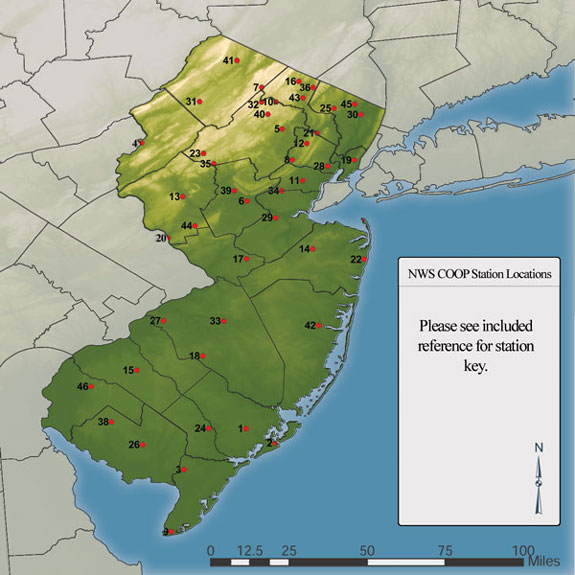
The National Weather Service maintains a network of 46 Cooperative Observing Stations (Coop) across New Jersey (see map below). These stations are well-distributed spatially and each has more than 30 years of data (30 years being the World Meteorological Organization (WMO) standard for calculating climatological means). Daily observations from these sites are available for the 1971-2000 interval (a WMO standard interval for climate normals). Trained volunteers use standard NWS-supplied instrumentation to measure precipitation, snowfall, and maximum and minimum temperatures on a daily basis at these Coop sites. All data are sent to the National Climatic Data Center in Asheville, North Carolina, where observations are digitized, quality controlled, archived, and made available to interested parties.
Temperature, precipitation (rain and melted snowfall), and snowfall data for the 30-year interval were extracted from a database assembled within the ONJSC. No more than five years of data could be missing from the 1971-2000 interval for a station to be used in constructing the maps.
The 46 maps shown here represent the most complete atlas of NJ climatology produced to date (see table below for a listing of all maps). Maps were generated using ArcGIS software. Point values were used to create interpolated, color-filled maps. Inverse Distance Weighted (IDW) interpolation was employed in the process. IDW interpolation explicitly implements the assumption that things that are close to one another are more alike than those that are farther apart. It weights the points closer to the prediction location greater than those farther away. The interpolation did not take into account local and regional variations in topography found particularly in the northern portion of the State. For instance, there is an absence of reports from the highest elevations in the State. Proximity to the Atlantic Ocean was only considered in so much as several stations sit rather close to the coast.
Maps depicting station standard deviations were calculated with respect to the multi-station statewide mean for a particular variable and map. This contributes to a more thorough evaluation of regional patterns of a particular variable within a month, more consistent interseasonal single variable comparisons, and in some regards, simpler comparisons between the distributions of different variables. For instance, with respect to precipitation, the inter-regional and month-to-month differences in measured precipitation are not substantial in most cases, thus demonstrating the utility of the standard deviation approach in enhancing differences.

Locations of Coop stations used in climatological evaluations. Numbers on the map correspond to stations listed in the table below.
National Weather Service Cooperative Observing stations employed in project climatological evaluations. Note that some stations only report precipitation (PCP:P), others report both P and temperature (TMP:T), and fewer report snowfall (SNO:S). Station numbers correspond to their location in the above map.

Maps generated for this project.

Case Study Data
Case study data was drawn from the New Jersey Weather and Climate Network (NJWxNet). The NJWxNet is a comprehensive information resource for weather forecasting and weather-related decision making in the Garden State. It is a unique network of networks, including data gathered from over 40 stations operated by the Office of the NJ State Climatologist (ONJSC), along with more than 60 stations maintained by the NJ Department of Transportation, the NJ Turnpike, the National Weather Service, the U.S. Geological Survey, Stevens Institute of Technology, and others (see map below). The combination of all of these stations makes the NJWxNet the most spatially dense weather network in the Nation, and likely the World.
The ONJSC processes the raw data from each network into a common format and populates a MYSQL database within minutes of observations being obtained. Data and derived products are quickly made available for display in colorful maps, graphs, and tables via the NJWxNet web site or other means (e.g., emailed reports). Maps display the latest observations of temperature, precipitation, wind speed and dew point. Tables display information in a variety of formats. This includes single hourly observations from all stations, daily summary data from all stations, daily hourly observations from a single station, and daily summary data by month for a single station.