

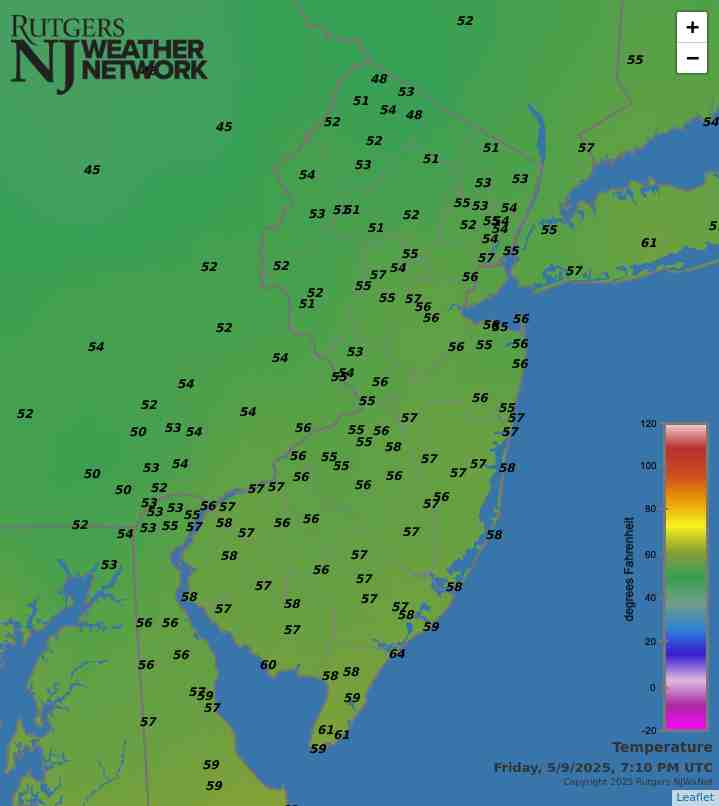
Latest temperatures across NJ appear in the above map. Click on the map or here, the Rutgers New Jersey Weather Network, for much more information.
Interested in becoming a volunteer weather observer? Click here to learn more about the CoCoRaHS Network!


NJ Precipitation and Temperature departures
over the past 12 months


May/Spring 2026 Recaps
June 8, 2026
Spring is often recognized as a period when winter attempts to hold on while summer comes knocking on the door. This past March and April displayed this “battle"...to the extreme. May also followed suit. The focus was mainly on thermal swings, resulting in many a decision on whether to go with cold or warm weather clothing. Meanwhile, the ongoing poor “production” of precipitation was disappointingly more persistent, except, unfortunately, over the Memorial Day weekend. First will be a recap of May conditions, followed by a spring overview.
Statewide, May precipitation averaged 2.88”. This is 0.87” below the 1991–2020 norm and ranks as the 42nd driest May of the past 132 years. The northern climate division averaged 3.07” (-0.95”, 38th driest), the southern division 2.80” (-0.80”, 46th driest), and the coastal division 2.41” (-1.10”, 37th driest). This was the 10th consecutive month with below-normal precipitation across NJ and the 22nd of the past 25 months. More on the long-term drought conditions in the spring section of this report.
May temperatures vacillated weekly, ultimately coming in at an average of 61.7°. This is 0.5° above normal and ranks as the 39th mildest May since 1895. The average maximum temperature of 72.4° is 0.1° above normal, ranking 54th mildest. The average minimum of 51.0° is 0.8° above normal, ranking 25th mildest. The north came in at 60.0° (+0.1°, 46th mildest), the south 62.8° (+0.6°, 36th mildest), and the coast 62.2° (+1.2°, 25th mildest).
More...
Past News Stories
