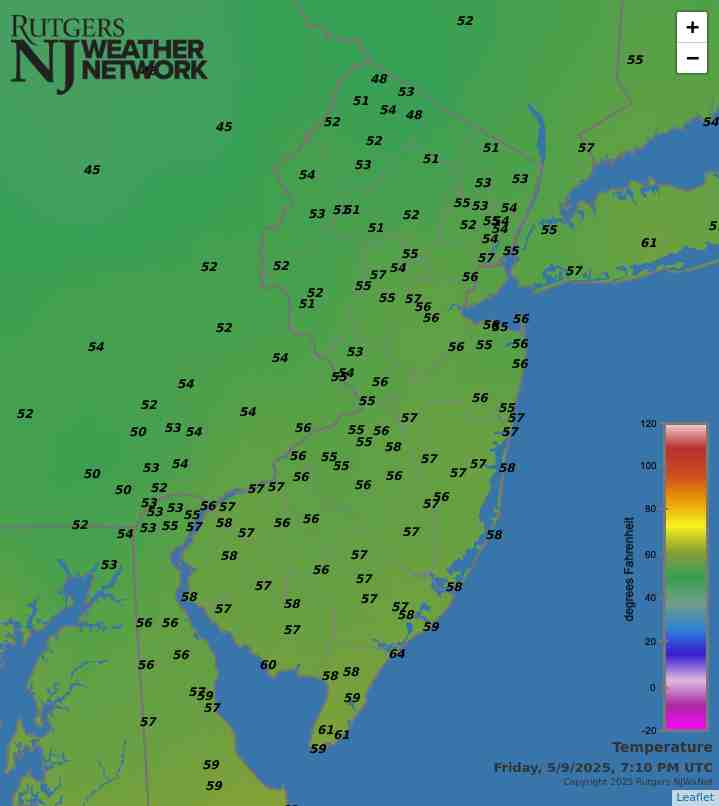
Latest temperatures across NJ appear in the above map. Click on the map or here, the Rutgers New Jersey Weather Network, for much more information.
Interested in becoming a volunteer weather observer? Click here to learn more about the CoCoRaHS Network!


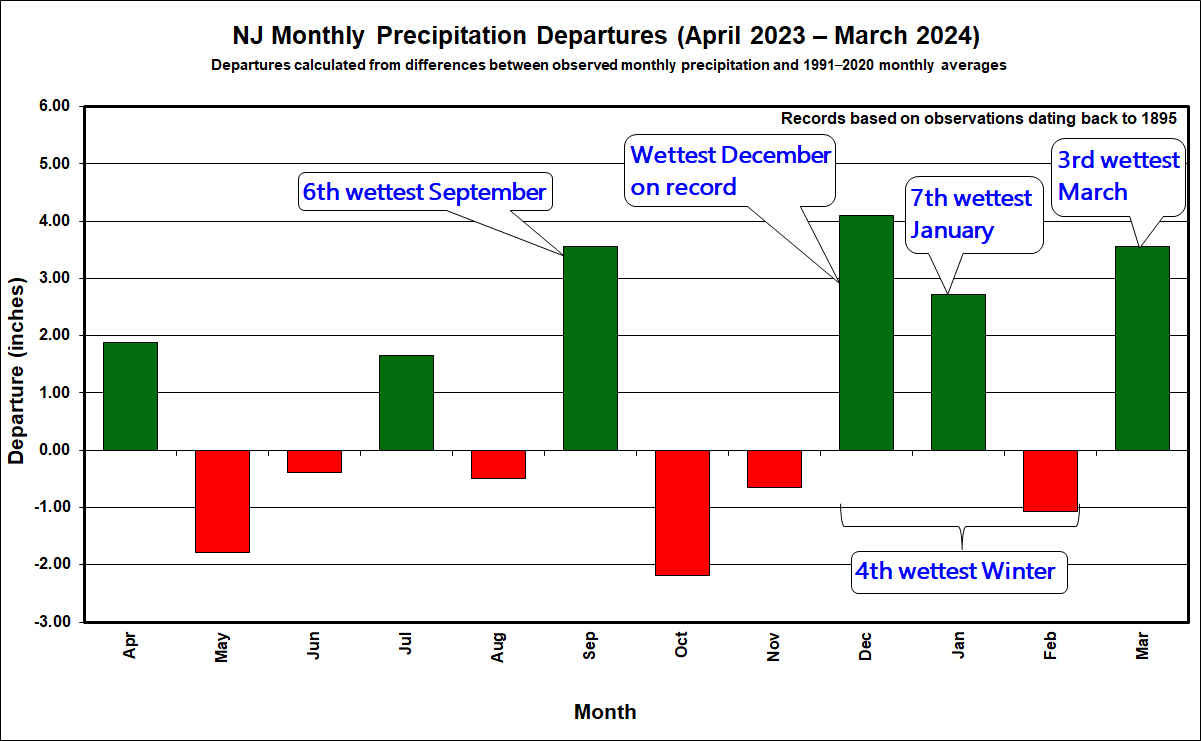
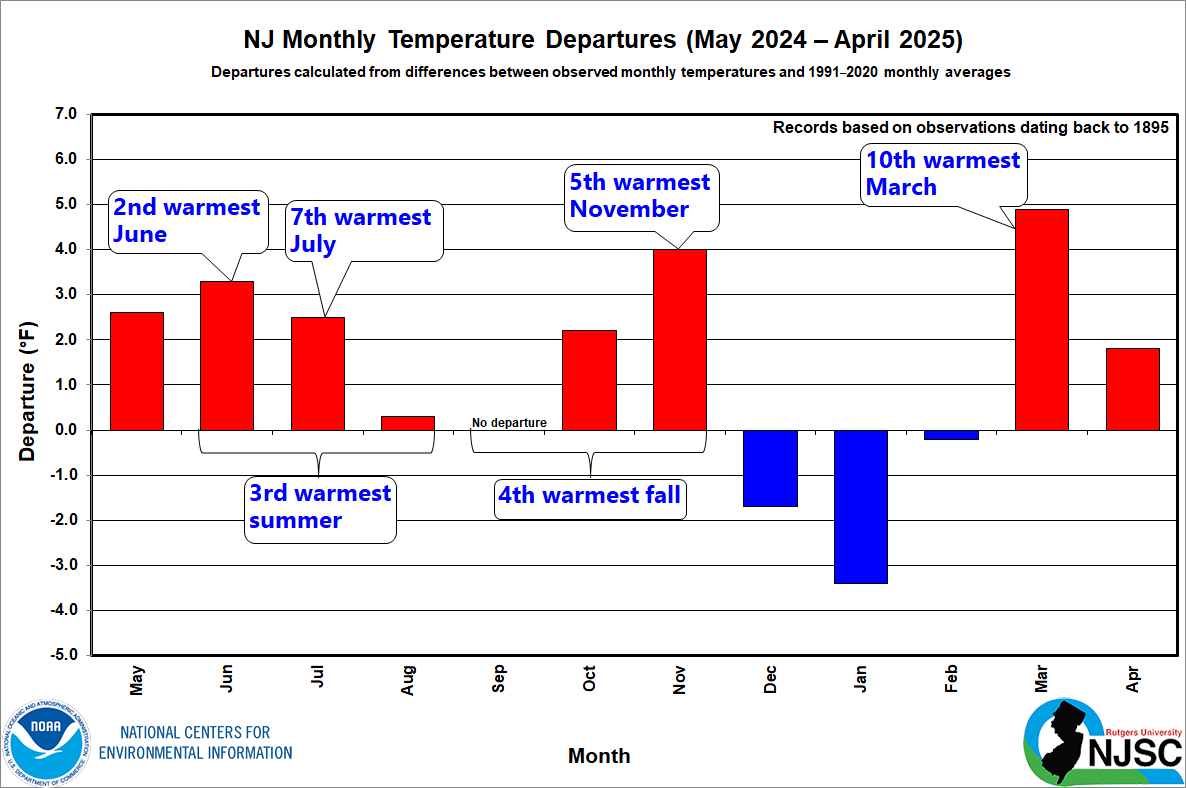
NJ Precipitation and Temperature departures
over the past 12 months

April 2026 Recap
May 8, 2026
April 2026 was a month ranking in the top ten for warmth, yet the major weather news of the month was a damaging late-month freeze. Weeks vacillated between warmth and cold, with the warm ones winning out. This thermal whiplash was accompanied by yet another below-normal month of precipitation, making this 21 of the past 24 months with below-normal totals across the Garden State. A Drought Warning issued by the NJ Department of Environmental Protection remains in place.
The 54.4° average April temperature is 2.9° above the 1991–2020 normal. This ties as the 6th mildest since records commenced in 1895. Seven of the ten mildest Aprils have occurred since 2002, with 2006 (12th) and 2025 (13th) not far behind. The average high of 66.4° is 3.7° above normal, ranking 6th mildest, and the average low of 42.4° is 2.1° above normal, ranking 7th mildest. The northern climate division averaged 52.9° (+3.0°, 6th mildest), the southern division 55.5° (+2.9, 6th mildest), and the coastal division 54.2° (+2.5°, 8th mildest).
April precipitation averaged 2.51” across NJ. This is 1.19” below normal and ranks as the 23rd driest. The northern division averaged 2.84” (-1.06”, 39th driest), southern 2.31” (-1.27”, 18th driest), and coastal 2.33” (-1.22”, 25th driest). Northwest areas were closest to normal, with west central and far southern reaches driest. Only trace amounts of snow and sleet were observed in several locations during the month.
More...
Past News Stories