

Waterlogged NJ: August 2011
and Summer 2011 Summary
New Jersey State Climatologist
Center for Environmental Prediction, School of Environmental and Biological Sciences/NJAES, Rutgers University
September 5, 2011
August Overview
August 2011 will go down in New Jersey's weather annals as one of the most remarkable months on record. For most residents, the most memorable event of the month was Tropical Storm Irene (upon further examination by the National Hurricane Center, Irene has been reclassified as a tropical storm prior to making land fall in New Jersey). Irene necessitated the largest coastal evacuation in state history, record flooding on a number of rivers, power outages for almost one million customers, and tragically the loss of life of at least a dozen NJ residents. Others will remember severe local flash flooding associated with several massive rainstorms earlier in the month. In fact, prior to a drop of rain from Irene, enough precipitation had fallen to rank this as the state's 6th wettest August since 1895. With the addition of Irene's rainfall, the previous record for any calendar month back to 1895 was shattered by almost 5".
Before discussing the month's storms, let's take a look at August's temperatures. The monthly average of 74.1° ties with 1918 and 2007 as the 28th warmest of the past 117 years. This is 0.7° above the 1981-2010 average. On four afternoons the high temperature equaled or exceeded 90° at one of the approximately 60 stations the Office of the New Jersey State Climatologist monitors across the state. The warmest day was the 1st when New Brunswick (Middlesex County) topped out at 97° and five other stations reached 95°. Four stations reached 92° on the 2nd. The 7th saw Hammonton (Atlantic) hit 93° and both Egg Harbor Township (Atlantic) and Hawthorne (Passaic) at 92°. Atlantic City Marina (Atlantic) got to 93° on the 8th, when six other stations reached 92°.
On six August mornings at least one NJ station fell into the 40°s. On the 12th it was 47° at Pequest (Warren) and Walpack (Sussex), and 48° in Basking Ridge (Somerset). The 23rd saw Pequest drop to 46°, Walpack to 48° and four other stations to 49°, making this the coolest morning of the month. Pequest was 49° on the 24th, 47° on the 29th, when Walpack dropped to 49°, and 48° on the 30th. The last day of the month saw Berkeley Township (Ocean) reach 49°.
The preliminary estimate of statewide August precipitation is 16.64". This staggering figure is 12.43" above the 1981-2010 average and is by a wide margin the wettest August on record. Or any calendar month for that matter, as it far surpasses the previous record of 11.98" in October 2005. Table 1 shows the ten wettest Augusts, with the 1955 record associated with hurricanes Connie and Diane now sitting at #2 for August and #3 for any month.
| Rank | Year | Aug. Prcp |
|---|---|---|
| 1 | 2011 | 16.64" |
| 2 | 1955 | 11.44" |
| 3 | 1933 | 10.71" |
| 4 | 1971 | 10.36" |
| 5 | 1967 | 9.11" |
| 6 | 1901 | 9.01" |
| 7 | 1911 | 8.52" |
| 8 | 1990 | 8.24" |
| 9 | 1927 | 8.17" |
| 10 | 1942 | 7.76" |
Table 1. The ten wettest Augusts across NJ since 1895.
An examination of observations from over 150 NJ CoCoRaHS stations shows that Freehold Township (Monmouth) received over two feet of rain in August (24.68", with one day missing when possibly a little light rain fell). Table 2 shows the Freehold report and the next nine highest totals, including stations in seven of NJ's 21 counties.
| Rank | Prcp | Town | County |
|---|---|---|---|
| 1 | 24.68"* | Freehold Twp | Monmouth |
| 2 | 23.29" | Upper Deerfield Twp | Cumberland |
| 3 | 22.32" | Franklin Twp | Gloucester |
| 4 | 20.39" | Cranbury Twp | Middlesex |
| 5 | 20.24" | Howell Twp | Monmouth |
| 6 | 20.04" | Holmdel Twp | Monmouth |
| 7 | 19.95" | West Milford Twp | Passaic |
| 8 | 19.90"* | Hammonton | Atlantic |
| 9 | 19.61"* | Morris Twp | Morris |
| 10 | 19.53" | Randolph Twp | Morris |
Table 2. The ten wettest CoCoRaHS locations in NJ during August 2011. Asterisk denotes incomplete reports, with one or more days missing where some minor amounts of precipitation may have fallen.
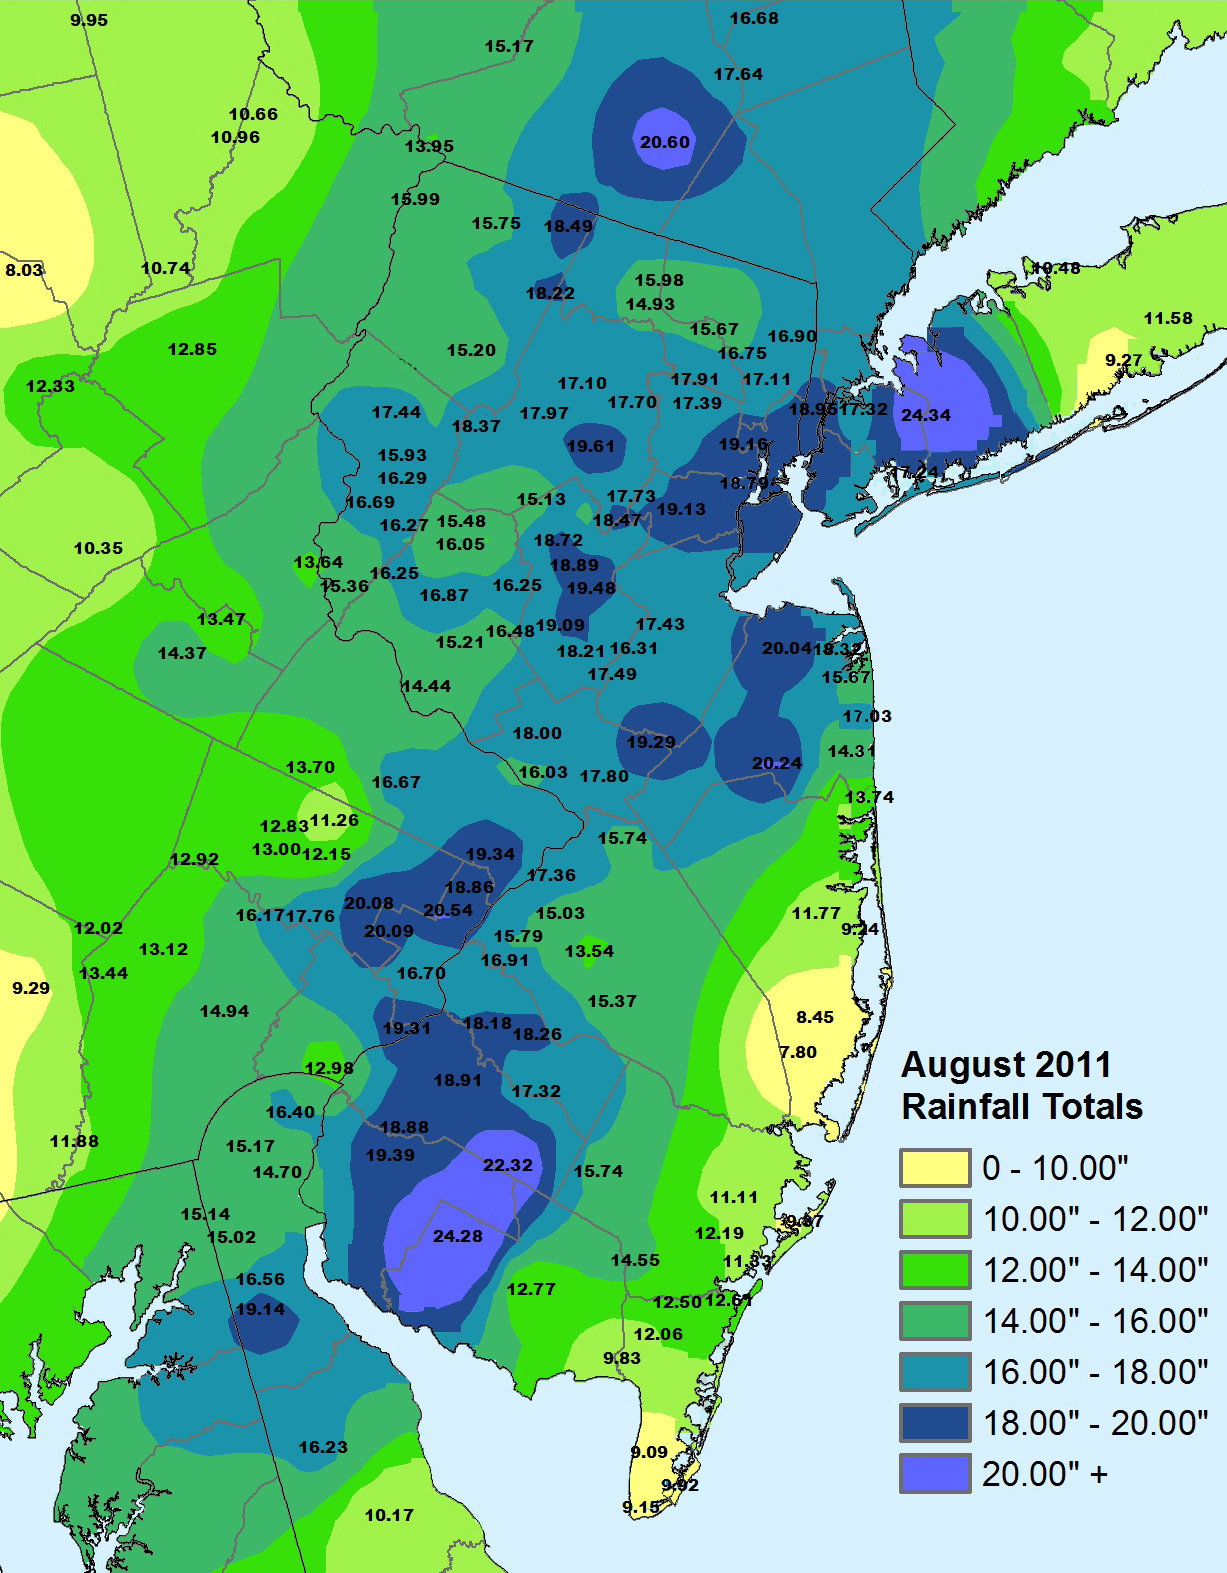
Table 3 breaks down the monthly precipitation totals by county, with the highest and lowest values presented. County maximums were at least 15.43" (Cape May) and the top stations in Cumberland, Gloucester, Middlesex, and Monmouth counties were over 20.00". Six other counties had maximums between 19.00-19.99" and only Ocean and Cape May counties had a station minimum under 10". The 7.80" in Little Egg Harbor Township (Ocean) was the lowest monthly total in NJ. Figure 1 shows the distribution of August precipitation across NJ. Clearly, no location was immune from excessive rain totals.
| County | Prcp | Town |
|---|---|---|
| Atlantic | 19.90" | Hammonton |
| 9.37" | Atlantic City Marina | |
| Bergen | 17.70"* | Palisades Park |
| 14.31" | Glen Rock | |
| Burlington | 17.36" | Burlington |
| 13.54" | Southampton Twp | |
| Camden | 18.26" | Berlin Twp |
| 17.32" | Winslow Twp | |
| Cape May | 12.61" | Upper Twp |
| 9.09" | Middle Twp | |
| Cumberland | 24.28" | Seabrook Farms |
| 12.77" | Millville Airport | |
| Essex | 18.79" | Newark Airport |
| 17.39" | Cedar Grove | |
| Gloucester | 22.32" | Franklin Twp |
| 18.88" | Woolwich Twp | |
| Hudson | 19.16" | Harrison |
| IA | ||
| Hunterdon | 17.72"* | Lambertville |
| 14.44" | Stockton | |
| Mercer | 19.29" | Hightstown |
| 15.96" | Ewing Twp | |
| Middlesex | 20.39" | Cranbury |
| 16.31" | North Brunswick | |
| Monmouth | 24.68"* | Freehold Twp |
| 14.31" | Wall Twp | |
| Morris | 19.61"* | Morris Twp |
| 13.17" | Boonton Twp | |
| Ocean | 17.31" | Jackson Twp |
| 7.80" | Little Egg Harbor Twp | |
| Passaic | 19.95" | West Milford |
| 14.93" | Wanaque | |
| Salem | 19.39" | Woodstown |
| IA | ||
| Somerset | 19.48" | Bound Brook |
| 15.13" | Peapack-Gladstone | |
| Sussex | 18.49" | Barry Lakes |
| 14.70" | Andover Twp | |
| Union | 19.13" | Westfield |
| 17.73" | New Providence | |
| Warren | 17.44" | Blairstown Twp |
| 15.16" | Allamuchy Twp |
Table 3. The wettest and driest CoCoRaHS and NWS Coop stations in each NJ county during August 2011. Asterisk denotes incomplete reports, with one or more days missing where some minor amounts of precipitation may have fallen. In some counties there is only one station with few enough missing data to be considered to have complete or near-complete observations for August, as other stations in the county have an inadequate number of reports (IA) for a complete evaluation.
Record precipitation for any month was observed at a number of stations across NJ. Table 4 shows four of these stations, including two with observations back to 1893. Only stations in the southeast failed to exceed a monthly record.
| Name | Aug. 2011 Prcp | Previous Record | Station Start Date |
|---|---|---|---|
| Atlantic City Int'l AP | 11.11" | 16.06" Aug. 1997 | Jul. 1958 |
| Atlantic City Marina | 9.37" | 15.69" Jul. 1959 | Jan. 1874 |
| Hightstown | 19.29" | 13.86" Aug. 1955 | Feb. 1893 |
| New Brunswick | 17.43" | 13.77" Aug. 1955 | Jan. 1893 |
| Newark Int'l AP | 18.79" | 13.22" Oct. 2005 | Feb. 1931 |
| Seabrook Farms | 24.28" | 12.99" Aug. 1967 | Aug. 1948 *missing '52-'62 |
Table 4. Comparison of August 2011 precipitation with prior record-wet months (for any calendar month) at selected NJ stations with lengthy records.
There were thirteen events in August that deposited at least 0.99" at one or more locations. Thunderstorms were found amidst each event. The precipitation onslaught began on the 1st when heavy localized storms brought 1.37" to Franklin Township and 1.24" to Mantua Township, both in Gloucester County, with some flash flooding observed. Up to quarter-size hail fell in parts of Gloucester and Camden counties and a wind gust of 46 mph occurred at Bivalve (Cumberland). Trees and wires fell in five southern counties. On the 3rd, the Burlington/Ocean/Monmouth and Bergen/Passaic areas received up to 1.42" at Southampton (Burlington) and 1.41" in Tenafly (Bergen).
The northern half of NJ saw storms from the afternoon of the 6th into early on the 7th. Sussex and Warren counties received the most, including 2.63" in Wantage and 2.76" at Montague, both in Sussex County. The afternoon and evening of the 7th brought rain to the northern border counties, with Newton (Sussex) catching 1.10". Moorestown in western Burlington County also received 0.78". A swath of heavy rain fell from the southwest to northeast on the 9th, accompanied by local flash flooding. 2.36" fell at Woolwich Township (Gloucester), 2.33" in Franklin Township (Somerset), and 2.29" at Long Hill Township (Morris). Trees and wires were blown down in Gloucester and Salem counties. Little fell in coastal counties and the far northwest.
In most months the storms that pounded the state on the 13th-14th would highlight any summary. While later upstaged by Irene, prodigious rains brought flash flooding and flooding of several moderate size rivers in southwest to central locations. The situation was especially devastating in eastern Salem, western Cumberland, eastern Gloucester, eastern Camden, and western Atlantic counties, where roads and several dams were overtopped or destroyed. In this area, 10.82" was measured in Upper Deerfield Township, 8.53" in Franklin Township (Gloucester), 8.04" in Winslow Township (Camden), and 7.51" at Hammonton (Atlantic). Of 176 CoCoRaHS reports across NJ, two stations recorded from 6-6.99", nineteen from 5-5.99", and 48 from 4-4.99". Trees and wires came down in some areas. A gust of 40 mph was observed at Seaside Heights (Ocean) though clearly gusts were higher in some areas where wind damage occurred yet no anemometers are located. Only the extreme southeast (0.44" in Egg Harbor Township (Atlantic)) and northwest escaped heavy rain.
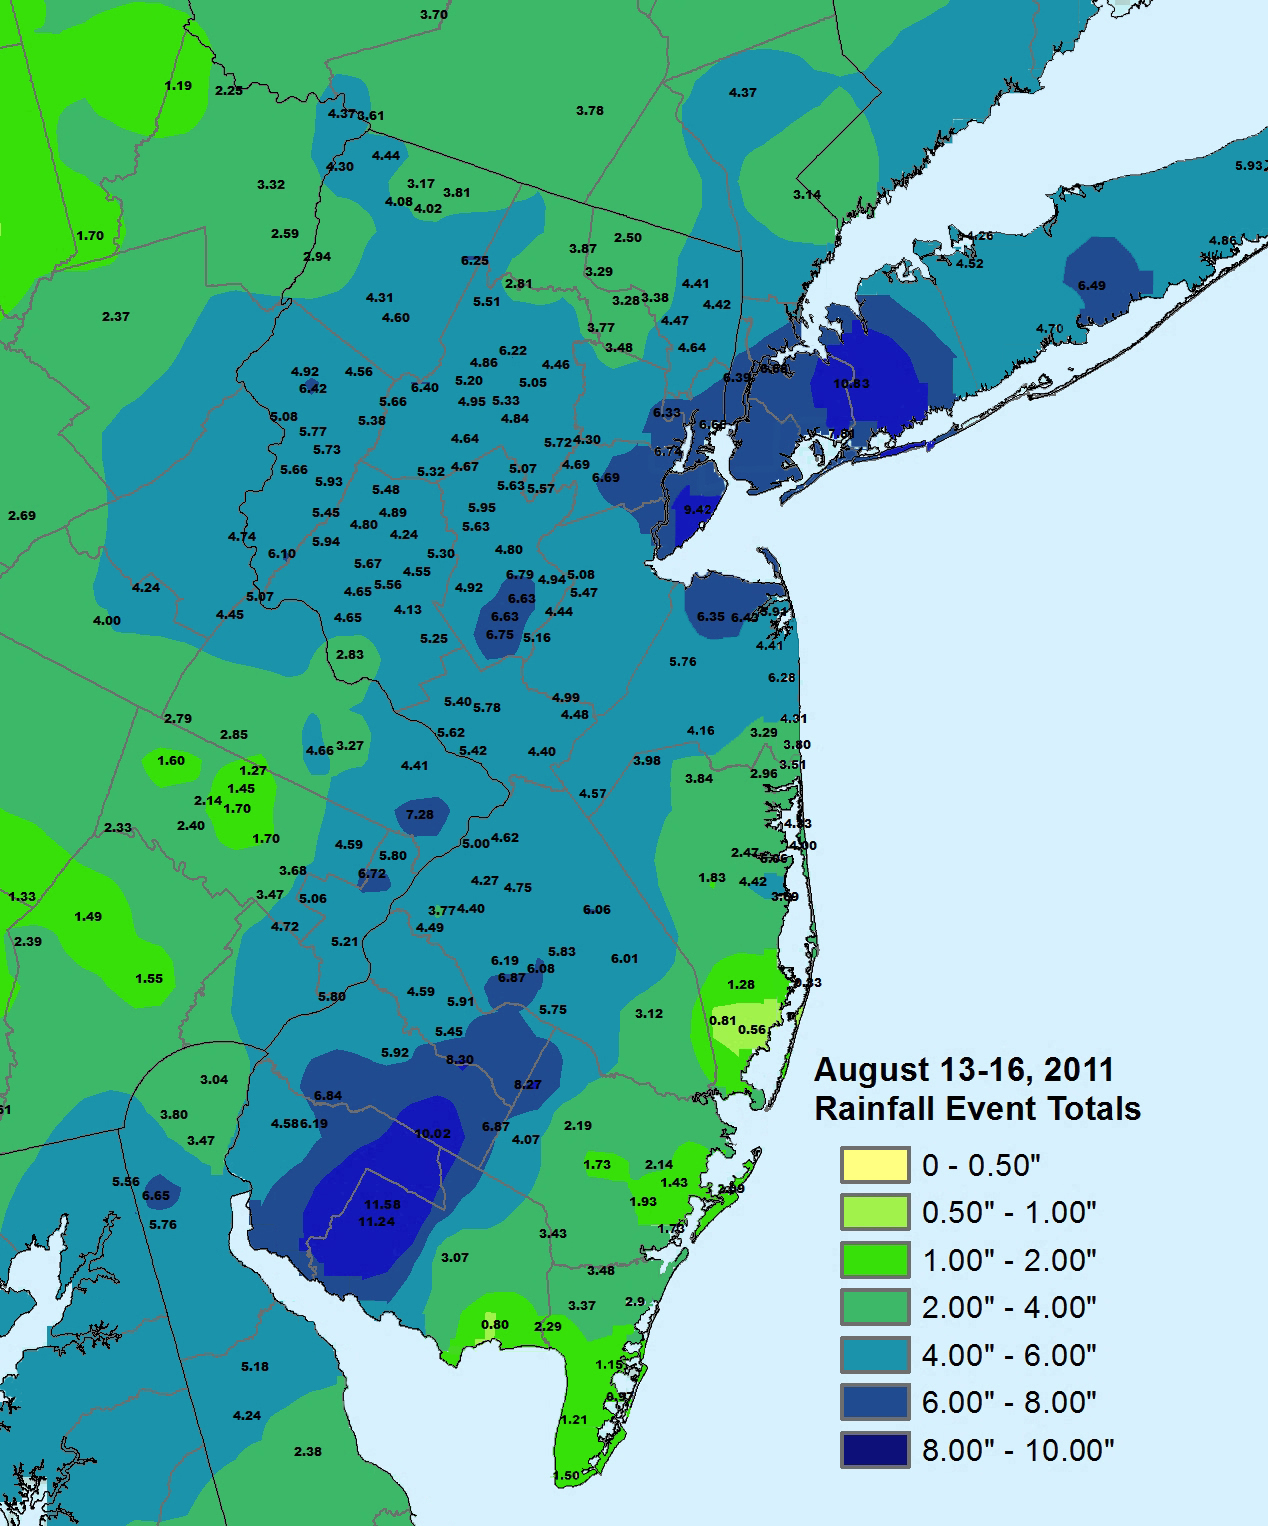
Storms continued to plague the state on the 15th. Fortunately, it was the exact regions that escaped the previous event that caught the most this time. This includes 3.63" at Hardyston Township (Sussex), 3.12" in Rockaway Township (Morris), and 3.40" in Upper Township (Cape May). Pea-size hail was observed in Bridgewater Township (Somerset). Moderate flooding was observed in Sussex and Somerset counties. The next day, 0.99" fell at Buena Vista Township (Atlantic) and 0.68" in Rumson (Monmouth). Figure 2 shows the total precipitation that fell across the state from the 13th-16th. Only scattered areas along the southeast coast were immune from heavy totals.
Next up were afternoon thunderstorms on the 18th and 19th. The first day saw 2.55" and 2.24" at two Blairstown (Warren) stations, 1.92" in Woodstown (Salem), and 1.91" at Freehold Township (Monmouth). Penny-sized hail fell in Mt. Laurel (Burlington) and pea-size hail in Hillsborough (Somerset). The 19th saw the heaviest amounts in the northeast, with 1.85" at River Vale (Bergen) and 1.53" in West Milford (Passaic). 1.50" also fell in Berlin Township (Camden), with some local flooding in Camden and Hunterdon counties. Little to no rain fell along the coast. There was damage to trees, wires and some structures in eight counties scattered around the state, and West Milford (Passaic) and Lebanon Township (Hunterdon) received pea-size hail.
Yet another major localized storm brought severe flooding to the Monmouth/northern Ocean county area on the 21st. Howell quickly received 4.61", two Jackson Township (Ocean) stations caught 3.85" and 3.40", and Ocean Township (Monmouth) received 3.75". The entire central portion of the state had heavy rain with little to none in the southernmost four counties. Once again, tree and wire damage occurred from strong gusts in Passaic, Morris, Bergen, Burlington, and Monmouth counties.
Contributing to the saturated soils and high river levels that preceded Irene, southwest areas previously clobbered on the 13th-14th received heavy rain on the 25th. 3.14" fell in Greenwich Township (Camden) and 2.29" at Bridgton (Cumberland). Less than an inch fell most everywhere else in NJ.
The weekend visit of Irene on the 27th-28th was preceded by an unprecedented evacuation of at least one million visitors and residents from coastal counties from Cape May to Monmouth. The morning of the 27th saw rain showers dotting the state, some in the north associated with the remnants of the front that brought the rain on the 25th. To the south, a shield of moderate to heavy rain began slowly moving northward. By evening, the entire state was receiving squalls with heavy rain, excessive wind and occasional lightning. At times, rainfall rates exceeded well over an inch per hour, with flash flooding quickly becoming a dangerous hazard. Trees began to topple, many uprooted due to the already saturated soils. Subsequently, wires came down and the bright greenish hue of exploding transformers illuminated the sky. By dawn on the 28th the heaviest rain had departed the south as Irene made landfall at Little Egg Harbor, just north of Atlantic City. By the time it exited into eastern Raritan Bay a few hours later Irene had been downgraded to a tropical storm. By mid morning the heavy rain made a full exit from NJ. Winds continued to gust strongly as the storm moved over New York City and into western Connecticut, the wind now from the northwest as opposed to earlier east to northeast gales, and some light showers passed through the state during the afternoon. By this time the secondary and major rivers within NJ were in flood stage. The smaller ones crested on the 28th, while the Raritan River did so on the 29th and the Passaic not until the 30th.
While fortunately arriving as only a strong tropical storm, as the preceding paragraph began to explain, Irene impacted the state significantly through a combination of coastal flooding, strong wind, and heavy rain. Coastal areas suffered beach erosion and some structural damage, however escaped what would have been far more significant consequences had the storm arrived stronger.
Tropical storm force winds throughout NJ brought down numerous trees onto homes and power lines resulting in structural damage and the loss of power to almost one million customers. Along the coast, winds gusted to near hurricane force, reaching 69 mph at Harvey Cedars (Ocean), 66 mph at the Atlantic City Marina (Atlantic), 65 mph at Point Pleasant Beach, with similar gusts from Cape May to Sandy Hook. Inland, gusts were in the 40-60 mph range. The minimum pressure in the eastern third of the state was 28.45"-28.65", with the western third between 28.75"-28.85".
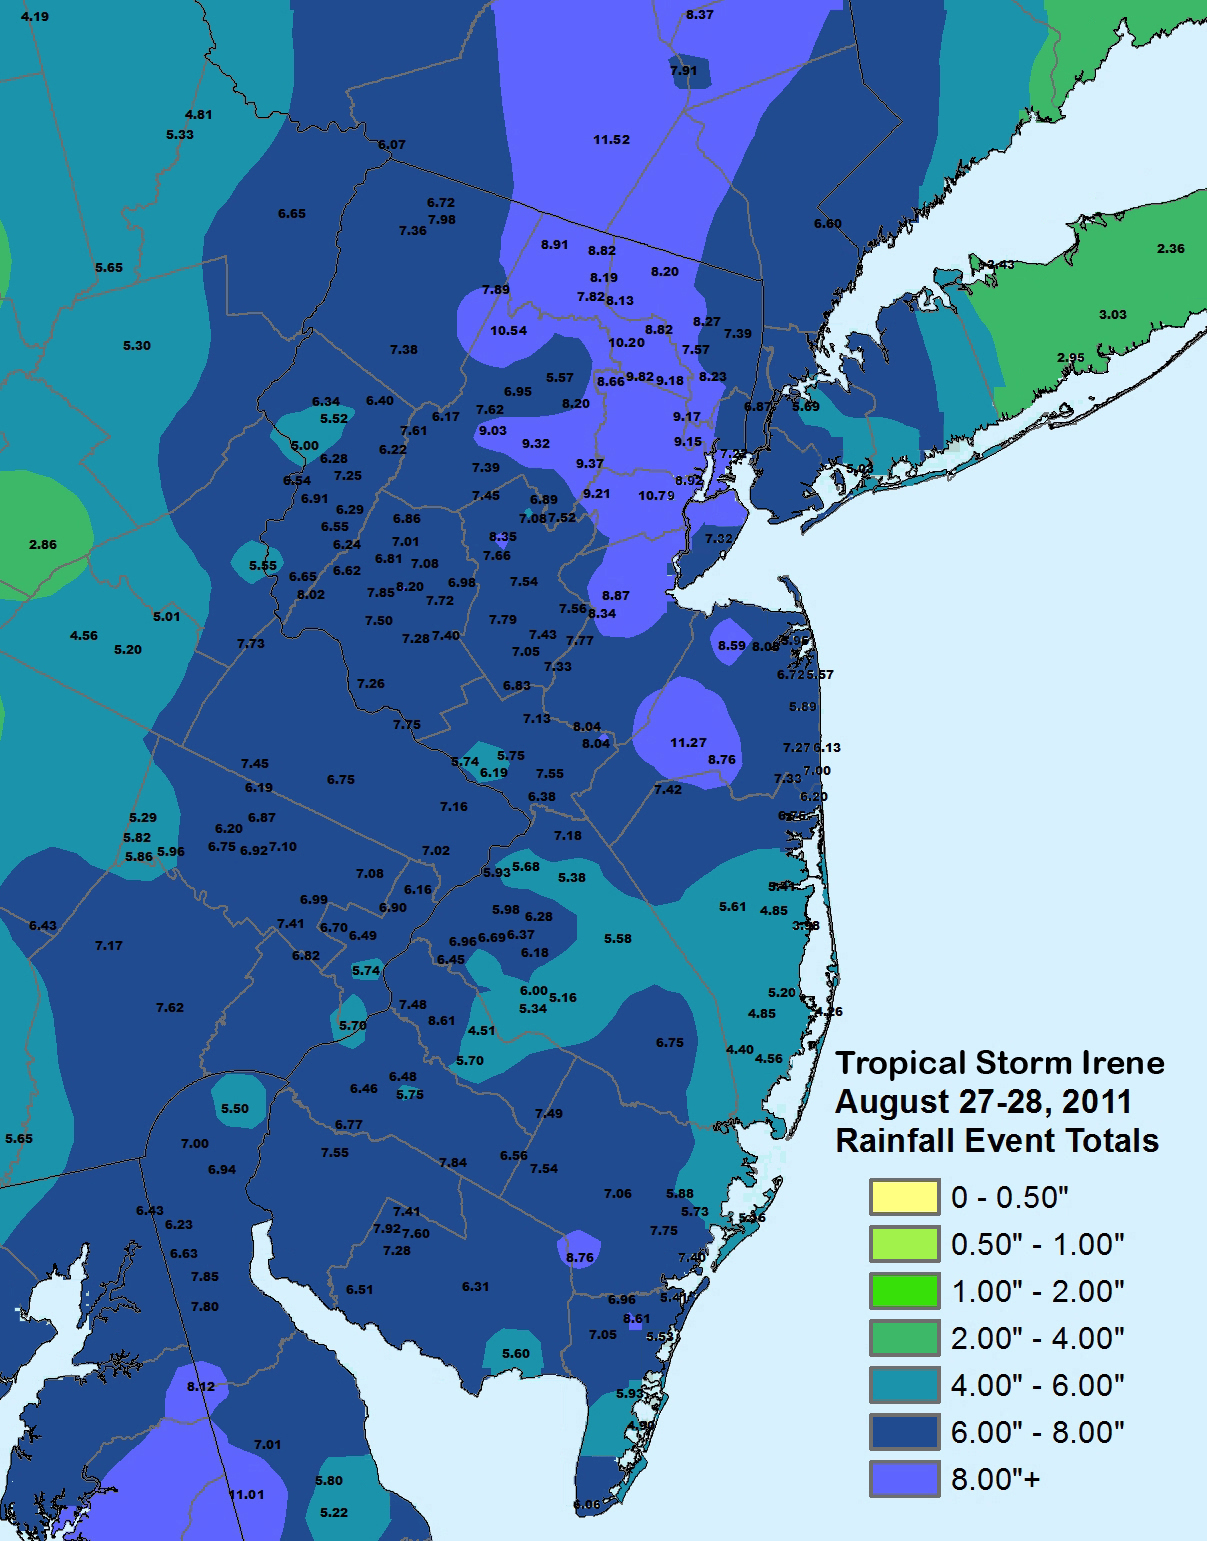
Rainfall was generally in the 5-10" range and amounted to NJ's largest rainstorm in over a century (Table 5 and Figure 3). The statewide rainfall averaged approximately 7". This surpassd Tropical Storm Doria on August 27-28, 1971, and is only behind tropical rains from an October 8-10, 1903 storm that occurred several weeks after the hurricane.
| County | Prcp | Town | Source |
|---|---|---|---|
| Atlantic | 8.76" | Estell Manor | Coop |
| Bergen | 9.17" | North Arlington | CoCoRaHS |
| Burlington | 7.30" | Crosswicks | Spotter |
| Camden | 8.61" | Somerdale | Coop |
| Cape May | 8.61" | Upper Twp | CoCoRaHS |
| Cumberland | 8.50" | Heislerville | Spotter |
| Essex | 9.96" | Orange | Spotter |
| Glocuester | 7.84" | Franklin Twp | CoCoRaHS |
| Hudson | 9.15" | Harrison | Coop/CoCoRaHS |
| Hunterdon | 10.32" | Stockton | Spotter |
| Mercer | 8.40" | Windsor | Spotter |
| Middlesex | 8.87" | Edison | Spotter |
| Monmouth | 11.27" | Freehold Twp | CoCoRaHS |
| Morris | 10.54" | Jefferson Twp | CoCoRaHS |
| Ocean | 7.42" | Jackson Twp | CoCoRaHS |
| Passaic | 10.20" | Wayne | ONJSC |
| Salem | 7.55" | Woodstown | CoCoRaHS |
| Somerset | 8.35" | Bedminster Twp | CoCoRaHS |
| Sussex | 7.98" | Wantage Twp | CoCoRaHS |
| Union | 10.79" | Elizabeth | Spotter |
| Warren | 7.25" | Mansfield Twp | CoCoRaHS |
Table 5. The wettest locations in each NJ county during Irene (August 27-28). Posted data are drawn from over 200 observations deemed reasonable. Sources include National Weather Service spotters, NWS Cooperative Observers, Office of the NJ State Climatologist NJ Mesonet, ONJSC NJ SafetyNet, Community Collaborative Rain, Hail and Snow (CoCoRaHS) network, and a direct report to the ONJSC.
On the heels of top-heavy rains earlier in the month, it is hardly surprising that Irene's rain resulted in streams and rivers rising to record or near-record stages. Homes, businesses, and roadways were inundated throughout the state. Table 6 lists new records on rivers in central and northern areas. Gauges at these locations have at least 50 years of record and in most cases extend back to the early 20th century. The Passaic River at Little Falls (Passaic) crested at approximately 14.2'. This is the second highest level on record, only behind the October 10, 1903 crest of 17.5' and surpassing 12.9' on April 7, 1984. At Bound Brook (Somerset), the Raritan River crested at 41.9', just behind the 42.1' reached on September 17, 1999 following Hurricane Floyd. Falling to third place is the 38.4' crest on April 16, 2007.
| River | Gauge Location | Previous Record |
|---|---|---|
| Assunpink Creek | Trenton (Mercer) | 1975 |
| Millstone | Blackwells Mills (Somerset) | 1999 |
| N. Branch Rancocas Creek | Pemberton (Burlington) | 1939 |
| Passaic | Millington (Morris) | 1996 |
| Passaic | Pine Brook (Morris) | 1903 |
| Pompton | Pompton Plains (Morris) | 1984 |
| Ramapo | Mahwah (Bergen) | 1955 |
| Ramapo | Pompton Lakes (Passaic) | 1984 |
| Rockaway | Boonton (Morris) above reservoir | 1984 |
| Rockaway | Boonton (Morris) below reservoir | 1979 |
Table 6. Gauging stations on NJ rivers that exceeded prior record maximum crests as a result of Irene's rainfall. Information courtesy of the NWS Middle Atlantic River Forecast Center.
The days following Irene proved to be sunny and tranquil, with the highest pressure of the month being observed on the 31st, ranging from 30.20"-30.25".
Irene was a storm for the record books. For that matter so was the entire month of August. However mere numbers do not tell the story of the loss of so many lives, nor the enormous hardships endured by so many who coped with this storm's wrath and with flooding earlier in the month.
Summer 2011 Overview
The 2011 summer (June-August) proved to be New Jersey's 3rd warmest since statewide records commenced in 1895 (Table 7). The average temperature of 75.1° is 2.3° above the 1981-2010 average (2.9° above the 1971-2000 average). The heat peaked in July, which with the late receipt of some data moved it from what was previously reported to be the second warmest on record to a tie with 1955 for warmest. This included July 22, one of the hottest days ever experienced by NJ residents. The NWS station at Newark Airport reached 108°, only 2° below the record state maximum. At least one location in every county reached triple digits on the 22nd. Seven of the ten hottest summers in the past 117 years have occurred in the past 13 years.
| Rank | Year | Summer Temp. |
|---|---|---|
| 1 | 2010 | 76.1° |
| 2 | 2005 | 75.6° |
| 3 | 2011 | 75.1° |
| 4 | 1949 | 74.6° |
| 5 | 1999 | 74.5° |
| 6 | 2002 | 74.4° |
| 7 | 2006 | 74.3° |
| 8 | 1955 | 74.1° |
| 9 | 2008 | 74.0° |
| 10 | 1900 | 73.9° |
Table 7. The ten warmest summers across New Jersey since 1895.
While statewide average rainfall was slightly below average in June and July, the ultra-wet August was enough to push the summer 2011 rainfall well above the previous record maximum. The 23.90" that fell is 11.15" above the 1981-2010 average. This exceeds the previous wettest summer (1928) by 4.23" (Table 8). This summer was also the wettest of any season on record, surpassing fall 1983 for top honors. Nine different decades are represented in the top ten.
| Rank | Year | Summer Prcp |
|---|---|---|
| 1 | 2011 | 23.90" |
| 2 | 1928 | 19.67" |
| 3 | 1938 | 19.64" |
| 4 | 1903 | 19.50" |
| 5 | 1975 | 19.29" |
| 6 | 2009 | 19.07" |
| 7 | 1897 | 18.55" |
| 8 | 1945 | 17.98" |
| 9 | 1967 | 17.94" |
| 10 | 1942 | 17.82" |
Table 8. The ten wettest summers (June-August) across New Jersey since 1895.
For those seeking more detailed information on hourly, daily and monthly conditions, please visit the following Office of the NJ State Climatologist's websites:
NJ Weather and Climate Network
NJ Community Collaborative Rain, Hail and Snow Network
NJ Snow Event Reports
Interested in receiving our monthly summaries at the end of each month? Send us your e-mail address here to join the mailing list.
Past Climate Summaries