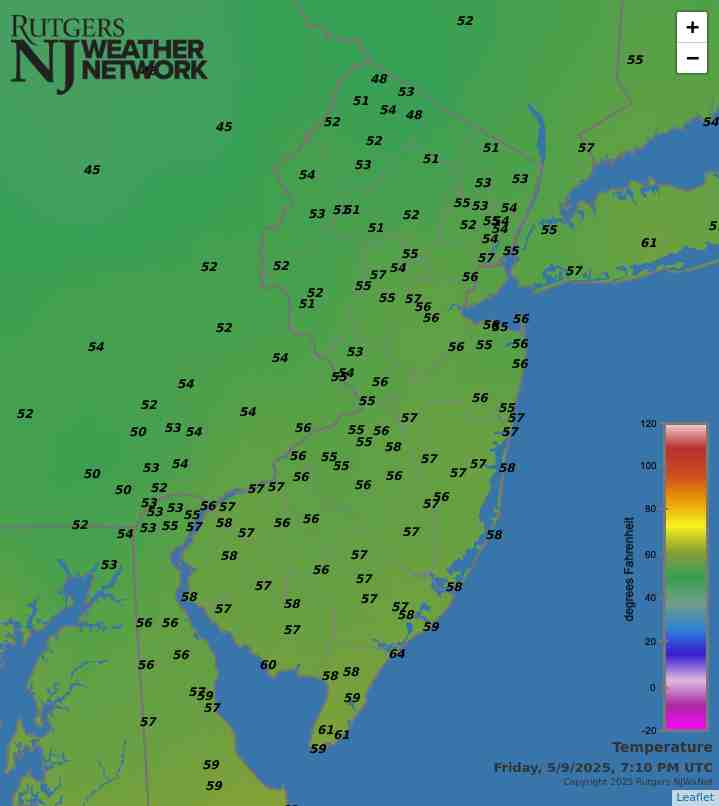
Latest temperatures across NJ appear in the above map. Click on the map or here, the Rutgers New Jersey Weather Network, for much more information.
Interested in becoming a volunteer weather observer? Click here to learn more about the CoCoRaHS Network!


NJ Precipitation and Temperature departures
over the past 12 months

March 2026 Recap
April 7, 2026
As is common as winter transitions into spring, this weather/climate shift came in fits and starts this March. Included were some rapid thermal flips, occasional powerful winds, and enough rain in the north to ease drought concerns but well below-normal rain in the south, a region that during winter had been leading the way with beneficial precipitation. The only thing mostly missing, for the third consecutive March, was snowfall, as the persistent snow and ice cover of recent months quickly melted.
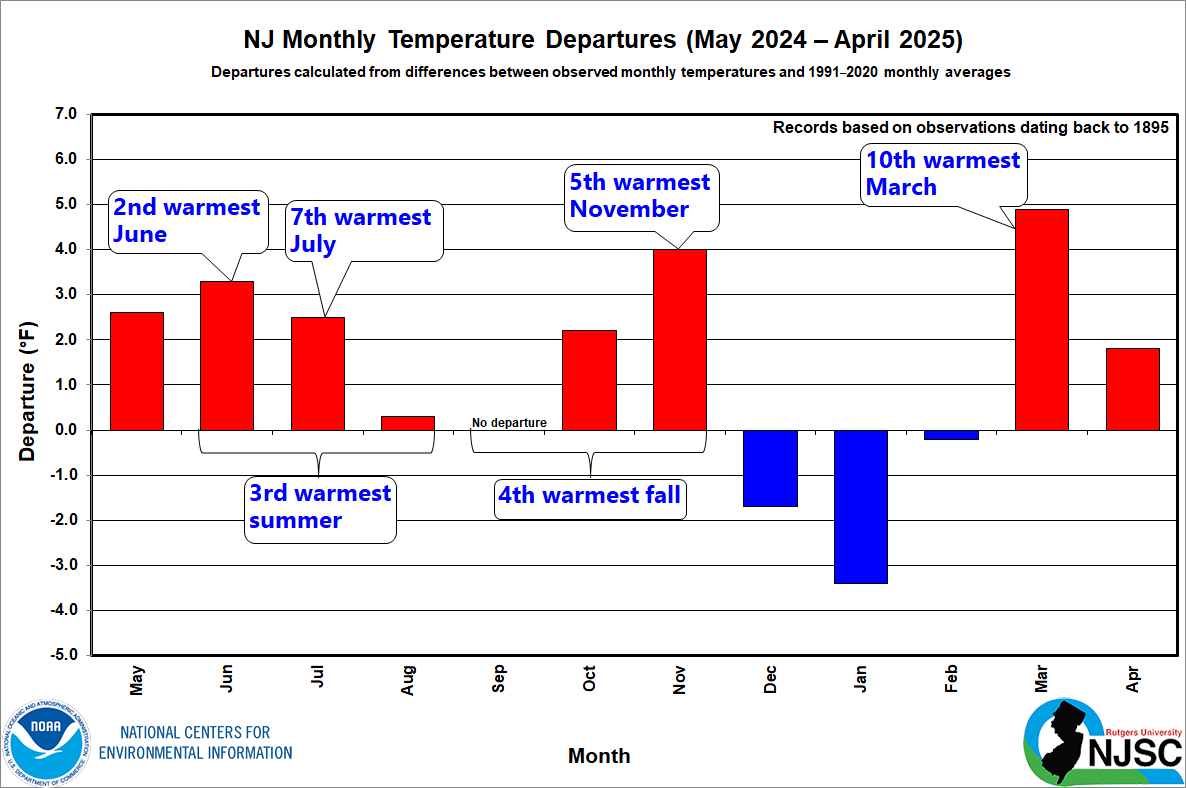
With a statewide ranking of 12th warmest, March 2026 is the eighth over the past 26 years to rank in the top 15 with records dating back to 1895. The 45.1° statewide average is 4.1° above the 1991–2020 normal. The average high of 55.9° is 5.0° above normal and ranks 11th mildest. The average low of 34.3° is 3.1° above normal and ranks 14th mildest. Regionally, the northern division averaged 42.9° (+4.1°, 12th mildest), the southern division 46.6° (+4.2°, 12th mildest), and the coastal division 45.9° (+3.7°, 12th mildest).
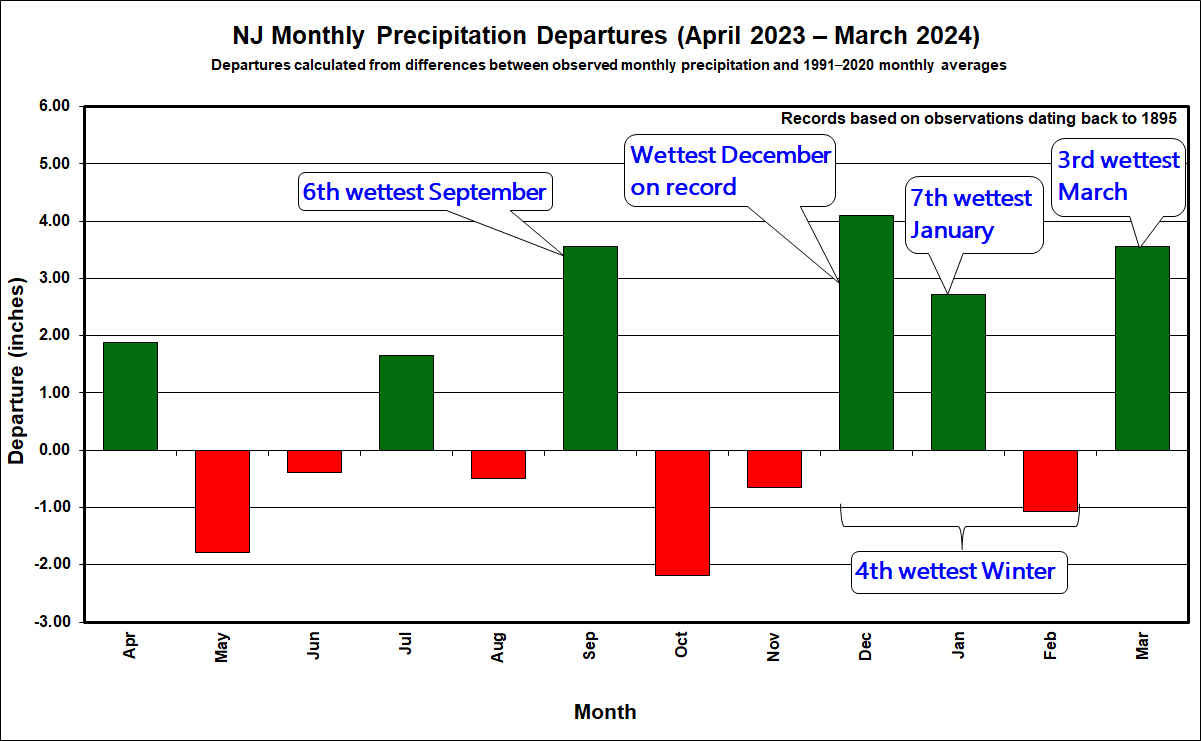
Statewide, March precipitation averaged 3.28”. This is 0.92” below normal, ranking as the 47th driest on record. The north came in at 4.78” (+0.77”, 30th wettest/103rd driest), the south 2.37” (-1.95”, 21st driest), and the coast 2.24” (-2.18”, 16th driest). The overall below-normal NJ precipitation pattern dates to May 2024, with 20 of the past 23 months below normal. Thus, NJ remained in a NJ Department of Environmental Protection Drought Warning and all of the state was in a stage of moderate drought or abnormal dryness according to the US Drought Monitor at month’s end.
More...
Past News Stories