Sticky: August 2021 and Summer 2021 Recaps
New Jersey State Climatologist
Center for Environmental Prediction, School of Environmental and Biological Sciences/NJAES, Rutgers University
September 8, 2021
August Overview
Whether the thermometer was reading high or low this August or whether rain was falling or not, one factor that most always had to be considered was the high level of humidity. The “Dog Days” of summer indeed. Of course, there was much else to consider this month, including contributions of rain from two tropical storms, one of which brought the largest crests on some rivers since May 1, 2014, 11 days where one or more locations received at least 2.00” of rain, and 16 days where the high temperature reached 90° or higher somewhere in the state.
Adding up all the rainfall, the statewide monthly average was 6.87”. This is 2.30” above the 1991–2020 normal and ranks as the 15th wettest August since 1895. The northern climate division led the way with 7.89” (+3.33”, 11th wettest), followed by the coastal area with 6.65” (+2.05”, 21st wettest), and the southern division at 6.21” (+1.64”, 27th wettest).
The statewide average temperature of 75.9° is 2.3° degrees above normal and ranks 4th warmest (Table 1). Seven of the top 10 and 13 of the warmest 20 have occurred this century. The warmth was most strongly a function of elevated nighttime temperatures, which, for NJ, averaged 66.9°. This is 3.6° above normal and ranks 2nd warmest. The maximum temperature averaged 84.9°, some 1.1° above normal and ranks 18th warmest.
| Rank | Year | Aug. Avg. Temp. |
|---|---|---|
| 1 | 2016 | 76.9° |
| 2 | 2018 | 76.8° |
| 3 | 2005 | 76.4° |
| 4 | 2021 | 75.9° |
| 5 | 2002 | 75.8° |
| 6 | 1980 | 75.6° |
| 7 | 2020 | 75.5° |
| 7 | 2001 | 75.5° |
| 7 | 1955 | 75.5° |
| 10 | 1988 | 75.4° |
Table 1. The 10 warmest Augusts across New Jersey since 1895.
Precipitation and Storms
As is commonly the case during summer months, rainfall totals varied widely across NJ this August, by a factor of four from wettest to driest locations. Still, as seen in Figure 1, the majority of the state received above-average rainfall, the wettest areas scattered in north, central, and central coastal areas. The lowest totals were in the southwest and along the north and south coasts. Top honors went to two stations in Stafford Township (Ocean County) with 11.89” and 11.20”. Next was Ringwood (Passaic) at 11.57”, West Milford (Passaic) 11.29”, Bedminster (Somerset) 11.15”, Far Hills (Somerset) 10.99”, Plainsboro (Middlesex) 10.82”, Long Beach Township (Ocean) 10.80, Rockaway Township (Morris) 10.75”, and Mine Hill Township (Morris) 10.74”. Woodstown (Salem) saw the least rainfall with 2.38”, followed by Pennsville (Salem) 2.76”, Manasquan (Monmouth) 3.40”, South Harrison (Gloucester) 3.42”, Moorestown (Burlington) 3.43”, Point Pleasant Beach (Ocean) 3.58”, and Franklin Township (Gloucester) 3.61”. Thus, the top ten wettest stations were found in five counties while the seven driest stations were also found in five counties. Stations in Ocean County were found in both categories.
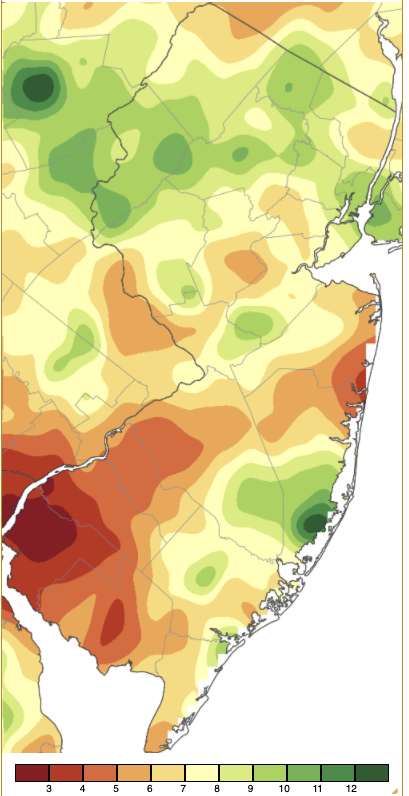
Figure 1. August 2021 precipitation across New Jersey based on a PRISM (Oregon State University) analysis generated using NWS Cooperative and CoCoRaHS observations from 7 AM on July 31st to 7 AM on August 31st. Note the scale in inches at the bottom of the map. Totals range from 3.00”–4.00” (red; over a portion of southwest NJ) to 12.00”–13.00” (dark green).
A review of the inch-plus events begins a week into the month when rain moved into the south during the afternoon of the 7th, eventually making it north and slowly departing coastal areas during the daytime hours of the 8th. The heaviest totals were in the southern half of the state, with under 0.50” in the north (Figure 2). Two Stafford Township stations caught 3.90” and 3.06”, with 3.82” in Washington Township (Burlington), Bass River Township (Burlington) 3.70”, both Winslow Township (Camden) and West Creek (Ocean) 3.49”, and Buena Vista (Atlantic) 3.18”. Of 260 CoCoRaHS reports, 29 were from 2.00”–2.89” and 56 from 1.00”–1.99”.
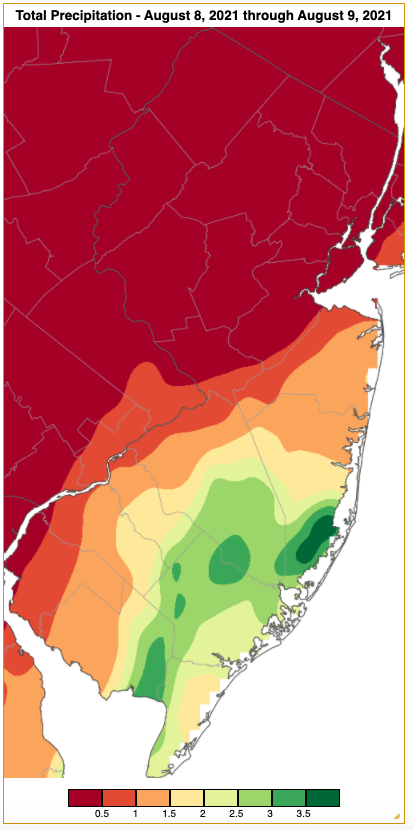
Figure 2. Rainfall from approximately 7 AM on August 7th to 7 AM on August 9th based on a PRISM (Oregon State University) analysis generated using NWS Cooperative and CoCoRaHS observations. Note the scale in inches at the bottom of the map.
The next two events exemplified the frequent local nature of summertime rainfall. Scattered showers occurred during the afternoon of the 9th, transitioning to locally heavy rain early on the 10th, followed by a line of storms moving through central NJ during the evening, and finally rain in the north into the early hours of the 11th. All of this combined to give local totals as high as 3.84” and 3.52” in Mansfield (Burlington), 3.20” at Bordentown (Burlington), 2.87” in Burlington (Burlington), five other stations from 2.06”–2.60”, and 39 from 1.00”–1.86”. This occurred despite other areas receiving little to no rain (Figure 3a). Rain resumed with storms mainly in the north during the evening of the 11th into the early hours of the 12th. Roxbury (Morris) received 3.30”, two Randolph Township (Morris) stations 2.41” and 1.95”, Pequest (Warren) 1.78”, Mine Hill Township 1.77”, and Parsippany (Morris) 1.61” (Figure 3b). Most other areas received little to no rain. Storms on the 10th brought wind gusts to 42 mph at Logan Township (Gloucester) and 41 mph at Lower Alloways Creek Township (Salem). The 11th saw a gust to 59 mph at Newark-Liberty Airport (Essex) and 45 mph at Lower Alloways Creek Township. There were scattered reports from the southwest and north of tree and wire damage.
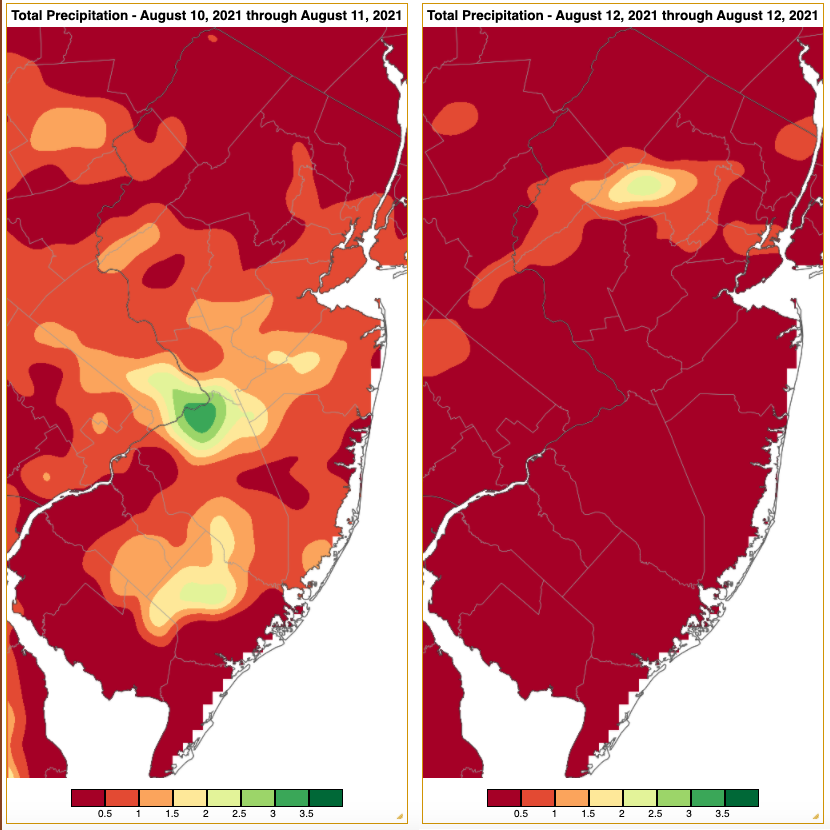
Figure 3. a) Rainfall from approximately 7 AM on August 9th to 7 AM on August 11th (left) and b) from approximately 7 AM on August 11th to 7 AM on August 12th (right). Each map is based on a PRISM (Oregon State University) analysis generated using NWS Cooperative and CoCoRaHS observations. Note the scale in inches at the bottom of each map.
Next, it was Cape May County’s chance to get wet. Thunderstorms early on the 15th deposited 1.75” in North Wildwood, Stone Harbor 1.60”, Middle Township 1.54”, and Cape May Court House 1.29”.
Late on the 18th, the remnants of Tropical Storm Fred moved into the state from the west. The main action was in the pre-dawn hours of the 19th when heavy rain fell in the northwest and a weak tornado touched down in Rockaway Township. Blairstown (Warren) had stations receive 2.91” and 2.77”, Frelinghuysen Township (Warren) 2.64”, Knowlton Township (Warren) 2.50”, Stillwater Township (Sussex) 2.26”, and 57 CoCoRaHS stations caught from 1.00”–2.05” (Figure 4). The EF0 tornado had an estimated peak wind speed of 85 mph, traveled 0.91 miles, and had a maximum width of 50 yards. It touched down at 2:38 AM and was on the ground for several minutes. Damage was confined to trees and fencing. It was New Jersey’s 10th tornado of 2021, tying with 2019 for the second most in any year since 1950, though well behind the 17 in 1989.
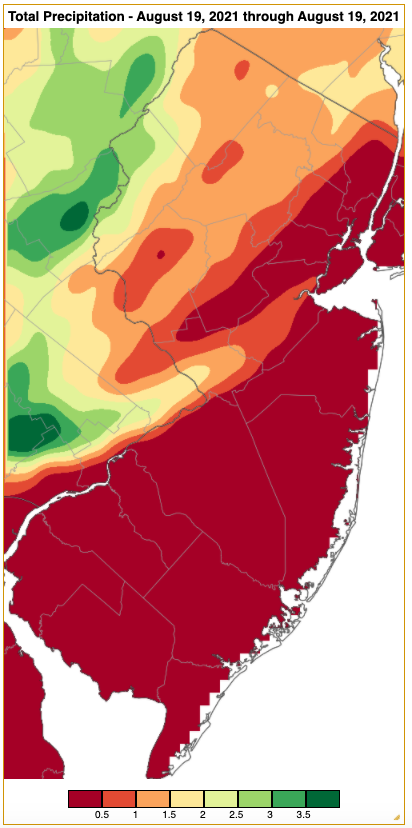
Figure 4. Rainfall from approximately 7 AM on August 18th to 7 AM on August 19th based on a PRISM (Oregon State University) analysis generated using NWS Cooperative and CoCoRaHS observations. Note the scale in inches at the bottom of the map.
Rain fell in the south on the morning of the 20th, with a bit more falling early on the 21st. Brigantine (Atlantic) received 2.03”, Deerfield (Cumberland) 1.78”, two Middle Township sites had 1.55” and 1.29”, two Vineland (Cumberland) locations had 1.87” and 1.44”, and four Lower Township (Cape May) gauges caught from 1.16”–1.29”.
The main event of the month arrived on the evening of the 21st with scattered storms in the northeast. Early on the 22nd, extremely heavy rain induced flash flooding to a portion of Long Beach Island and also southern Middlesex and Mercer counties. At this time, Hurricane Henri was heading up the east coast, helping to feed moisture into these deluges as a storm-steering trough of low pressure sat to the west. Henri weakened to a tropical storm before making landfall in Rhode Island midday on the 22nd. From there it turned sharply to the west with an accompanying heavy shield of rain, particularly to the west and ultimately south (left side of the storm) as it traveled to the southern Catskills as a tropical depression. This put northern and central NJ in a zone of heavy rain for many hours before tapering off on the 23rd as scattered heavy showers fell in south Jersey. Stations received 2.00” or more in 17 counties, with only the far south receiving less (Figures 5 and 6). Top rainfall totals for the 11 counties where one or more station received 5.00” or more are posted in Table 2. Of the 270 CoCoRaHS reports, 11 came in from 7.28”–8.78”, 70 from 5.00”–6.85”, 100 between 3.00”–4.99”, 64 from 1.00”–2.99”, and 26 from 0.15”–0.99”. A full listing of rainfall totals can be viewed here.
Water rescues from homes and vehicles occurred in southern Middlesex County communities such as Helmetta, Spotswood, Jamesburg, and Monroe Township. Moderate and some locally major flooding occurred in the Raritan Basin, with some streams and rivers leaving their banks in the Passaic Basin. Figures 7–9 show time series of stream and river discharge or discharge and stage for, sequentially, the Stony Brook that flows into the Millstone that joins the Raritan just upstream of the latter’s gauging station. The Raritan rose approximately 13 feet. Winds were light throughout the state with Harvey Cedars (Ocean) receiving the top NJWxNet gust of 26 mph on the 22nd and Fortescue (Cumberland) 37 mph on the 23rd.
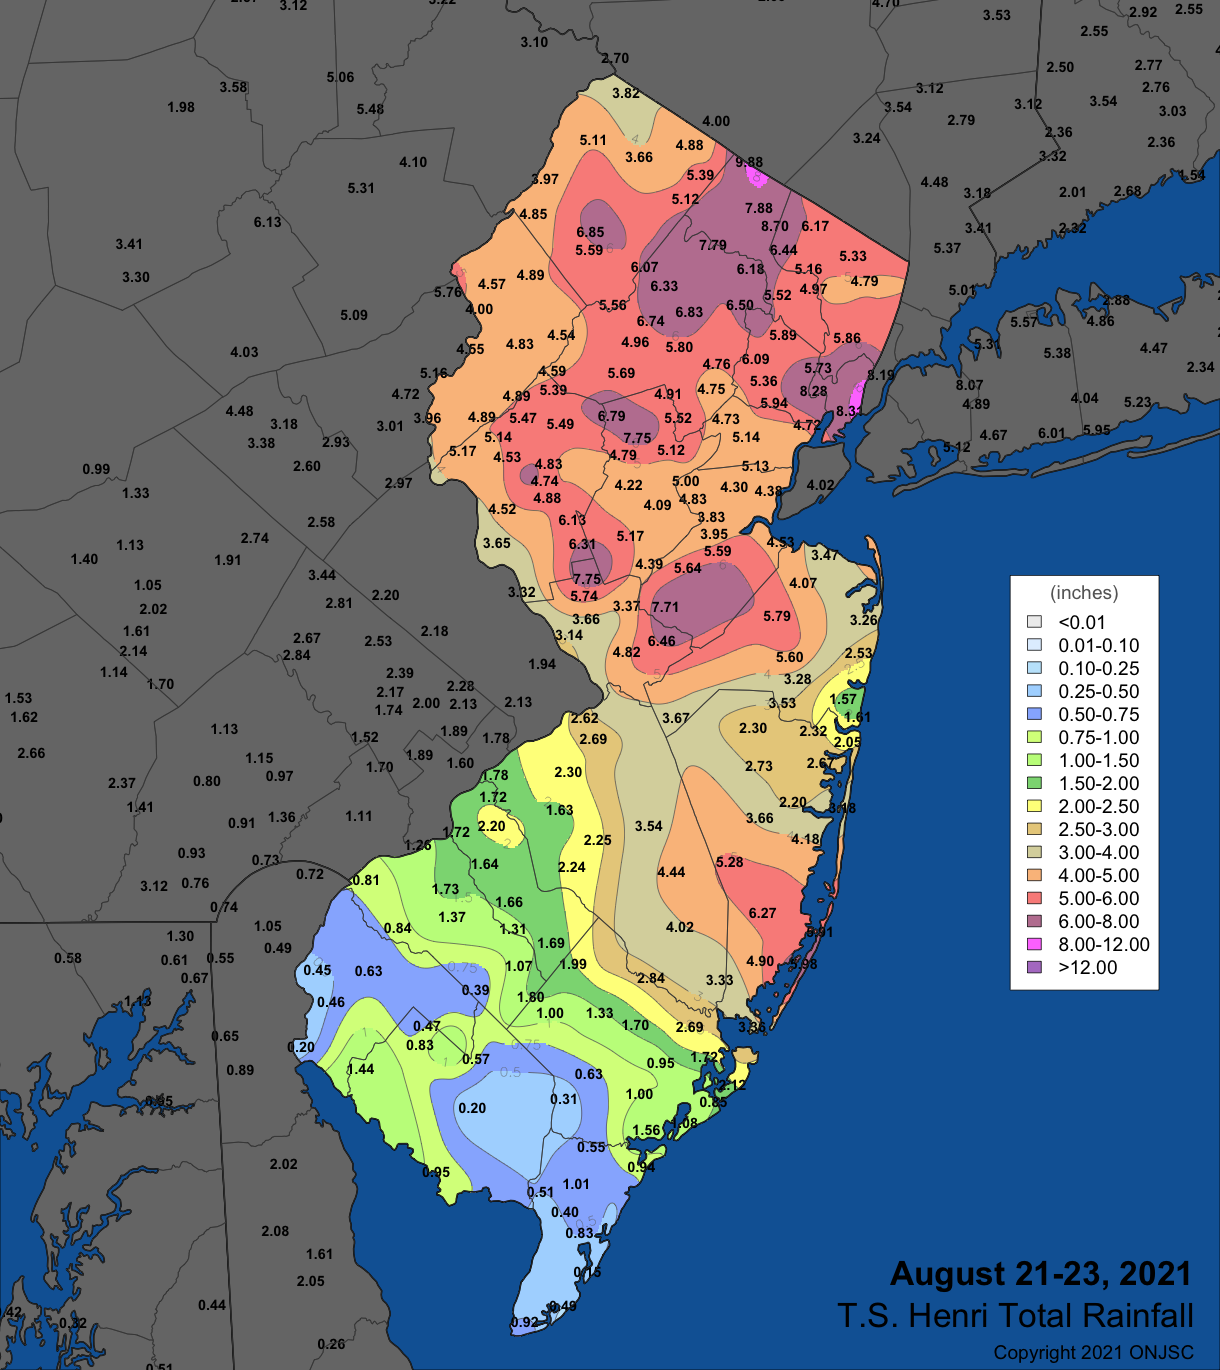
Figure 5. Rainfall from August 21st to 23rd based on an ONJSC analysis generated using observations from NWS Cooperative, CoCoRaHS, NJWxNet, and a few other smaller networks. Note the scale in inches to the right of the map. A full listing of rainfall totals can be viewed here.
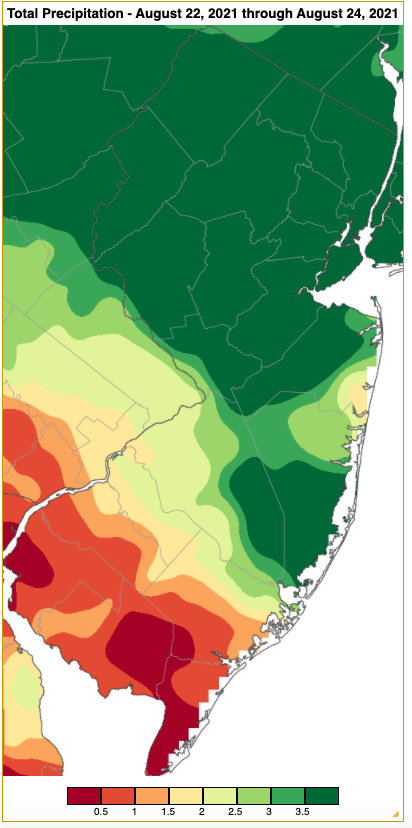
Figure 6. Rainfall from approximately 7 AM on August 21st to 7 AM on August 24th based on a PRISM (Oregon State University) analysis generated using NWS Cooperative and CoCoRaHS observations. Note the scale in inches at the bottom of the map, which is the same as the scale on Figures 2-4, thus the purpose of this figure to demonstrate the extreme nature of the distribution of heavy rainfall compared to other events this August.
| County | Location | Rainfall |
|---|---|---|
| Middlesex | East Windsor | 9.02” |
| Passaic | Ringwood | 8.73” |
| Hunterdon | Franklin Township | 8.49” |
| Hudson | Harrison | 8.27” |
| Ocean | Long Beach Township | 8.14” |
| Mercer | Hopewell | 7.75” |
| Somerset | Bedminster | 7.75” |
| Sussex | Newton | 6.85” |
| Bergen | Oakland | 6.44” |
| Essex | West Caldwell | 6.36” |
| Union | Westfield | 5.14” |
Table 2. The heaviest rainfall observed from August 21st–23rd in counties where at least one location received 5.00”.
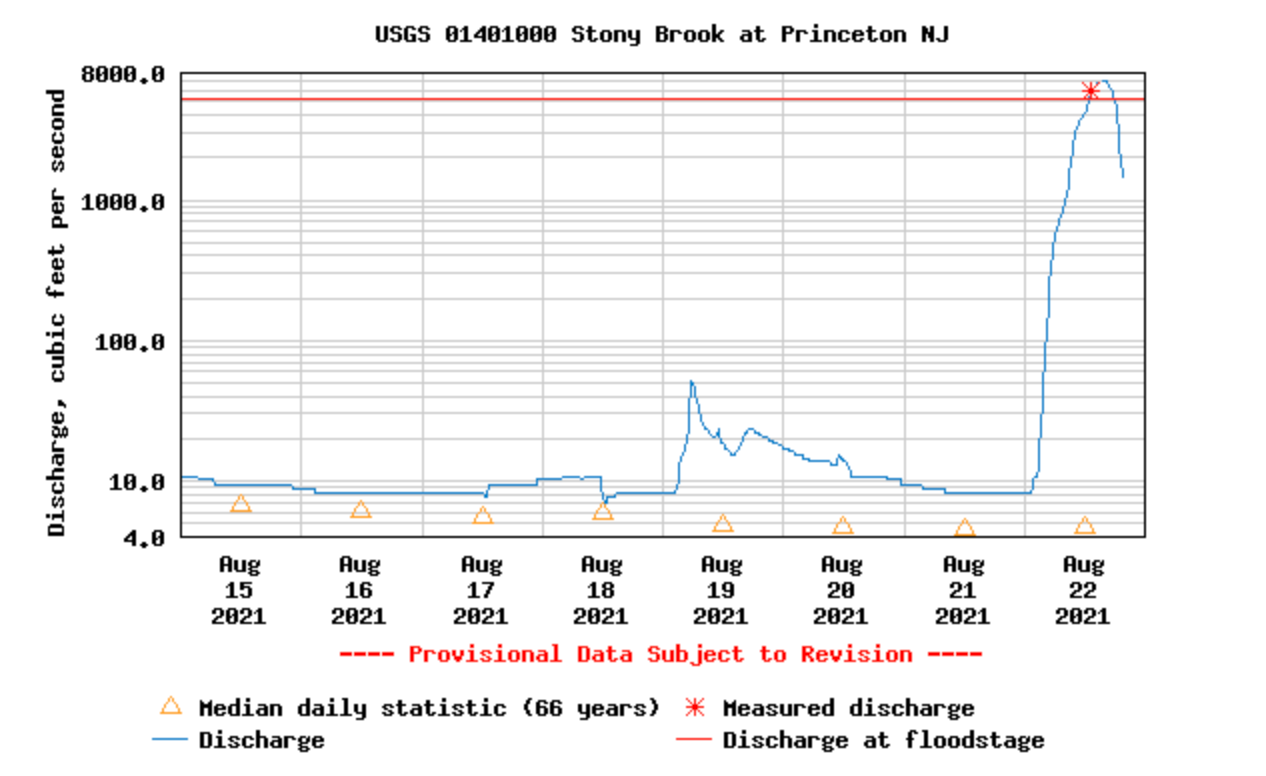
Figure 7. Discharge of the Stony Book at Princeton (Mercer) from August 15th to 22nd. Note the non-linear discharge scale (courtesy of USGS).
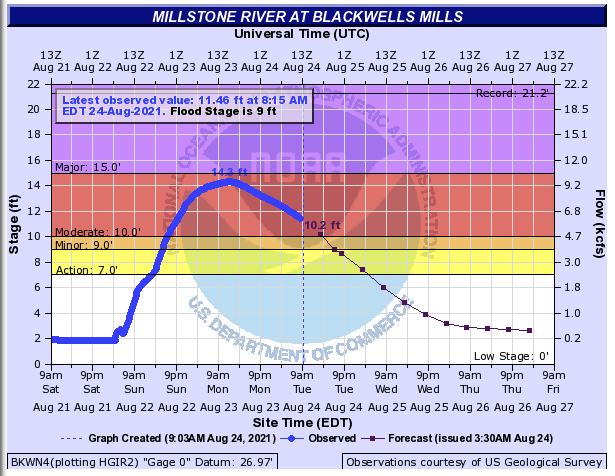
Figure 8. Discharge of the Millstone River at Blackwells Mills (Somerset) from 9 AM on August 21st to 9 AM on August 23rd (blue line). Forecast for the declining discharge onward into the 27th also shown (purple line). Note the linear state scale (left axis) and non-linear discharge scale (right axis; courtesy of NOAA).
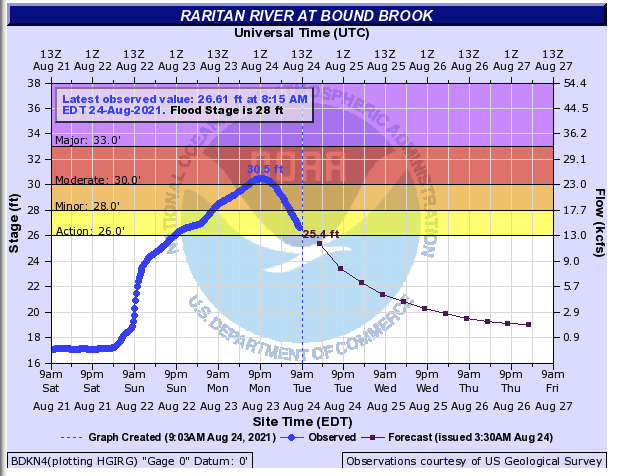
Figure 9. Discharge of the Raritan River at Bound Brook (Somerset) from 9 AM on August 21st to 9 AM on August 23rd (blue line). Forecast for the declining discharge onward into the 27th also shown (purple line). This gauge is just downstream from the confluence of the Raritan and Millstone rivers. Note the linear state scale (left axis) and non-linear discharge scale (right axis; courtesy of NOAA).
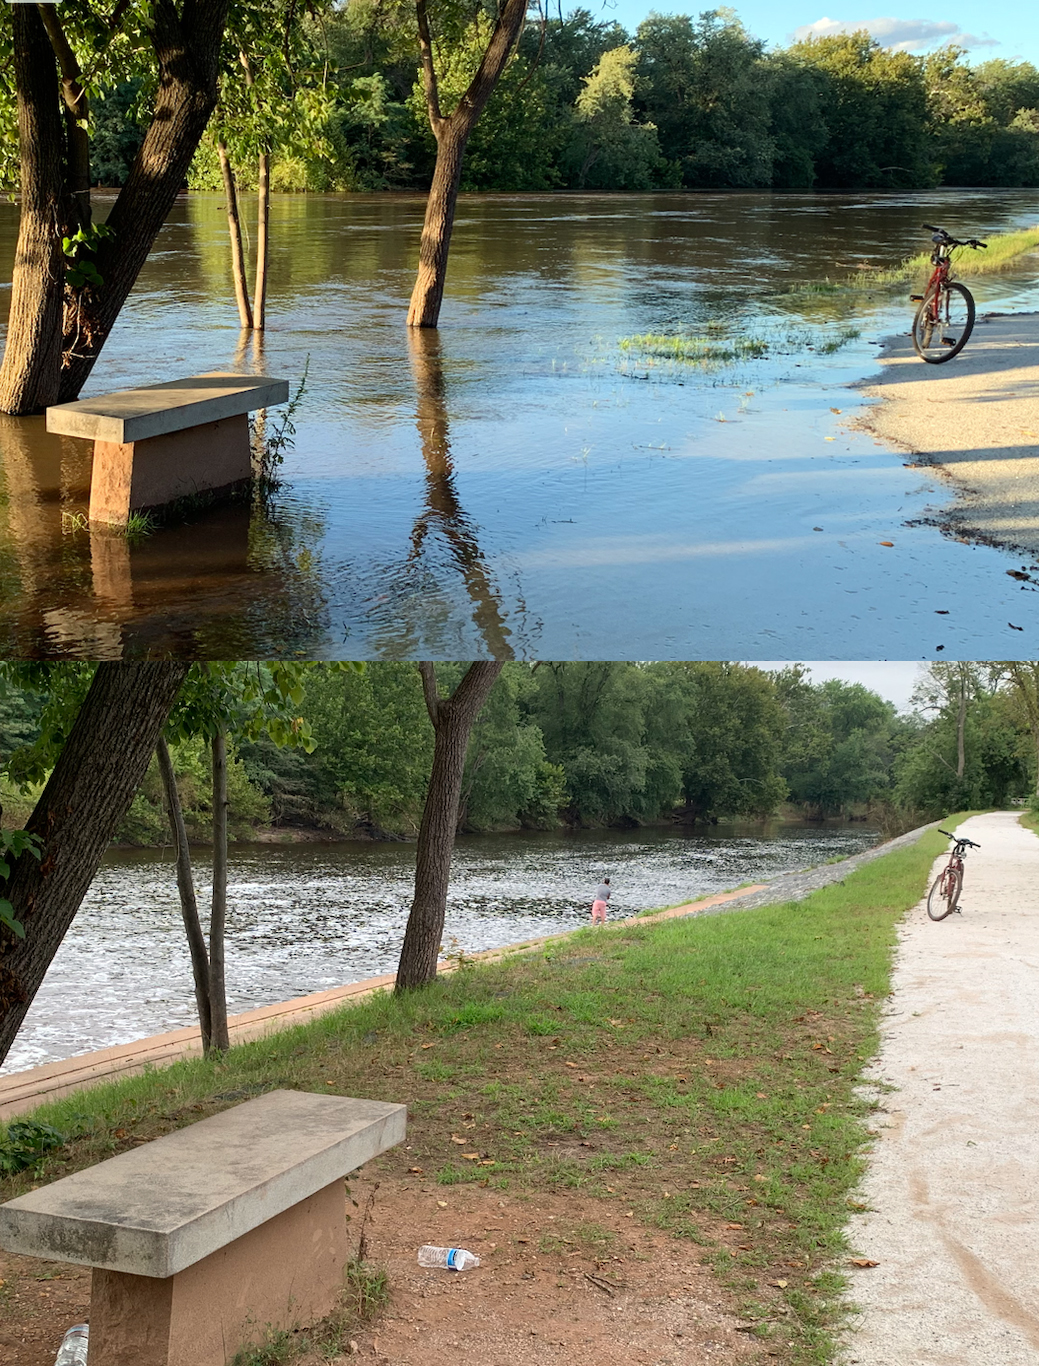
Figure 10. The Raritan River several hundred feet downstream of the confluence with the Millstone River in Somerset (Somerset) and less than a mile upstream of the gauging station reporting in Figure 9. The top photo was taken at 6:30PM on August 23rd, close to crest time. Note water just beginning to cover the towpath of the Delaware-Raritan Canal that lies just to the right of the path. The bottom photo was taken at 6:30 PM on August 29th when the river had returned to a level about a foot higher than the pre-storm stage. Note the fisherman at the river, well below the towpath (photo by D. Robinson).
Isolated afternoon showers fell in northern portions of south Jersey on the 26th. Two Toms River (Ocean) stations picked up 2.16” and 2.06”, two Pine Beach sites 1.20” and 1.22”, and Riverside Township (Burlington) 1.05”. Yet more rain dotted the state during the afternoon and evening of the 27th. In order to show the hit and (mostly) miss nature of these storms, a National Weather Service gridded precipitation product is shown in Figure 11. It is based on radar that is “tuned” for estimated rainfall using some station gauge observations. Nine counties are represented in the top 10 CoCoRaHS and NJWxNet observations for the event. Totals include Berkeley Township (Ocean) with 2.42” and also a gust to 49 mph, Phillipsburg (Warren) 2.31”, Oswego Lake (Burlington) 1.88”, Jackson Township (Ocean) 1.90”, Edison (Middlesex) 1.61”, Pennsauken (Camden) 1.55”, Monroe Township (Gloucester) 1.42”, Rockaway Township 1.42”, Middle Township 1.18”, and Egg Harbor Township (Atlantic) 1.07”.
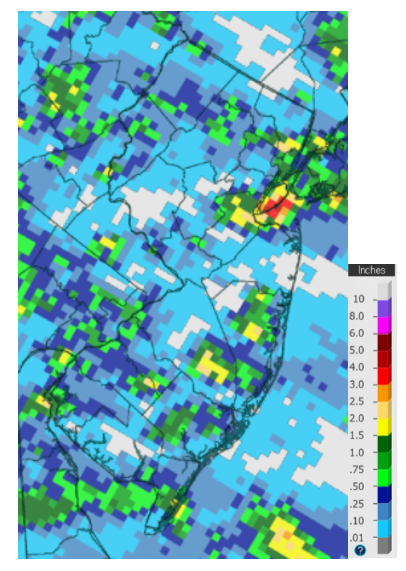
Figure 11. Rainfall from 8 AM on August 27th to 8 AM on August 28th from the Advanced Hydrologic Prediction Service precipitation analysis (NWS/NOAA). Note the scale in inches at the right of the figure.
The raindrops continued to fall on the 28th, mostly near the coast. Egg Harbor Township caught 2.00”, Somers Point (Atlantic) 1.65”, and Brigantine 1.33”. The southeast coast was doused again during the daytime hours of the 29th, with a local area catching as much as 3.17” in Ocean City (Cape May), 2.21” at Somers Point, and 1.39” in Sea Isle City (Cape May). For this event, eight of 211 CoCoRaHS reports exceeded 0.50”, while in Fortescue the wind gusted to 45 mph. Finally, the last inch-plus event of the month occurred from the afternoon into the evening of the 30th. And tragically so, as a lightning strike took the life of a young lifeguard in South Seaside Park/Berkeley Township. Seven others were injured from the strike which appeared to about 4 miles south of where the main thunderstorm cell was in progress. This was reminiscent of a similar death in Island Beach State Park (Ocean) in July 2001 and was New Jersey’s second lightning death of the summer. Rainfall from the scattered storms totaled 1.86” in Lacey Township (Ocean), Berkeley Township 1.55”, Absecon (Atlantic) 1.37”, Brigantine 1.26”, Lower Township 1.21”, Galloway Township (Atlantic) 1.21”, and Hardyston (Sussex) 1.11”.
Barometric pressure readings across the state topped out in the 30.20”–30.30” from the 15th–18th and 28th–29th, which is not all that high. The 23rd saw the lowest pressure or the month, and not all that low at 29.70”–29.80”.
Temperature
August started off on a rather comfortable note, with seven of the first nine days finding some stations with lows in the 40°s and 50°s, with four other such days later in the month. The first of the cool mornings was the 1st with Walpack (Sussex) down to 48°, Sandyston (Sussex) 49°, and 36 of the 64 WxNet station from 51°–59°. The warm ocean helped keep the low at Atlantic City Marina (Atlantic) up at 68°. Figure 12 shows how coastal and urban areas remained in the 60°s while inland areas from the northwest to the Pine Barrens felt the 50°s.
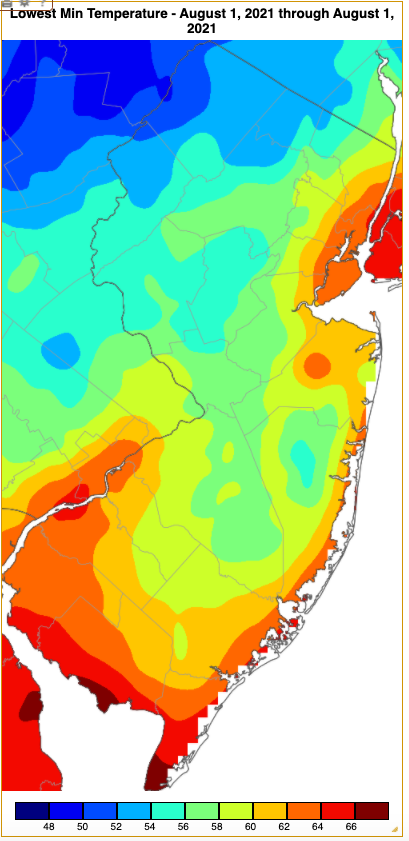
Figure 12. Minimum temperatures on August 1st based on a PRISM (Oregon State University) analysis generated using NWS, NJWxNet, and other professional weather stations. Note the in 2 °F increments at the bottom of the map.
The 2nd saw a low of 49° in Walpack, with 39 stations from 51°–59°. The 3rd was the chilliest morning of August, with Walpack down to 45°, Sandyston 46°, Pequest 48°, and 38 other sites from 50°–59°. Again, there was coastal warmth with Harvey Cedars and Atlantic City Marina only down to 68°. Walpack and Sandyston fell to 53° on the 4th, Kingwood (Hunterdon) 54° and Pequest 55° on the 5th, Walpack, Hopewell Township (Mercer), and Oswego Lake all 59° on the 7th, and Walpack 58° and Sandyston 59° on the 9th.
The 14th brought a return of the 50°s at Walpack (58°) and Sandyston (59°). On the 15th, Walpack fell to 51°, Sandyston 53°, and High Point Monument (Sussex) 54°. Walpack reached 58° on the 16th, with Basking Ridge (Somerset) and Sandyston 59°. Sandyston also managed a 59° low on the 25th.
The daily maximum temperature equaled or exceeded 90° at one or more NJWxNet stations on 16 August days, two more than in July. The first of the 90° days arrived on the 6th, with Pennsauken at 92° and 28 other WxNet stations from 90°–91°. Five locations reached 90° on the 7th, and West Deptford (Gloucester) 91° on the 9th. Ten stations reached 91° and 12 got to 90° on the 10th. A six-day string of 90°s continued on the 11th with Howell (Monmouth) up to 95° and 47 WxNet stations from 90°–94°, while Harvey Cedars only got to 82°. The thermometer crept up further on the 12th with East Brunswick (Middlesex) and Jersey City (Hudson) at 97°, 24 stations from 95°–96°, and 35 from 90°–94°. The 13th was the hottest day of August, as seven stations topped out at 97°, 26 either 95° or 96°, and 26 from 90°–94°. Atlantic City Marina at 86° had the lowest maximum. Meanwhile, the daily minimum fell to just 80° at the Marina, while Sandyston was coolest at 65°. Figure 13 illustrates the diminished diurnal temperature range at the coast and in urban areas compared on inland suburban and particularly rural areas.
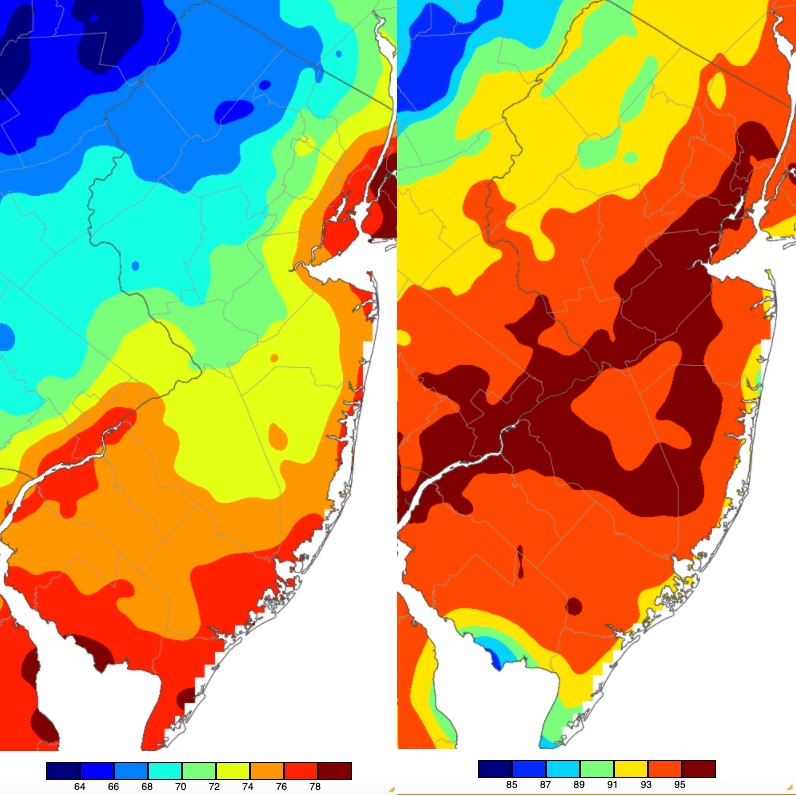
Figure 13. Daily minimum (left) and maximum (right) temperatures on August 13th based on a PRISM (Oregon State University) analysis generated using NWS, NJWxNet, and other professional weather stations. Note the differing scales (each in 2 °F increments) at the bottom of each map.
There was a little cooling on the 14th with Little Egg Harbor Township (Ocean) and West Creek topping out at 94°, while High Point Monument only made it to 77°. Following several cooler days, maximum temperatures cracked the 90° mark again on the 18th with 91° at Mannington (Salem) and Moorestown (Burlington). Nine stations made it to 91° but none higher on the 19th, when high levels of humidity associated with Tropical Storm Fred helped to keep minimums as high as 75°–79° at 36 WxNet locations and only as cool as 66° in Walpack.
After a short, wet break from the heat, the 90°s returned on the 23rd for a five-day run. Mannington hit 91° and eight locations 90° that day. Next up on the 24th were Cherry Hill (Camden) and Lower Alloways Creek Township at 93° and 42 locations from 90°–92°. Hopewell Township, Moorestown, and Piney Hollow (Gloucester) got to 95° on the 25th with 43 sites from 90°–94°. Basking Ridge and Moorestown followed with 95° on the 26th, with 48 stations from 90°–94°. The beat went on come the 27th, with four stations at 95° and 46 sites from 90°–94°. The 30th found Pennsauken and Mannington up to 91°.
Summer 2021 OverviewThe June through August period was warmer and wetter than normal. The average temperature of 74.5° was 1.4° above the 1991–2020 normal and ranked 6th warmest (Table 3).
| Rank | Year | Summer Avg. Temp. |
|---|---|---|
| 1 | 2010 | 75.7° |
| 2 | 2020 | 75.3° |
| 3 | 2016 | 74.9° |
| 4 | 2005 | 74.8° |
| 5 | 2011 | 74.6° |
| 6 | 2021 | 74.5° |
| 7 | 2019 | 74.4° |
| 7 | 2018 | 74.4° |
| 9 | 1999 | 74.3° |
| 10 | 2012 | 74.2° |
Table 3. The 10 warmest summers (June–August) across New Jersey since 1895.
Summer precipitation averaged 17.97”, which is 4.39” above normal and ranks 11th wettest since 1895 (Table 4). Scattered areas that were at one point or another subject to flash flood-inducing rains emerged as the wettest locations over the entire summer with from 20.00”–26.00” (Figure 14). The majority of New Jersey received 16.00”–20.00”. The southwest, far south, and extreme northwest were driest with 10.00”–16.00” falling. The wettest summer locations were found in seven counties and included Plainsboro (Middlesex) with 24.38”, Raritan (Hunterdon) 24.35”, four Flemington (Hunterdon) locations from 24.01”–22.69”, Rockaway Township (Morris) 23.85”, two Stafford Township (Ocean) sites at 23.34” and 22.11”, Hamilton (Mercer) 23.01”, Ringwood (Passaic) 22.93”, and Harrison (Hudson) 22.63”. Coming out on the short end were stations in five counties, including Woodstown (Salem) at 10.43”, two Middle Township (Cape May) stations with 11.37” and 12.49”, Sea Isle City (Cape May) 12.82”, Upper Deerfield (Cumberland) 12.71”, two Lower Township (Cape May) sites at 13.38” and 13.78”, Lambertville (Hunterdon) 13.57”, and Franklin Township (Somerset) 13.79”.
| Rank | Year | Summer Avg. Precip. |
|---|---|---|
| 1 | 2011 | 23.22" |
| 2 | 1938 | 19.92" |
| 3 | 1897 | 19.63" |
| 4 | 2013 | 19.43" |
| 5 | 1928 | 19.19" |
| 6 | 2009 | 19.18" |
| 7 | 1903 | 18.98" |
| 8 | 1975 | 18.70" |
| 9 | 1919 | 18.66" |
| 10 | 1911 | 18.27" |
| 11 | 2021 | 17.97" |
| 12 | 1920 | 17.96" |
| 13 | 1942 | 17.90" |
| 14 | 1945 | 17.58" |
| 15 | 1933 | 17.56" |
Table 4. The 15 wettest summers (June–August) across New Jersey since 1895.
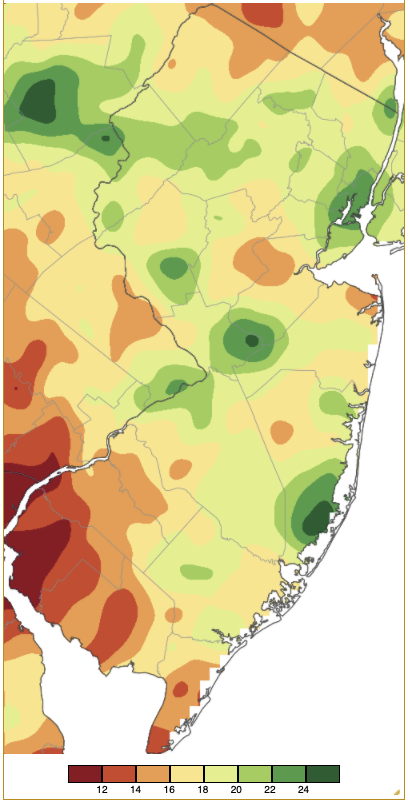
Figure 14. Summer (June–August) 2021 precipitation across New Jersey based on a PRISM (Oregon State University) analysis generated using NWS Cooperative and CoCoRaHS observations. Note the scale in inches at the bottom of the map. Totals range from 10.00”–12.00” (red) to 24.00”–26.00” (dark green).
For those seeking more detailed information on 5-minute, hourly, daily, and monthly conditions, please visit the following Office of the NJ State Climatologist's websites:
Rutgers NJ Weather Network
NJ Community Collaborative Rain, Hail and Snow Network
NJ Snow Event Reports
Interested in receiving our monthly summaries at the end of each month? Send us your e-mail address here to join the mailing list.
Past News Stories

